
A New Study on Combustion Behavior of Pine Sawdust Characterized by the Weibull Distribution*
2009-05-15 06:17LoKuoChaoWuKengTungChyangChienSongandTingWeiThe
Lo Kuo-Chao, Wu Keng-Tung, Chyang Chien-Song,** and Ting Wei-The
A New Study on Combustion Behavior of Pine Sawdust Characterized by the Weibull Distribution*
Lo Kuo-Chao1, Wu Keng-Tung2, Chyang Chien-Song1,** and Ting Wei-The1
1Department of Chemical Engineering, Chung Yuan Christian University, Chung Li 32023, China2Department of Forestry, National Chung Hsing University, Taichung 40227, China
An isothermal operation is implemented by employing a thermogravimetric analyzer (TGA) for simulating the thermal decomposition behavior of 58 μm pine sawdust in air atmosphere. An independent parallel reaction model is adopted in this study to describe the thermal decomposition mechanism. The Weibull distribution function is used to record and analyze the weight loss during isothermal decomposition at different temperatures (500, 600, 700, and 800°C). The total weight loss of the pine sawdust is assumed as a linear combination of individual weight loss from three components, including the char and two volatile matters. The plot of the thermal decomposition rate curve leads to kinetic parameters such as the reaction rate constants and the reaction order. The results show that the Weibull distribution function successfully represents decomposition curves of three components, and fits the experimental data very well. Therefore, this study provides a simple way to evaluate the decomposition rate of biomass combustion in a real combustor.
biomass, combustion, Weibull distribution, parallel reaction model, reaction kinetics
1 INTRODUCTION
Since pre-historic times, woody biomass had been the dominant energy source until abundant low-price fossil fuels became available during the early 19th century. Recent biomass energy development has attracted increasing attention due to oil price hikes. In 2006, biomass energy was the fourth largest source of total primary energy in the world, sharing about 10.6% [1]. In Taiwan, biomass energy with a potential of 3.3 million kiloliters of oil equivalent is the most important renewable energy source at present, except for conventional hydropower [2]. Currently, direct combustion is the simplest, most common and successful thermo-chemical process for converting biomass into energy. Kinetic studies of biomass combustion have been developed for a long time, but new findings have emerged, especially in recent years with the large demand for biomass energy. Therefore, decomposition kinetics of a variety of biomass feedstock is still an important issue for understanding the chemical behavior of complicated biomass fuels.
The combustion process of solid fuels can roughly be described as a series of sequential events, beginning with drying, followed by devolatilization, homogeneous oxidation of volatile matters and heterogeneous oxidation of solid char, and finally, the burning out of char. This study presents two important reactions in the solid phase in a combustion process, including pyrolysis reaction and oxidation reaction. In the pyrolysis reaction, solid fuels are devolatilized initially to produce volatile matter and the residue char. In the oxidation reaction, oxidation of char under the heterogeneous condition yields gas products and inert residues. The two reactions may be successive or simultaneous, depending on characteristics of the process employed [3, 4]. Generally, pyrolysis or initial burning occurring at<600°C is dominated by moisture evaporation. Devolatilization, oxidation, or ash transition occurring at 600°C<<1100°C is dominated by char oxidation and ash reduction [5]. The literature usually uses the term “oxidative pyrolysis” to describe pyrolysis reaction in the solid fuel combustion process. The most complicated combustion behavior is undoubtedly caused by oxygen. The literature suggests two possible reaction pathways in the oxidative pyrolysis reaction. One is gas phase diffusion, and the other is gas-solid chemical reaction. These two pathways determine the thermal decomposition performance of solid fuels [6-9]. On the other hand, practically applying combustion technology involves two engineering scopes, reactor design and chemical kinetics,.., combustor design and combustion rate. The two approaches enhance combustion efficiency, modify the combustor and control the reaction for solid fuel combustion. Combustor design can be studied by carrying out experiments or computational fluid dynamics (CFD), and kinetic analysis is the most significant way to understand combustion rate.
Currently most studies focus on pyrolysis under inert conditions and on residual char combustion, although in practical applications thermal decomposition of solid fuels often occurs with oxygen [7]. Because of the similar behavior in pyrolysis and combustion processes, experimental and analysis methods may be the same. Thermal gravimetric analysis (TGA) can be used as an analytical technique to obtain weight loss history of solid fuels during thermal decomposition. Weight loss as a function of temperature reflects the conversion of gas products yielded in the pyrolysis stage and char oxidation. In the TGA operation, the isothermal method maintains a constant temperature [10-13] and the dynamic heating method with a constant heating rate [3, 6-9, 14-39] is usually employed to study the solid fuel decomposition process. Derived weight loss curves of biomass obtained under dynamic heating conditions presents some significant peaks associated with its components. Different peaks of the decomposition rate curve merge as heating rate increases [40]. The same results are also found in isothermal experiments [11].
Fuel is a complex mixture of varied hydrocarbons. Typically, multiple reactions, caused by thermal decompositions of fuels, can be divided into the series and parallel reactions. In parallel reactions, various reactions take place simultaneously to yield different products. Two approaches are currently used to investigate parallel reactions with different definitions of biomass feedstock compositions. One describes biomass as a single homogeneous material, and the other describes biomass as a mixture of several components,.., cellulose, hemicellulose and lignin. The first approach assumes that branch reactions compete with each other and the products depend on the reaction competition [3, 6, 17, 34]. Contrarily, branch reactions in the second approach are independent of one another, but are affected by chemical components of biomass feedstock,.., the composition occurs within biomass components [4, 8, 9, 14, 19, 23-25, 27-29, 32, 33, 35, 36, 38, 39]. In series reactions, also called consecutive reactions, the reactant forms an intermediate product, which reacts further to yield another product.
Most kinetic studies on thermal decomposition of solid fuel are focused on the pyrolysis reaction with a given heating rate. Although the kinetic data can be analyzed easily by rising temperature experiments, solid fuels suddenly fed into a high temperature combustor (.., fluidized bed combustor, FBC) cannot be simulated by the dynamic heating system. These volatile matters are ignited and burned around fuel particles immediately when fuel particles are in a high temperature environment. Moreover, in the dynamic heating environment, devolatilization starts at about 220°C, but the temperature is not high enough for volatile ignition. When the temperature is raised to ignite volatile matters, the composition of fuel has changed. Although isothermal TGA tests simulate the real combustion environment well, sufficient data for combustion in a rapid heating system at high temperature is limited. Therefore, we conduct kinetic analysis of thermal decomposition of woody biomass in oxidative atmosphere in this study. An isothermal operation of TGA is used to simulate the decomposition behavior of pine sawdust fed into a combustor with high temperature in air-atmosphere. We assume that the total weight loss of the pine sawdust is a linear combination of the individual weight loss from three components including the char and two volatilizable matters. An independent parallel reaction model is used to describe pine sawdust thermal decomposition in oxidative atmosphere. The Weibull distribution function is used to fit and analyze the experimental data. The kinetic parameters such as reaction rate constants and the reaction order are obtained from the plot of thermal decomposition rate.
2 THEORY
2.1 Parallel reaction model
As mentioned above, when combustion temperature increases, derived thermogravimetric (DTG) curve of thermal decomposition presents relatively narrow and two peaks of decomposition rate merge into a higher decomposition rate peak [11, 40]. Based on this result, we adopt a three-independent-parallel-reaction model to characterize the biomass combustion shown in Fig. 1. We assume that biomass components decompose independently of one another. The components are volatile matter 1 (VM1), volatile matter 2 (VM2) and char. The details of the thermal decomposition are described in the next section. The multiple-parallel-reaction model describes the decomposition behavior of biomass pyrolysis and combustion successfully.
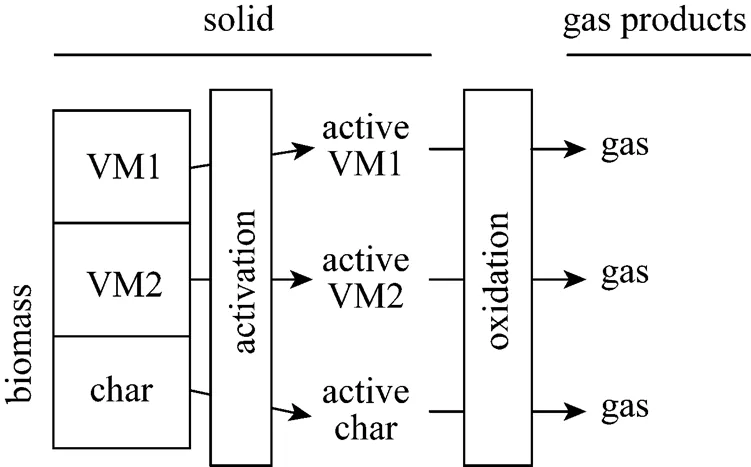
Figure 1 Scheme of three-independent-parallel-reaction model
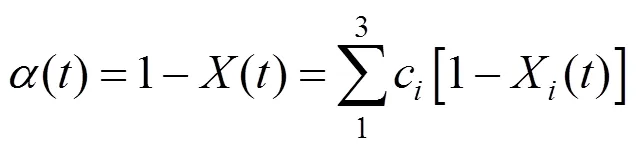
The overall weight loss conversion is defined as
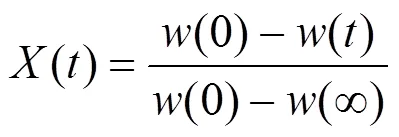
where() is the normalized weight loss,() is an actual mass at time,(0) is the initial sample mass, and(∞) is the mass at the end of isothermal experiment. The residue mass ratio of biomass() during combustion is the sum of all the component weight reductions as a function of time ():

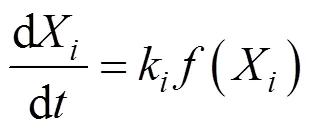
where d/dis the overall mass loss rate, dX/dis the decomposition rate of component,kis the kinetic rate constant of component, and() is the reaction model.
2.2 Kinetic analysis
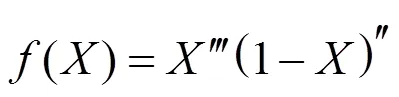
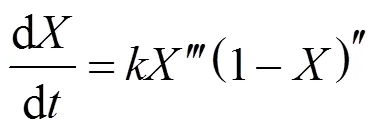
whereandare the reaction order. The thermal decomposition rate of biomass can be expressed by substituting Eq. (5) into Eq. (4):
The whole thermal decomposition process can be divided into two parts by the inflection point [the apex of derived thermogravimetric (DTG) curve]. Before the inflection point the reaction rate increases with time. The period is defined as the activation stage with an initial accelerating rate, and another period after the inflection point is defined as the oxidation stage. Bradbury. suggests that the initial accelerating period at lower temperatures is a high activation energy process converting biomass from an “inactive” to an “active” form [44]. The initial period at higher temperatures is established from the time required for converting biomass to reach the thermal equilibrium. Based on the assumption of active intermediates, the well-known cellulose pyrolysis model, called Broido- Shafizadeh model, describes two parallel competitive reactions during the initial accelerating period [44]. The raw cellulose sample in this model reacts at the elevated temperature to form the so-called “active cellulose” with a first order reaction. The active cellulose decomposes further by two competitive mechanisms to produce either volatile matters or solid intermediates. An initial accelerating period in high temperature experiments is observed in this study, but reducing the feedstock sample size can minimize the heat transfer limitation. Therefore, the initial accelerating period can still be defined as an activation process. The biomass is not activated completely until the decomposition rate reaches maximum. The decomposition rate decelerates afterward with increasing conversion.
2.3 Weibull distribution
Sánchez. analyze the fitting capability of twenty-five probability distribution functions (PDF) for distillation data of petroleum fractions [45]. They conclude that the Weibull distribution is one of the best distribution functions for fitting distillation data, considering their ranking and the required CPU (central processing unit) time. The Weibull distribution [46], named after Waloddi Weibull, was originally introduced by Rosin and Rammler [47] to analyze particle size distribution. The so called Rosin-Rammler distribution is a continuous probability distribution with two parameters, convenient to use for a mathematical distribution model. The Weibull distribution has recently been extensively used for investigating thermal decomposition [16, 33, 38, 41, 43, 45, 48].
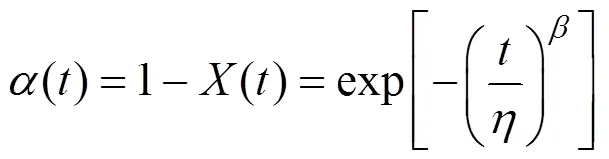
A cumulative distribution function (CDF) of the Weibull function is employed to describe biomass weight loss during combustion. We assume that the combustion time of the corresponding weight loss is randomly distributed by the conventional two-parameter Weibull cumulative distribution function:
3 EXPERIMENTAL
The isothermal air atmosphere TGA combustion experiments were performed in a rapidly heated environment to simulate a real combustor at four combustion temperatures, 500, 600, 700 and 800°C. The PerkinElmer TGA-7 was used to simulate the combustion atmosphere. All operation processes were conducted under the isothermal condition. The weighted sample (≈ 5 mg) was first placed on the fixed platinum sample pan in the open air, and the furnace with a manual moving device was preheated, separated from the fixed sample pan. When the furnace temperature was heated to the setting point,.., an isothermal condition, the furnace was lifted manually to envelop the sample pan. Afterward, the sample was rapidly heated to the setting temperature by radiation heat transfer. The TGA system was purged by air during all tests with flow rate 40 ml·min-1. The change of weight loss and temperature of the sawdust sample under the closed air-flow condition were collected and analyzed.
The biomass feedstock used in this study was 58 μm pinewood sawdust. As mentioned above, using a fine powder minimized the possible effect of transport resistances,.., heat conductivity or inner-particle diffusion. The proximate and ultimate analyses of pinewood sawdust are listed in Table 1.
4 RESULTS AND DISCUSSION
4.1 Thermogravimetric curves
Figure 2 shows the DTG curves of pine sawdust consisting of several overlapping peaks. Two obvious peaks appear at lower temperature, implying two devolatilization stages during biomass combustion. The leading peak is smaller than the following one. There is only one large peak at 800°C. Two peaks are merged at higher temperature. The mass fraction of the leading peak at 500°C, calculated by integrating the area under the DTG curve, is larger than the water content of the raw sawdust sample. Therefore, this work suggests that a fraction of the volatile matter is released early with the drying process, and the remainder is released later in the major decomposition process. Similar results can be found in some biomass pyrolysis literature [9, 15, 19, 23, 25, 27-29, 31, 32, 36]. These reports indicate the occurrence of biomass pyrolysis with increasing temperature at a given heating rate. Volatile matters released in temperature sequence include hemicellulose (>220°C), cellulose (315°C<< 390°C) and lignin. Although their results (pyrolysis at nonisothermal) seem similar to the findings in this work (combustion at isothermal), three stages of the weight loss do not represent the thermal decompositions of hemicellulose, cellulose and lignin. Therefore, as mentioned above, we characterize pine wood compositions as VM1, VM2 and char in this study.
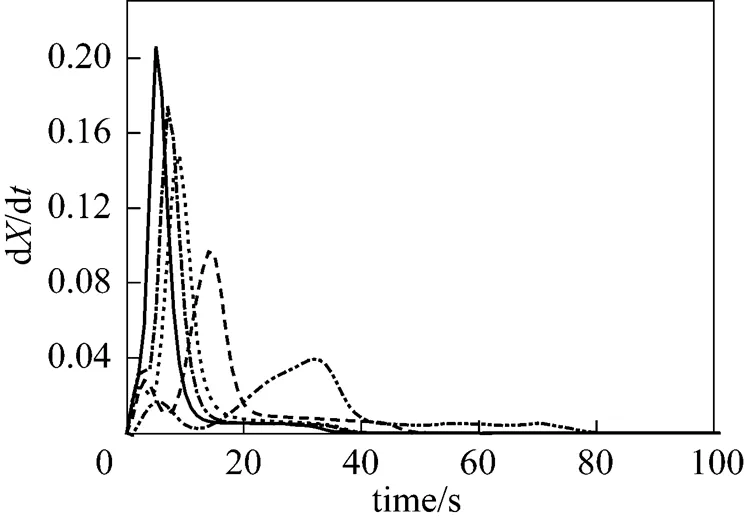
Figure 2 DTG curves of pine sawdust decomposition in the oxidative atmosphere

TGA is used to carry out a non-isothermal pyrolysis test of fine pine sawdust with a heating rate of 200 K·min-1in the inert atmosphere to define the mass fraction of three compositions. The DTG curve of the pyrolysis test is shown in Fig. 3. The VM1 mass fraction is about 8%, char fraction assumed as fixed carbon is about 17% (Table 1), and the rest is classified into VM2, 75%.
4.2 Weibull distribution
The experimental data obtained by thermal decomposition of pine sawdust at four temperatures are plotted as TG curves (represented as the open circle symbol) in Fig. 4. The vertical axes are the residue mass ratio and the horizontal axes are the time scaled second. The Weibull distribution function describes the weight loss of fine pine sawdust during combustion. Before applying the Weibull distribution function, we make certain assumptions for thermal decomposition of pine sawdust. First, the independent parallel reaction model is adopted to describe the thermal decomposition in the oxidative atmosphere. The total weight loss of pine sawdust is assumed as a linear combination of individual weight loss from three components, VM1, VM2 and char. The mass fractions of three components are obtained from Fig. 3. Also, after releasing VM1 and VM2 completely, the total weight loss should be equal to the weight loss of char only.
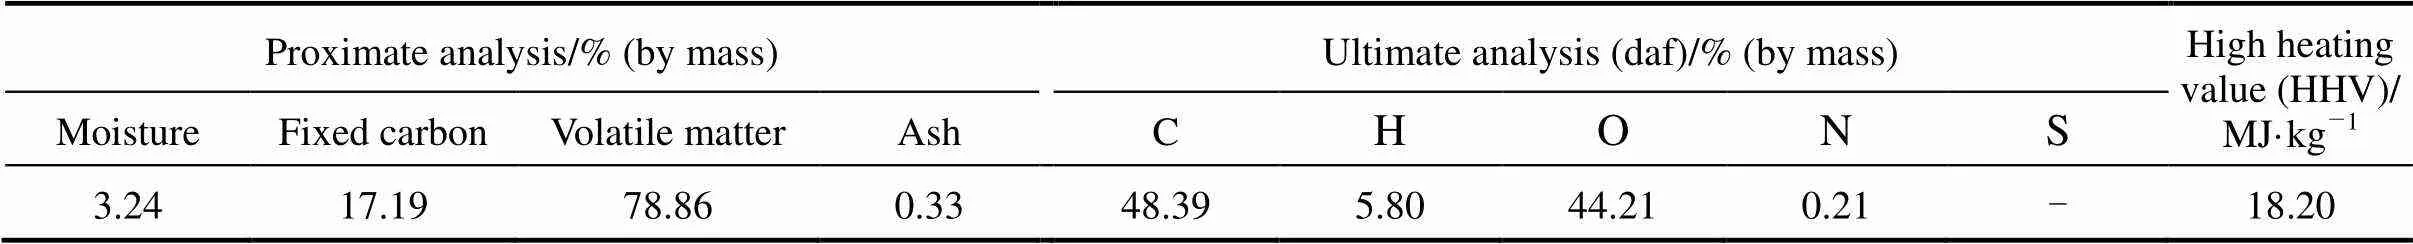
Table 1 Proximate and ultimate analyses of pinewood sawdust
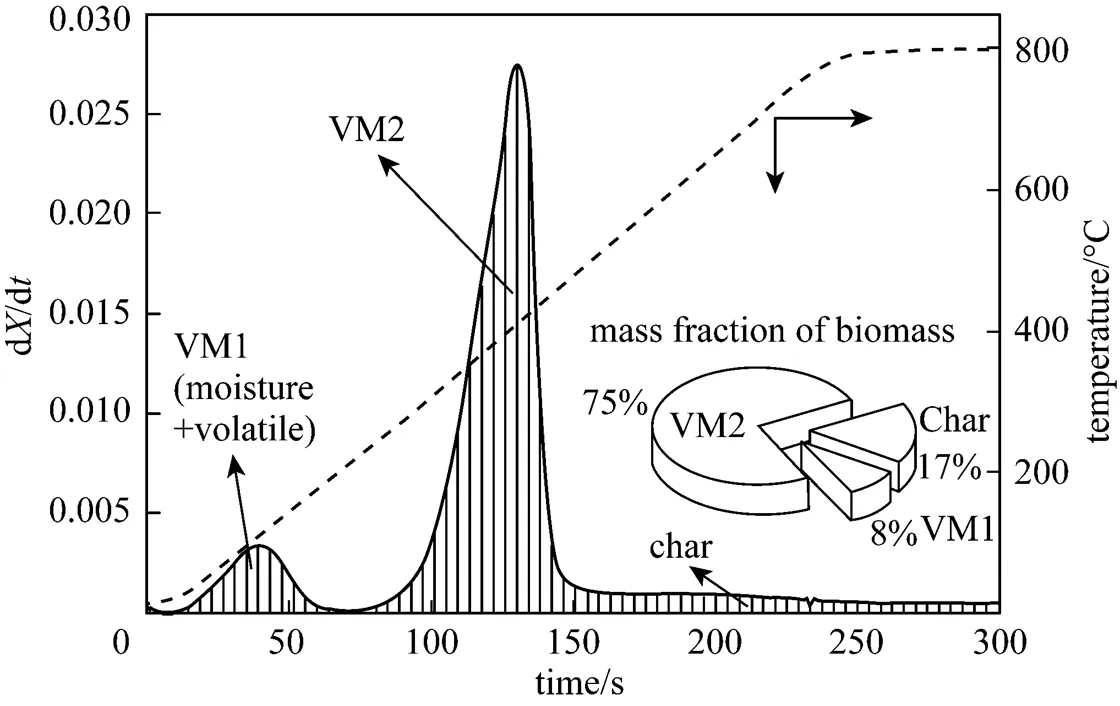
Figure 3 The DTG curve of pine sawdust pyrolysis with a heating rate of 200 K·min-1
Based on the above assumptions, we implement a non-linear regression with the Weibull cumulative distribution function represented by Eq. (7) to fit total weight loss data of pine sawdust (.., TG curve) and individual weight loss of VM1, VM2 and char. Parameters of the Weibull distribution function at four different temperatures are listed in Table 2. All coefficients of determination (2) for examining the best-fitting of Eq. (7) are larger than 0.9990, indicating good data fitting with the Weibull distribution based on the parallel reaction model. The best-fitting curves are shown in Fig. 4. According to the regression results, the simulated total weight loss displayed as solid lines is the sum of three components by applying the Weibull distribution.
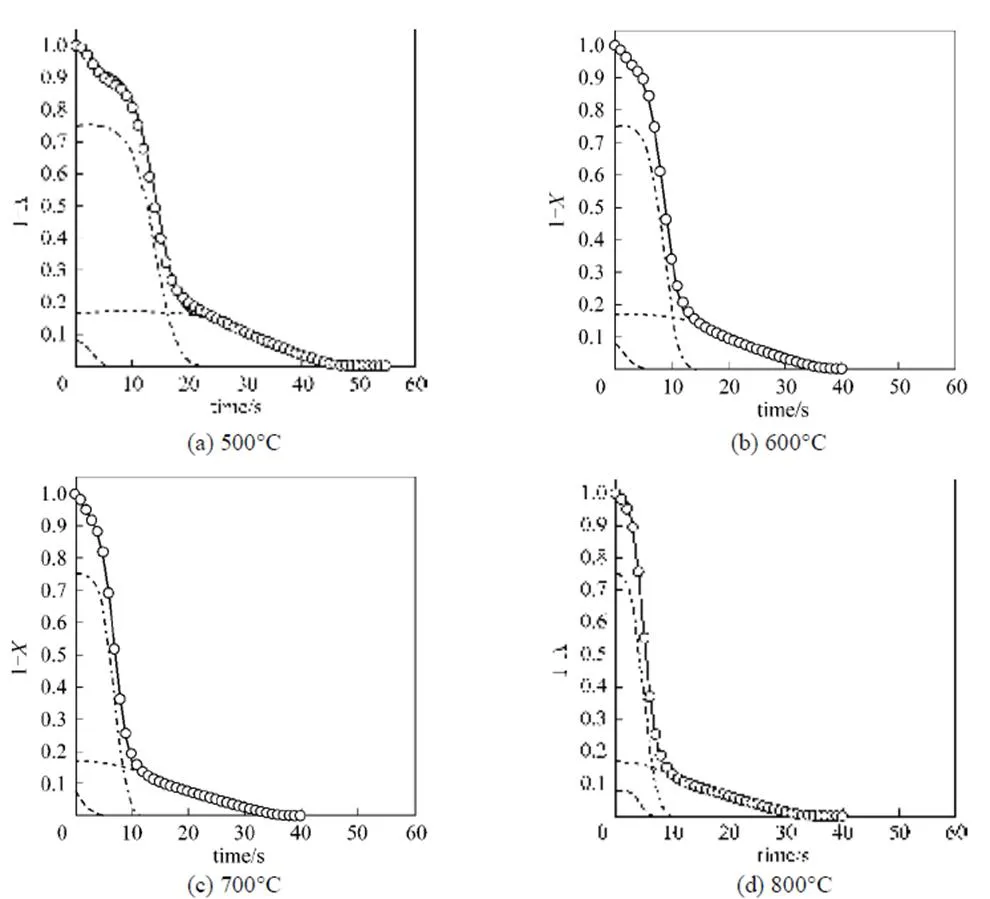
Figure 4 Plot of experimental data and decay curves of three components simulated by the Weibull distribution function
VM1; VM2; char; —— VM1+VM2+char; ○ exp
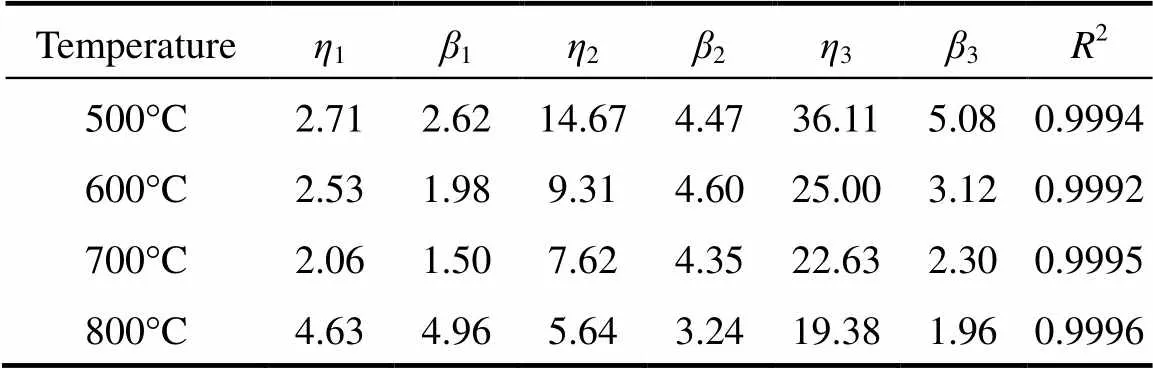
Table 2 The Weibull distribution parameters at four temperature levels
Parameters of the Weibull distribution decrease with increasing temperature, but the results for those of VM1 are contrary. This may be because more heat is provided at higher temperature to enhance the activation reaction. Therefore, the initial decomposition of VM2 and char occurs earlier. For VM1, the parameters1and1decrease with temperature at lower temperatures. On the contrary, the values of1and1leap at 800°C. The results show that at 800°C the maximum decomposition rate of VM1 and VM2 occurs at 4.63s (1) and 5.64s (2), respectively. Compared to other temperatures, the shortest time difference indicates that the devolatilization processes of VM1 and VM2 almost overlap at 800°C. Decomposition of VM2 at lower temperatures is difficult, requiring more decomposition time compared to VM1. On the other hand, decomposition of VM2 at a higher temperature is faster due to a large heat supply, but VM1 must also share the limited heat supply with VM2 for conducting decomposition. The time required for reaching the maximum decomposition rate of VM1 is then prolonged. Therefore, decomposition competition between VM1 and VM2 causes two decomposition processes to overlap nearly.
Figure 5 shows the DTG curve corresponding to Fig. 4. The simulated overall rate curves (.., solid lines) in Fig. 5 are in good agreement with the experimental data. Two distinct peaks appear at 500°C [Fig. 5 (a)], and merge with increasing temperature [see Figs. 5 (b)-(d)]. The first peak is VM1 decomposition, and the second is governed mostly by VM2 decomposition, similar to the non-isothermal decomposition curve shown in Fig. 3. The single peak at a higher temperature also proves near overlap of the VM1 and VM2 decomposition processes.
4.3 Kinetics and the rate expression
According to Eq. (6), the plot of decomposition rate (d/d) against the conversion () at different temperatures for three components is shown in Fig. 6, showing similar rate curve shapes. The kinetic parameters,,andcan be obtained by fitting the data of derived curves in Fig. 6. The values of m and n determine a specific conversion at the maximum decomposition rate, (d/d)m, denoted asm, which is obtained by setting the first derivative of Eq. (5) to 0 and solving for:
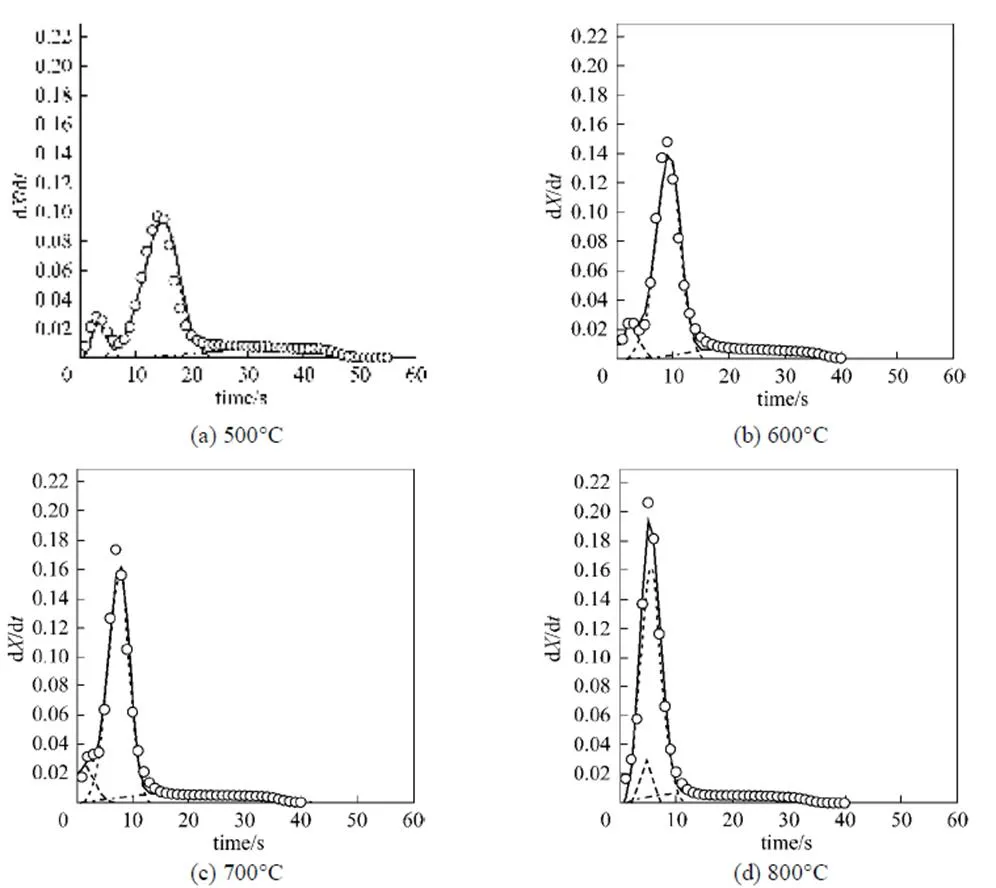
Figure 5 Plot of DTG curves corresponded to Fig. 4 at different temperatures
VM1; VM2; char; —— VM1+VM2+char; ○ exp

The maximum decomposition rate is calculated by substituting the corresponding kinetic parameters andminto Eq. (6). Table 3 lists kinetic parameters,m, and maximum decomposition rates for three components at different temperatures. All2are larger than 0.9990, meaning good data fitting with Eq. (6). The value ofmirepresents the peak separating the activation and oxidation stages. According to Eq. (8), the reaction orders,and, determine the peak value and skewness, respectively. For>the peak curve is positively skewed (mi<0.5), and for
Figure 6 Plot of degradation rate. conversion of three components

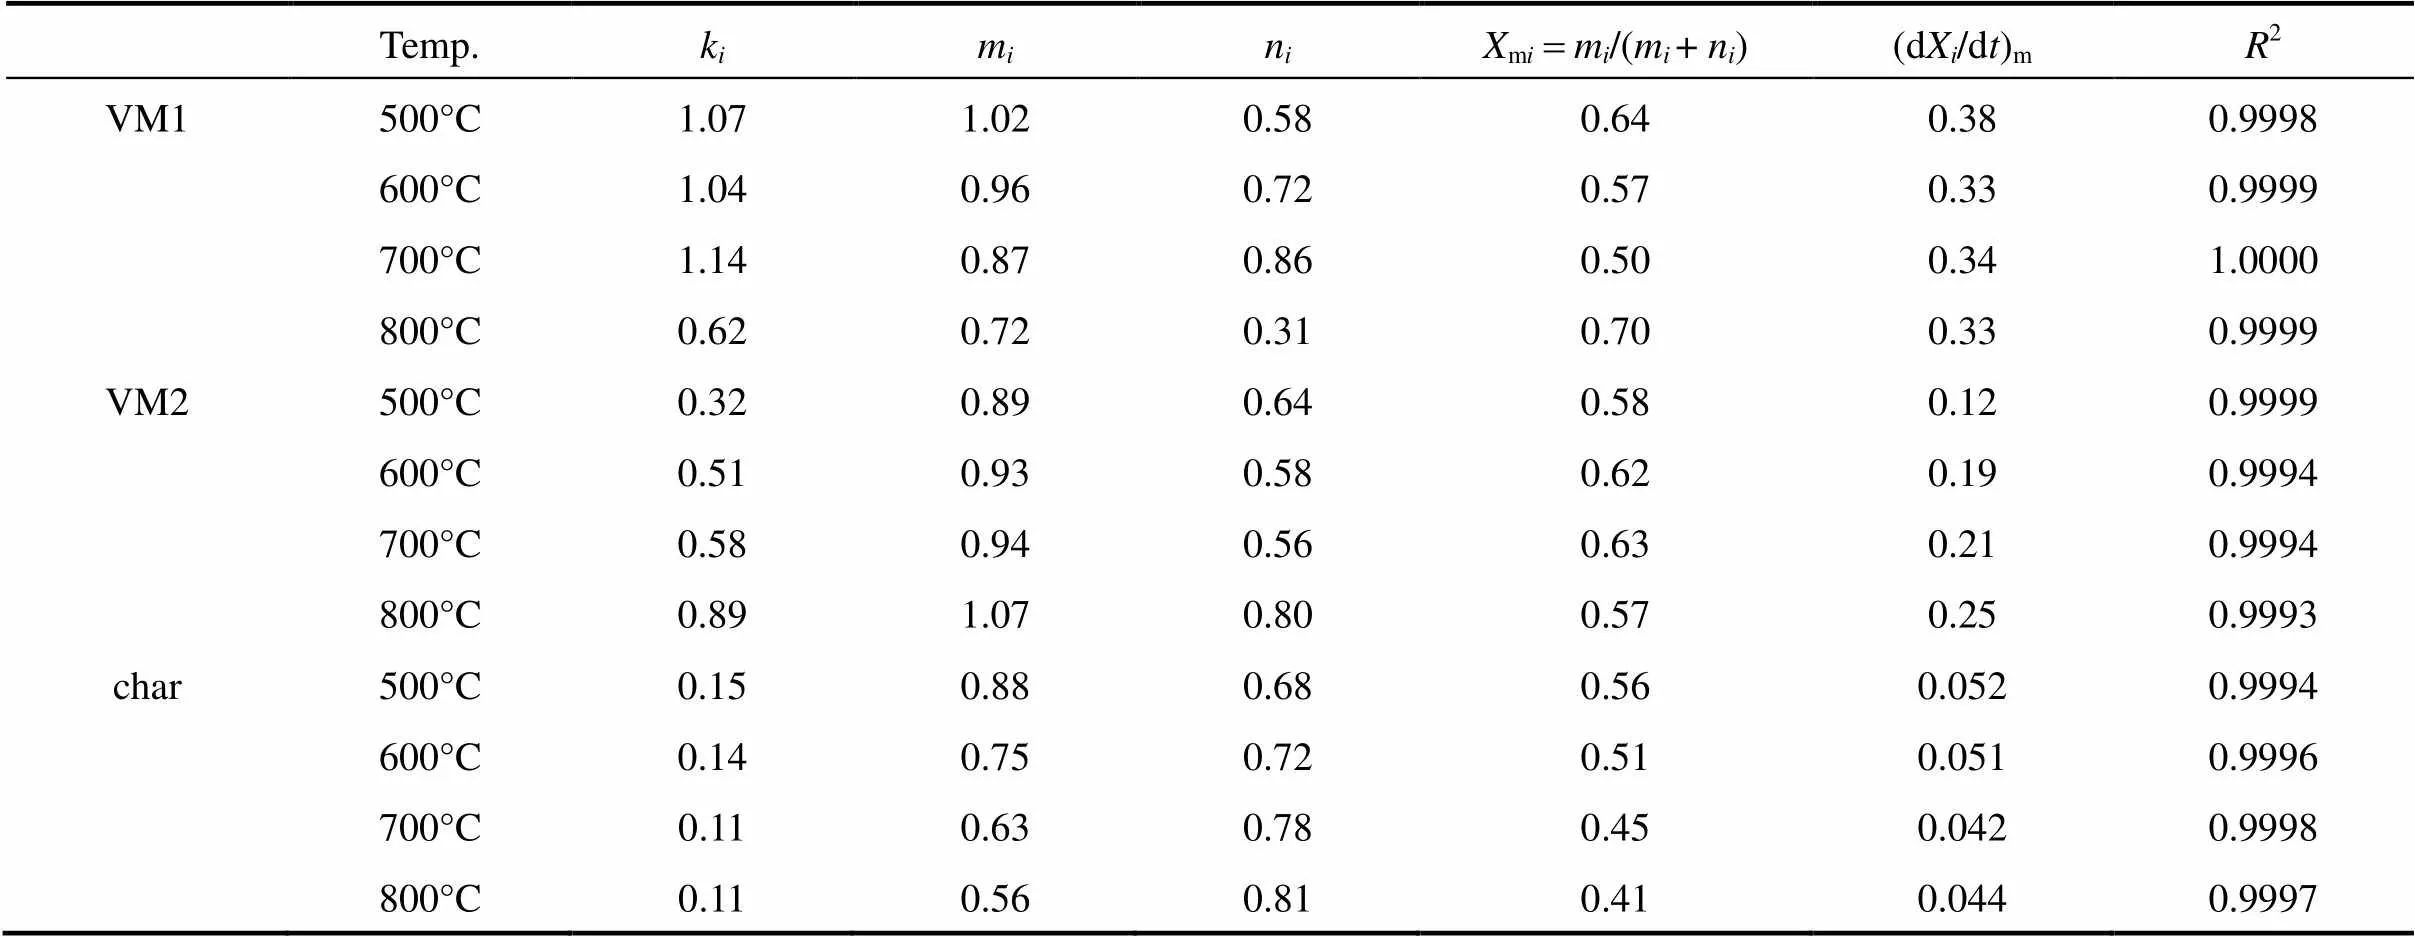
Table 3 The kinetic parameters of three components at four temperature levels
By comparing the rate constant,, the decomposition process in rate sequence is VM1>VM2>char. The maximum rate also increases with the value of, except for VM1 decomposition. The value ofis only 0.62 s-1for VM1 decomposition at 800°C due to the mutual influence betweenVM1 and VM2 decomposition,.., the decomposition of VM1 and VM2 nearly overlapping at 800°C. The decomposition time of VM1 is prolonged because of competing with VM2 decomposition. On the other hand, char is seemingly not affected by VM1 and VM2 decomposition. However, the value oftypically increases with temperature, but the results in char are contrary. Table 3 shows thatof the char decreases with temperature. It is attributed to the change of char structure at different temperatures. The carbonaceous structure of char is rearranged dependent on the temperature, residence time and heating rate [49].
5 CONCLUSIONS
An isothermal operation of the thermogravimetric analyzer is used for a preliminary study of the thermal decomposition of pine sawdust with a size of 58 μm in air atmosphere. A three-parallel-reaction model and the Weibull distribution function are employed to describe the thermal decomposition histories at four temperatures. It is assumed that the total weight loss of the pine sawdust is a linear combination of the individual weight loss from three components including two volatile matters (VM1 and VM2) and char. A non-linear regression with the Weibull cumulative distribution function based on the parallel reaction model successfully fits the data of total weight loss of the pine sawdust (.., TG curve), and the individual weight loss of VM1, VM2 and char. All coefficients of determination are larger than 0.9990, indicating good data fitting. A nucleation reaction model is used to characterize the rate curve. Kinetic parameters such as the reaction rate constants and the reaction order are obtained from the plot of the thermal decomposition rate curve. The reaction orders determine the peak value and skewness.
The results show that the Weibull distribution parameters decrease with increasing temperature, but contrary results are obtained for VM1. This may be attributed to decomposition competition between VM1 and VM2 at higher temperatures. Consequently, the time required for reaching the maximum decomposition rate of VM1 is prolonged. Moreover, although it seems that VM1 and VM2 decomposition does not affect char, the reaction rate constant of char decreases with temperature. This may be attributed to the change of char structure at higher temperatures, so the diffusion of oxygen into char is difficult.
In conclusion, the parallel reaction model with the Weibull distribution function can describe the decomposition curves very well, and the kinetic study suggests that the nucleation reaction can be used for expressing the peaked shape reaction rate profile. The results also provide a simple way to evaluate the decomposition rate of biomass combustion in a real combustor.
Nomenclature
initial mass fraction of component
reaction rate constant, s-1
reaction order in nucleation reaction expression
reaction order in nucleation reaction expression
2coefficient of determination
temperature,°C
time, s
mass, mg
conversion
residue mass ratio
shape parameter of Weibull distribution function
scale parameter of Weibull distribution function, s
Subscripts

m maximum value
1 International Energy Agency (IEA), Key World Energy Statistics 2008, IEA, Paris (2008).
2 Industrial Technology Research Institute, Taiwan Renewable Energy and Conventional Power Market, British Trade and Cultural Office, Taipei (2006).
3 Conesa, J.A., Font, R., Fullana, A., Caballero, J.A., “Kinetic model for the combustion of tyre wastes”,, 77, 1469-1475 (1998).
4 Conesa, J.A., Fullana, A., Font, R., “Thermal decomposition of meat and bone meal”,..., 70, 619-630 (2003).
5 Zheng, G., Koziński, J.A., “Thermal events occurring during the combustion of biomass residue”,, 79, 181-192 (2000).
6 Senneca, O., Chirone, R., Salatino, P., “A thermogravimetric study of nonfossil solid fuels (2) Oxidative pyrolysis and char combustion”,, 16, 661-668 (2002).
7 Senneca, O., Chirone, R., Salatino, P., “Oxidative pyrolysis of solid fuels”,..., 71, 959-970 (2004).
8 Senneca, O., Chirone, R., Salatino, P., Nappi, L., “Patterns and kinetics of pyrolysis of tobacco under inert and oxidative conditions”,..., 79, 227-233 (2007).
9 Skodras, G., Grammelis, P., Basinas, P., Kakaras, E., Sakellaropoulos, G., “Pyrolysis and combustion characteristics of waste-derived feedstock”,...., 45, 3791-3799 (2006).
10 Bilbao, R., Mastral, J.F., Aldea, M.E., Ceamanos, J., “Kinetic study for the thermal decomposition of cellulose and pine sawdust in an air atmosphere”,..., 39, 53-64 (1997).
11 Di Blasi, C., Lanzetta, M., “Intrinsic kinetics of isothermal xylan degradation in inert atmosphere”,..., 40/41, 287-303 (1997).
12 Reina, J., Velo, E., Puigjaner, L., “Thermogravimetric study of the pyrolysis of waste wood”,, 320, 161-167 (1998).
13 Lu, P., Chang, J., Wang, T., Wu, C., “A kinetic study on biomass fast catalytic pyrolysis”,, 18, 1865-1869 (2004).
14 Burnham, A.K., Oh, M.S., Crawford, W., Samoun, A.M., “Pyrolysis of Argonne Premium coals: activation energy distribution and related chemistry”,, 3, 42-55 (1989).
15 Varhegyi, G., Antal, Jr. M.J., Szekely, T., Szabo, P., “Kinetics of the thermal decomposition of cellulose, hemicellulose, and sugar cane bagasse”,, 3, 329-335 (1989).
16 Lakshmanan, C.C., White, N., “A new distributed activation energy model using Weibull distribution for the representation of complex kinetics”,, 8, 1158-1167 (1994).
17 Várhegyi, G., Antal, Jr. M.J., Jakab, E., Szabó, P., “Kinetic modeling of biomass pyrolysis”,..., 42, 73-87 (1997).
18 Güneş, M., Güneş, S., “The influences of various parameters on the numerical solution of nonisothermal DAEM equation”,., 336, 93-96 (1999).
19 Órfão, J.J.M., Antunes, F.J.A., Figueiredo, J.L., “Pyrolysis kinetics of lignocellulosic material—Three independent reactions model”,, 78, 349-358 (1999).
20 Saade, R.G., Koziński, J.A., “Numerical modeling and TGA/FTIR/ GCMS investigation of fibrous residue combustion”,, 18, 391-404 (2000).
21 Wilburn, F.W., “Kinetic of overlapping reactions”,, 354, 99-105 (2000).
22 Guo, J., Lua, A.C., “Kinetic study on pyrolysis process of oil-palm solid waste using two-step consecutive reaction model”,, 20, 223-233 (2001).
23 Grønli, M.G., Várhegyi, G., Di Blasi, C., “Thermogravimetric analysis and devolatilization kinetics of wood”,...., 41, 4201-4208 (2002).
24 Vamvuka, D., Kastanaki, E., Lasithiotakis, M., “Devolatilization and combustion kinetics of low-rank coal blends from dynamic measurements”,...., 42, 4732-4740 (2003).
25 Vamvuka, D., Pasadakis, N., Kastanaki, E., “Kinetic modeling of coal/agricultural by-product blends”,, 17, 549-558 (2003).
26 Branca, C., Di Blasi, C., “Global intrinsic kinetics of wood oxidation”,, 83, 81-87 (2004).
27 Lapuerta, M., Hernández, J.J., Rodríguez, J., “Kinetics of devolatilisation of forestry wastes from thermogravimetric analysis”,, 27, 385-391 (2004).
28 Várhegyi, G., Grønli, M.G., Di Blasi, C., “Effects of sample origin, extraction, and hot-water washing on the devolatilization kinetics of chestnut wood”,...., 43, 2356-2367 (2004).
29 Mészáros, E., Várhegyi, G., Jakab, E., Marosvölgyi, B., “Thermogravimetric and reaction kinetic analysis of biomass samples from an energy plantation”,, 18, 497-507 (2004).
30 Cai, J., He, F., Yi, W., Yao, F., “A new formula approximating the Arrhenius integral to perform the nonisothermal kinetics”,..., 124, 15-18 (2006).
31 Yang, H., Yan, R., Chen, H., Zheng, C., Lee, D.H., Liang, D.T., “In-depth investigation of biomass pyrolysis based on three major components: Hemicellulose, cellulose and lignin”,, 20, 388-393 (2006).
32 Hu, S., Jess, A., Xu, M., “Kinetic study of Chinese biomass slow pyrolysis: Comparison of different kinetic models”,, 86, 2778-2788 (2007).
33 Cai, J., Liu, R., “Weibull mixture model for modeling nonisothermal kinetics of thermally stimulated solid-state reactions: Application to simulated and real kinetic conversion data”,..., 111, 10681-10686 (2007).
34 Branca, C., Iannace, A., Di Blasi, C., “Devolatilization and combustion kinetics of Quercus cerris bark”,, 21, 1078-1084 (2007).
35 Lapuerta, M., Hernández, J.J., Rodríguez, J., “Comparison between the kinetics of devolatilization of forestry ans agricultural wastes from the middle-south regions of Spain”,, 31, 13-19 (2007).
36 Müller-Hagedorn, M., Bockhorn, H., “Pyrolytic behavior of different biomasses (angiosperms) (maize plants, straws, and wood) in low temperature pyrolysis”,..., 79, 136-146 (2007).
37 Khalil, R.A., Mészáros, E., Grønli, M.G., Várhegyi, G., Mohai, I., Marosvölgyi, B., Hustad, J.E., “Thermal analysis of energy crops (I) The applicability of macro-thermobalance for biomass studies”,..., 87, 52-59 (2008).
38 Cai, J., Liu, R., “Application of Weibull 2-mixture model to describe biomass pyrolysis kinetics”,, 22, 675-678 (2008).
39 Grammelis, P., Basinas, P., Malliopoulou, A., Sakellaropoulos, G., “Pyrolysis kinetics and combustion characteristics of waste recovered fuels”,, 88, 195-205 (2009).
40 Bridgewater, A.V., Fast Pyrolysis of Biomass: A Handbook Vol. 3, CPL Press, Newbury, 121-146 (2005).
41 Burnham, A.K., Braun, R.L., “Global kinetic analysis of complex materials”,, 13, 1-22 (1999).
42 Šesták, J., Berggren, G., “Study of the kinetics of the mechanism of solid-state reactions at increasing temperatures”,., 3, 1-12 (1971).
43 Janković, B., “Isothermal reduction kinetics of nickel oxide using hydrogen: Conventional and Weibull kinetic analysis”,..., 68, 2233-2246 (2007).
44 Bradbury, A.G.W., Sakai, Y., Shafizadeh, F., “A kinetic model for pyrolysis of cellulose”,...., 23, 3271-3280 (1979).
45 Sánchez, S., Ancheyta, J., McCaffrey, W.C., “Comparison of probability distribution functions for fitting distillation curves of petroleum”,, 21, 2955-2963 (2007).
46 Weibull, W., “A statistical distribution function of wide applicability”,...., 18 (3), 293-297 (1951).
47 Rosin, P., Rammler, E., “Regularities in the size distribution of cement particles”,.., 7, 29-33 (1933).
48 Cai, J., Liu, R., “Research on water evaporation in the process of biomass pyrolysis”,, 21, 3695-3697 (2007).
49 Biagini, E., Simone, M., Tognotti, L., “Characterization of high heating rate chars of biomass fuels”,..., 32, 2043-2050 (2009).
2009-06-08,
2009-08-28.
the Chung Yuan Christian University (CYCU-97-CR-CE).
** To whom correspondence should be addressed. E-mail: cschyang@gmail.com
 Chinese Journal of Chemical Engineering2009年5期
- Chinese Journal of Chemical Engineering的其它文章
- Molecular Simulation of CO2/H2 Mixture Separation in Metal-organic Frameworks: Effect of Catenation and Electrostatic Interactions*
- Deactivation Kinetics of Nitrile Hydratase in Free Resting Cells*
- Corrosion Behavior of TP316L of Superheater in Biomass Boiler with Simulated Atmosphere and Deposit
- Influence of A-type Zeolite on Methane Hydrate Formation*
- Effects of Sintering Atmosphere on the Microstructure and Surface Properties of Symmetric TiO2Membranes*
- Improvement of Isomerization Process of Crude Isoamylene with Tertiary-amyl-alcohol Addition