
Development of an occupant restraint system model and parametric study on equivalent crash pulse in vehicle frontal offset crash
2012-06-21 01:58LIZhigang李志刚ZHANGJinhuan张金换MAChunsheng马春生
LI Zhi-gang(李志刚), ZHANG Jin-huan(张金换), MA Chun-sheng(马春生)
(State Key Laboratory of Automotive Safety and Energy,Tsinghua University,Beijing 100084,China)
In general,the primary factors affecting occupant injury are crash pulse severity,restraint system,and occupant cabin space under full frontal and frontal offset crash[1].The crash pulse severity represents the total energy absorbed by vehicle structure during vehicle crash.It represents the performance of a vehicle and its safety level.It is known that the crash pulse will vary with different vehicles,including the peak value of the crash pulse and the time duration.Yu et al conducted optimum on the crash pulse of vehicle and occupant restraint system,in which the crash pulses were given three different peak values and two of them varied based on a baseline value,however,the time duration of each peak value was not treated as design variables[2].Grimes and Lee investigated the effects of several different crash pulse shapes on occupant kinematics and response through simulation[3].According to the comparison and observation,most of the vehicles’pulses can be treated as typical dual-trapezoid shapes with two peak values in frontal offset crash.In order to analyze the effect of more equivalent factors fully,including the peak values and time durations,on dummy injury metrics,①a vehicle finite element(FE)model and occupant restraint system (ORS)model in the offset crash were developed and validated against test;②the crash pulse was equivalent to a dual-trapezoid shape pulse and was quantitatively described by six parameters;③parametric studies were conducted to analyze the sensitivities of the parameters of equivalent crash pulse on drive injury metrics.
1 Model development and validation
1.1 Two steps of the numerical study in vehicle passive safety
Two steps were used to conduct numerical study in vehicle crash safety as shown in Fig.1.The whole vehicle FE model used to conduct crash simulation was treated as the first step and the ORS model used to evaluate occupant injury was regarded as the second step.The vehicle crash pulse and the deformation of vehicle primary structures which were treated as the interface of these two levels were put into the ORS model to conduct further simulation.In this study,the ORS model only refers to the driver side restraint system model.
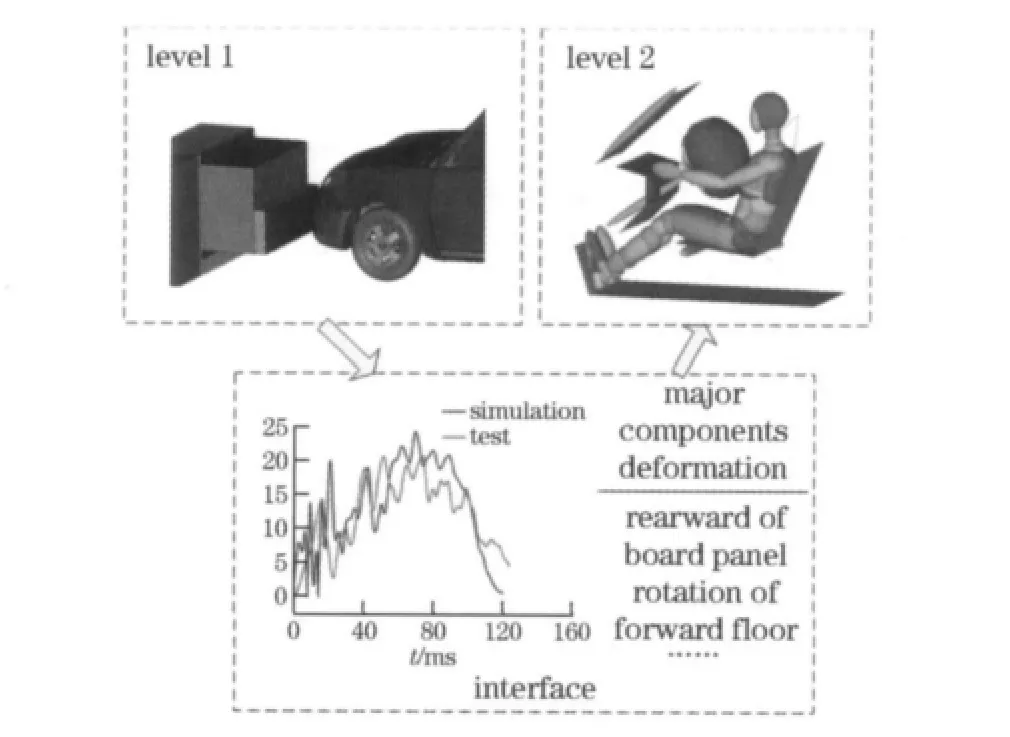
Fig.1 Two levels for vehicle crash and occupant protection
1.2 Development of vehicle FE model and validation against test data
The frontal offset crash FE model was developed based on one physical vehicle using HYPERMESH and LSDYNA and there are 807 462elements in total.Partial model can be seen from levell in Fig.1.Both simulation and test were conducted under the condition of C-NCAP[4]with the crash velocity of 56km/h.The comparison of linear acceleration between test and simulation are shown in Fig.2which shows that the peak acceleration of the simulation is slightly higher than the test.This was probably because the engine was treated as a rigid body and the front bumper was a little stiffer in the simulation model than in the physical vehicle in the test.The biggest difference of crash pulse between simulation and test is the first peak value as shown in Fig.2,however,the peak value of the dummy injury metrics were caused by the second peak value of the crash pulse which can be observed from the time duration.The deformation of primary structures comparison between test and simulation are shown in Fig.3.Results show that the global vehicle deformation and A-pillar deformation corresponded well between simulation and test which errors were less than 10%.The errors of steering wheel rearward displacement and pedal rearward displacement were also controlled within 15%.The upward displacements of steering wheel and pedal are relatively small in both test data and the simulated result,thus leading to larger errors when calculated based on smaller values obtained experimentally.Discrepancies may be due to the connection types used in connecting pedal and steering column in the model.By taking the simulated deformation of primary components and vehicle acceleration collectively into account,it can be considered that the simulation results correlated reasonably with the test.

Fig.2 Linear acceleration of vehicle
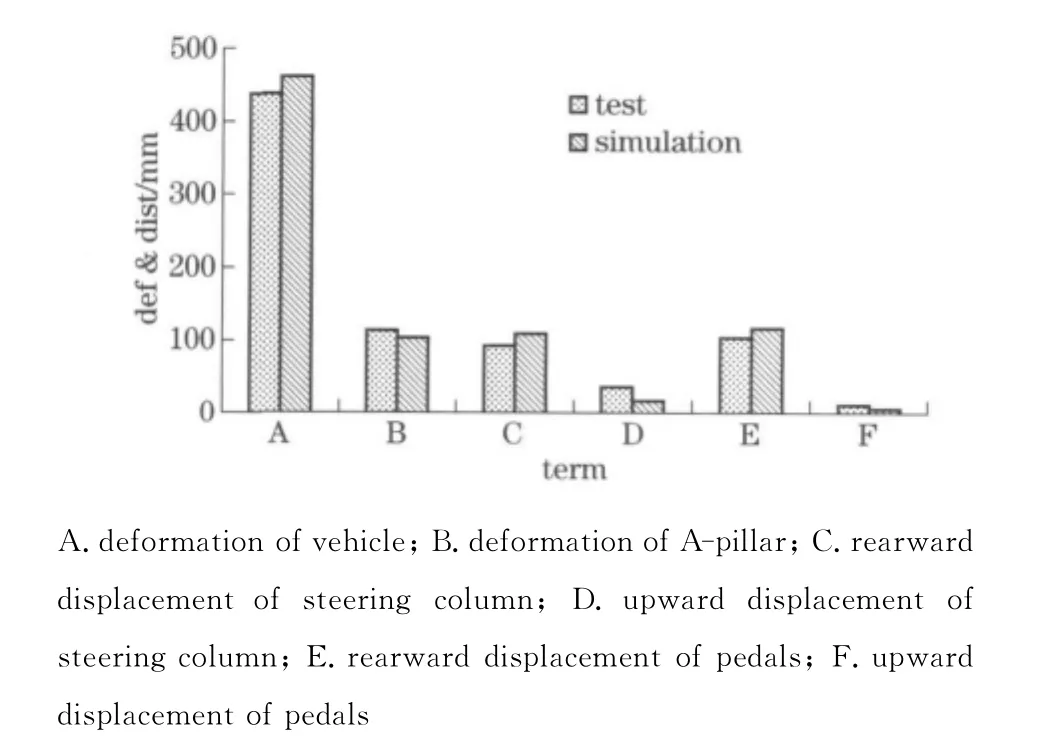
Fig.3 Deformations of primary structures
1.3 Development of ORS model and validation against test data
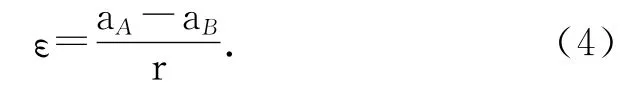
The ORS model developed using MADYMO included vehicle floor,pedal,the panel board,seat,seatbelt,airbag,50%Hybrid Ⅲ dummy etc.which can be seen from level 2in Fig.1.Contacts between the dummy and components,such as seat,airbag,panel,airbag and windshield,airbag and steering wheel were defined.The linear acceleration(along vehicle longitudinal direction)and deformations of primary components,such as backward and upward displacement of steering column,backward displacement of pedal etc.extracted from the validated vehicle FE model were put into the ORS model.The B-pillar at the rocker which was not deformed during vehicle crash was treated as rigid,thus the parts surrounding B-pillar can be seen as the plane motion of rigid body.According to kinematic theory,the acceleration at any position of the rigid body can be written as a=ao+ε×r- ω2r. (1)
The acceleration can be decomposed into tangential acceleration along longitudinal direction and vertical acceleration about vertical direction of vehicle as
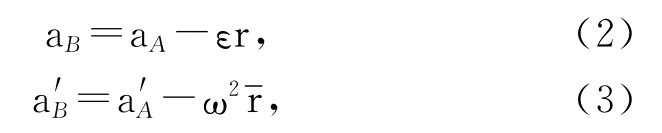
whereaAandaBare the linear accelerations of left B-pillar(driver side)and right B-pillar(passenger side)respectively;εistheangularaccelerationaboutleftB-pillar; ωistheangularvelocity,andristhevehicleinnerwidth.TheangularaccelerationεcanbederivedfromEq.(2)as
The time duration and time step of the ORS model were set as 140ms and 10-6s respectively.Simulation results were validated against the test both in kinematic and dynamic response of the dummy.Fig.4shows the dummy kinematic trajectories between test and simulation at different time points.It can be seen that all the kinematic trajectories of the dummy in the simulation were quite identical to the test except for 40ms at which the dummy kinematics in the simulation displayed a little lag.
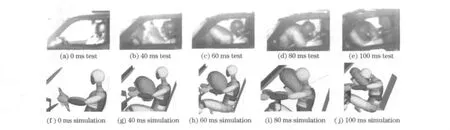
Fig.4 Comparison of dummy trajectories between test and simulation
The primary dummy injury metrics,such as head acceleration,neck axial force and chest deformation according to C-NCAP[4]were validated against the test,which is shown in Fig.5.The dummy injury metrics are corrected reasonably both in peak values and durations.In global,all the errors of the peak values were less than 20%.
2 Equivalence of crash pulse and its validation in offset crash
Fig.6shows a typical crash pulse shape in offset vehicle crash.It can be seen that the original acceleration curve has two peak values and both of them have certain durations.This type crash pulse was simplified as a dual-trapezoid shape curve.The simplified crash pulse had better meet two conditions:①it can be characterized with the smallest number of factors which can represent vehicle dynamic response;②it can adequately evaluate occupant response as the original crash pulse[5-6].In this study,the dummy energy density was also compared between equivalent pulse and original pulse besides the dummy injury metrics.

Fig.5 Results of major dummy injury metrics
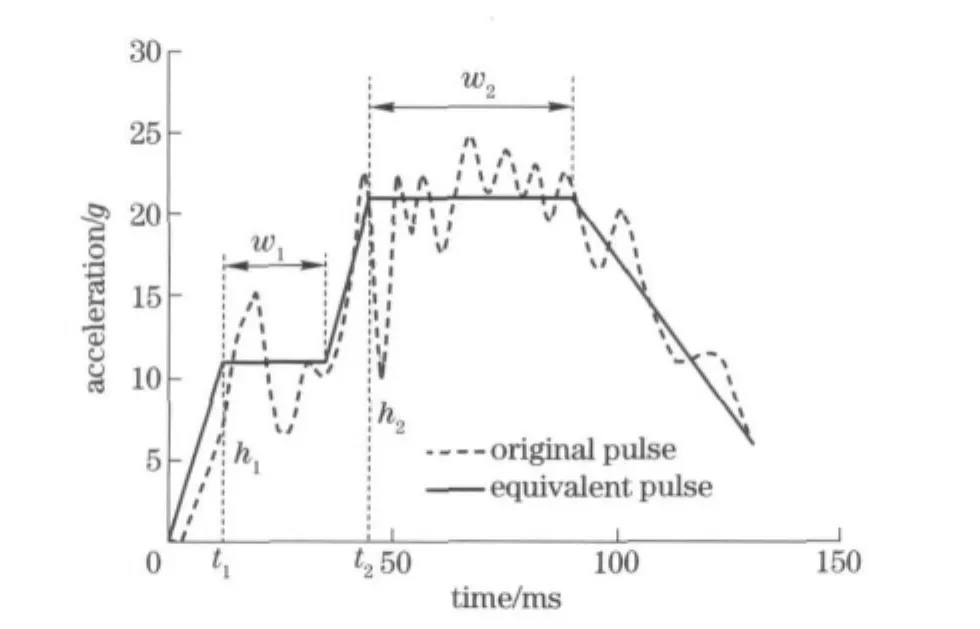
Fig.6 Original and equivalent accelerations
2.1 Comparisons of dummy injury metrics among test,simulation with original pulse,and simulation with equivalent pulse
In order to validate the equivalent crash pulse,comparisons of primary important dummy injury metrics among test,simulation with original pulse,and simulation with equivalent pulse were performed as shown in Fig.5.The primary dummy injury metrics in this study included the head resultant acceleration,neck tensile axial force and chest deformation based on the C-NCAP[4].Re-sults show that the simulation with original pulse and simulation with equivalent pulse corresponded reasonably both in peak values and the time durations.
2.2 Comparison of occupant energy density between simulations with original pulse and equivalent pulse
A simplified vehicle-occupant model is used to obtain the occupant energy.The schematic of this model is shown in Fig.7[7-8],in whichMoandMvare the occupant and vehicle masses respectively,δisthegapbetweenseatbeltanddummy,andKandFaretherestraintstiffnessandcrashforce respectively.

Fig.7 Schematic of vehicle-occupant model
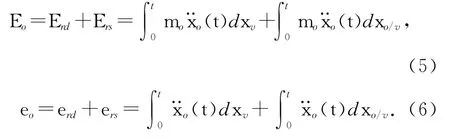
Theoccupantenergy/energydensitycanbe dividedintotwoparts:restraintsystemenergy(Ers)/energydensity(ers)andride-downenergy(Erd)/energydensity(erd)whichwereexpressed as
The ride-down efficiency can be seen as
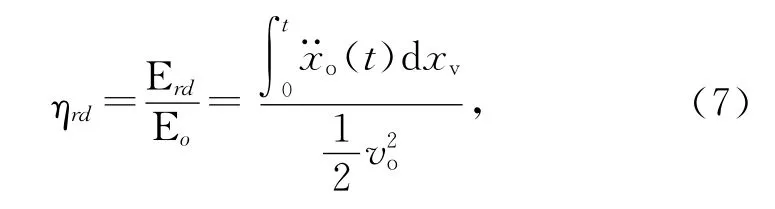
wherexois occupant displacement during crash;xvis vehicle displacement;xo/v=xo-xv,occupant relative displacement.
The displacements of the vehicle and occupant can be determined through second integration of dummy acceleration.In this study,the chest acceleration was used to represent the whole dummy acceleration.The displacements of the vehicle and dummy,the ride-down energy density and the restraint energy density of the dummy generated by original pulse and equivalent pulse are shown in Fig.8and Fig.9respectively.The equivalent pulse caused a little lower vehicle displacement and a little higher dummy displacement compared to the original pulse,thus the relative displacement of the dummy caused by equivalent pulse would be greater than the one caused by the original pulse and the corresponding maximum dummy ride-down energy density and restraint energy density became a little lower andhigher respectively.In general,the equivalent crash pulse can reasonably replace the original pulse through the global comparison of dummy energy density in the displacement domain.

Fig.8 Displacements of vehicle and dummy

Fig.9 Dummy ride-down and restraint energy density
3 Parametric studies on vehicle crash equivalent pulse
Linear acceleration-time history curve is the most important factor affecting dummy injury criteria and mainly determined by the whole vehicle structures.In order to investigate the influence of linear acceleration on occupant injuries,parametric studies were conducted on vehicle equivalent pulse.In general,the linear accelerations varies from vehicle to vehicle,thus four types of vehicle acceleration-time curves obtained from our test database and literatures were used to determine the ranges of equivalent pulse parameters[9,10].The four types of crash pulse were marked as type-A,type-B,type-C,and type-D as shown in Fig.10.All of these pulses were collected under the test condition of C-NCAP[4]except for type-D which was obtained under the test condition of Euro-NCAP[11].

Fig.10 Four types of vehicle crash pulse
The deformations of primary components,especially the deformation of instrument panel varies with the type of vehicle,therefore they would especially affect the injury metrics of femur,knee and tibia due to direct contact during crash.However,collecting the specific deformations of primary components of all the vehicles are time-consuming and unpractical,thus only the injuries of dummy regions above knee were analyzed to try to eliminate these influences brought by different de-formations of primary components.
Six parameters were used to describe the equivalent crash pulse,as shown in Fig.6:t1is the time-point corresponding to first peak value of pulse;h1is the first peak value;w1is the duration of the first peak value;t2is the time-point corresponding to second peak value of pulse;h2is the second peak value;w2is the duration of second peak value.The ranges of these six parameters were determined based on Fig.10and they also needed to meet the constraint conditions of timepoint:t1+w1<t2andt2+w2<140 (the 140ms can be treated as the end of the crash).The ranges of parameters and levels corresponding to the factors are shown in Tab.1.These levels and factors were arrayed based on a Taguchi Orthogonal standard table L27(313),in which the first 6factors of 13in this standard table were used and combined to 27combinations,therefore the twenty seven equivalent pulses were put into the model respectively to conduct simulations.The results of peak values of head resultant acceleration(Head_Acc),HIC,neck axial force (Neck_Frc),and chest deformation(Chest_Def)were output to conduct sensitivity analysis.
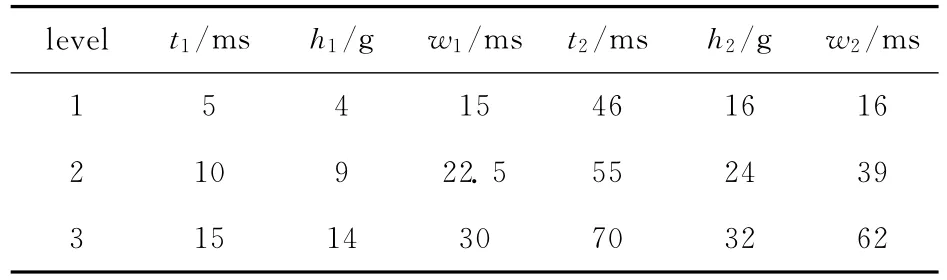
Tab.1 Levels of factors
Results show that factorh2was statistically significant on all the injury metrics aforementioned in this study(P=0.001,P=0.000,P=0.000,andP=0.000respectively).Factorh1was significant on peaks of head resultant acceleration,HIC,neck axial force(P=0.011,0.038,and 0.033respectively).The interactive factors oft1andt2were also significant on peak of head resultant acceleration(P=0.03).The effect sizes of all the factors on each injury criterion was normalized which means the maximum effect size on each injury criterion regarded as 1as shown in Fig.11.All the effects generated by factorh1were negative which means the largerh1,the lower injury metrics.Therefore,a higherh1and lowerh2would bring deeply lower injury metrics and decreasing second peak value of the pulse was the most effective way to reduce the human injury criteria.Besides factorsh1andh2,factorst1,t2,w1,andw2also had some effects on HIC,head resultant acceleration,HIC and neck axial force respectively.According to the analysis above,the initial energy of a vehicle was constant.In order to lower the second peak value of the crash pulse,the first peak value should be increased.Another point needed to be pointed out is that the first peak value of crash pulse didn’t have any effect on the maximum chest deformation,because the chest deformation was mainly caused by the constraint force of the seatbelt.The force increased with increasing the dummy relative displacement with seatbelt.When the first peak value of the crash pulse occurred,the dummy just began to move with a smaller displacement,thus the seatbelt force would be very low and the maximum chest deformation would not be influenced.
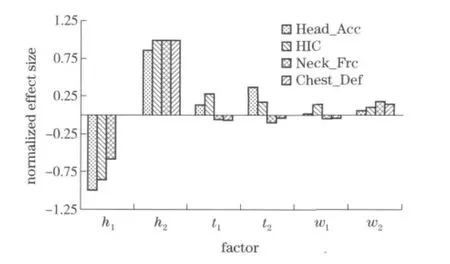
Fig.11 Normalized effect sizes of all the factors
4 Conclusion
A vehicle FE model and ORS model were developed and validated against test data.Parametric studies were performed to analyze the sensitivities of parameters of the equivalent dual-trapezoid shape pulse on head resultant acceleration,HIC,neck axial force and chest deformation.Three primary conclusions were obtained:①the equivalent dual-trapezoid crash pulse is accurate enough to replace the original pulse;②the first and second peak values of the pulse were statistically significant on most injury criteria above and the interaction of the time-points of first peak value and second peak value also had a significant influence on head resultant acceleration(P=0.03);③a higher first peak value and a lower second peak value of the crash pulse would bring lower injury metrics.In this study,the ranges of the factors used to conduct parametric studies were limited by four types of vehicle tests,more crash pulses in frontal offset crash are needed to further obtain more accurate and wider ranges.
[1]Bo P S,Sung J H,Won C K,et al.Performance analysis methodology based on crash pulse severity and vehicle occupant packaging for full frontal crash event[C]∥Proceedings of the 21st International Technical Conference on the Enhanced Safety of Vehicles.Stuttgart,Germany:[s.n.],2009:Seo1-Seo6.
[2]Qiang Y,Naoya K,Hideoki Y,et al.Optimum design of vehicle frontal structure and occupant restraint system for crashworthiness[J].JSME International Journal Series A,2001,44(4):594-601.
[3]Grimes W D,Lee F D.The effect of crash pulse shape on occupant simulations[C]∥SAE 2000World Congress,Session:Accident Reconstruction:Simulation& Animation.Detroit,MI,USA:[s.n.],2000:1-10.
[4]China Automotive Technology and Research Center(CATARC).China-New Car Assessment Program(C-NCAP)[R],2009.(in Chinese)
[5]Liu Zhixin,Shi Yongwan,Chen Hong.Modeling and analysis of crash pulse of vehicle body based on tipped equivalent square wave method[J].Advanced Materials Research,2011,211-212:1007-1011.
[6]Huang M.Vehicle crash mechanics[M].Boca Raton,Fla:CRC Press,2002.
[7]Bois P D,Chou C C,Fileta B B,et al.Vehicle crashworthiness and occupant protection[R].Michigan:Automotive Applications Committee,American Iron and Steel Institute Southfield,2004:214-219.
[8]Huang M,Laya J,Loo M.A study on ride-down efficiency and occupant responses in high speed crash tests[C]∥International Congress & Exposition.Detroit,MI,USA:[s.n.],1995:29-36.
[9]Qi Licheng,Wu Xiuchun,Wang Chao,et al.Simulating crashworthiness of car in offset impact[J].Journal of Liaoning Institute of Technology,2006,26(4):252-254.(in Chinese)
[10]Chul K H,Dong S K.Enhancement of offset crash performance in a short carrier front suspension vehicle[C]∥International Body Engineering Conference and Exhibition.Detroit,Michigan,USA:[s.n.],2001.
[11]Hobbs C A,McDonough P J.Development of the european new car assessment programme(Euro NCAP)[C]∥Proceedings of the 16th International Technical Conference on the Enhanced Safety of Vehicles(ESV).Windsor,England:[s.n.],1998:2439-2453.
(Edited byCai Jianying)
猜你喜欢
Plasma Science and Technology(2022年11期)2022-11-17
课程教育研究(2021年24期)2021-04-14
课程教育研究(2021年44期)2021-04-13
收藏与投资(2020年12期)2020-04-18
现代妇女(2019年11期)2019-11-25
小说月刊(2016年5期)2016-05-06
陶瓷科学与艺术(2016年1期)2016-02-28
杂文选刊(2014年12期)2014-11-17
恋爱婚姻家庭(2009年8期)2009-09-10
 Journal of Beijing Institute of Technology2012年2期
- Journal of Beijing Institute of Technology的其它文章
- Artificial neural network modeling of mechanical properties of armor steel under complex loading conditions
- Optimization of the carrier tracking loop for GPS high dynamic receivers
- Vibration test of micro machined gyroscope based on high speed photography and SURF
- Experimental validation method of elastic thin rod model for simulating the motional cable harness
- Calculation methods of lubricant film pressure distribution of radial grooved thrust bearings
- Distribution of driving trajectory of passenger car in highway horizontal curves