
An ECT System Based on Improved RBF Network and Adaptive Wavelet Image Enhancement for Solid/Gas Two-phase Flow*
2012-10-31 03:35CHENXia陈夏HUHongli胡红利ZHANGJuan张娟andZHOUQulan周屈兰
CHEN Xia (陈夏), HU Hongli (胡红利)**, ZHANG Juan (张娟) and ZHOU Qulan (周屈兰)
State Key Laboratory of Electrical Insulation and Power Equipment, Xi’an Jiaotong University, Xi’an 710049, China
An ECT System Based on Improved RBF Network and Adaptive Wavelet Image Enhancement for Solid/Gas Two-phase Flow*
CHEN Xia (陈夏), HU Hongli (胡红利)**, ZHANG Juan (张娟) and ZHOU Qulan (周屈兰)
State Key Laboratory of Electrical Insulation and Power Equipment, Xi’an Jiaotong University, Xi’an 710049, China
Electrical capacitance tomography (ECT) is a non-invasive imaging technique that aims at visualizing the cross-sectional permittivity distribution and phase distribution of solid/gas two-phase flow based on the measured capacitance. To solve the nonlinear and ill-posed inverse problem: image reconstruction of ECT system, this paper proposed a new image reconstruction method based on improved radial basis function (RBF) neural network combined with adaptive wavelet image enhancement. Firstly, an improved RBF network was applied to establish the mapping model between the reconstruction image pixels and the capacitance values measured. Then, for better image quality, adaptive wavelet image enhancement technique was emphatically analyzed and studied, which belongs to a space-frequency analysis method and is suitable for image feature-enhanced. Through multi-level wavelet decomposition, edge points of the image produced from RBF network can be determined based on the neighborhood property of each sub-band; noise distribution in the space-frequency domain can be estimated based on statistical characteristics; after that a self-adaptive edge enhancement gain can be constructed. Finally, the image is reconstructed with adjusting wavelet coefficients. In this paper, a 12-electrode ECT system and a pneumatic conveying platform were built up to verify this image reconstruction algorithm. Experimental results demonstrated that adaptive wavelet image enhancement technique effectively implemented edge detection and image enhancement,and the improved RBF network and adaptive wavelet image enhancement hybrid algorithm greatly improved the quality of reconstructed image of solid/gas two-phase flow [pulverized coal (PC)/air].
electrical capacitance tomography, image reconstruction, radial basis function network, wavelet image enhancement
1 INTRODUCTION
Multi-phase flow widely exists in petroleum,chemical, metallurgical and other industrial production fields. In order to reduce atmospheric pollution and pipe erosion, improve product quality and process efficiency, the flow parameters measurement of two-phase flow by pneumatic conveying means becomes increasingly widespread. Especially, flow regime, velocity and mass flow rate, in transition section behind a throttle or a reducer or a bent pipe need to be measured and investigated. Because wear (even powder leakage)and powder accumulation (even blockage) usually occurs here. These complex processes can be visualized through tomography imaging technology.
ECT (Electrical capacitance tomography) is a newly-developed computer-aided tomography imaging technology, which reconstructs the distribution image of multiphase flow and furthermore allows for non-invasive visualizing the internal structure of closed pipelines by measuring the capacitances between surface electrodes located around the object. It has great development potential and broad prospects in industrial fields with its many advantages of non-invasive measurement, safe, simple structure, low cost and wide application [1-4].
However, due to the random and complex nature of solid/gas two-phase flow, the small number of independent capacitance measurements and the “soft”characteristic of sensitive field, it is rather difficult to realize high-quality image reconstruction. There are several image reconstruction algorithms for ECT inverse problem [5-8]. For example, linear back projection(LBP) algorithm (generally used for qualitative analysis has faster speed but poor accuracy), iterative algorithm [9], multiple linear regression and regularization(MLRR) algorithm [10] and so on all have their own advantages and disadvantages. Compared with these traditional linear algorithms, neural networks have the abilities of self-organizing, self-adaptive, self-learning and massively parallel distributed storage and processing, which is particularly suitable for solving such non-linear and ill-posed problems of ECT image reconstruction.
Image reconstruction algorithm based on improved RBF neural network is proposed to fulfill the requirement of flow regime identification. And for better image quality, an adaptive wavelet image enhancement technique is emphatically introduced, which belongs to a space-frequency analysis method suitable for image feature-enhanced. Experiments and image reconstruction confirmed the advantages of the proposed image reconstruction algorithm and the possibility of the flow parameters measurement of dilute solidgas two-phase flow in transition section using ECT.
2 ECT SYSTEM
ECT attempts to image the permittivity distributioninside a pipe by measuring the electrical capacitances between electrodes placed around its periphery. Its physical basis is that, when the component concentration and the distribution of each phase in the pipe changed, the equivalent dielectric constant would correspondingly change, and so do the measured capacitances between electrodes. Thus, media distribution in the tubes could be calculated from measurement of the capacitance between electrodes. A complete ECT system consists of three parts as shown in Fig. 1: Capacitance measurement electrode array, data acquisition and processing unit, image reconstruction unit.
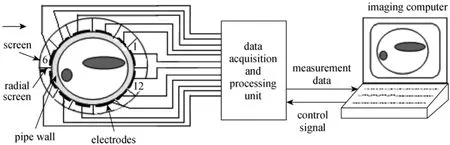
Figure 1 Schematic of a ECT system
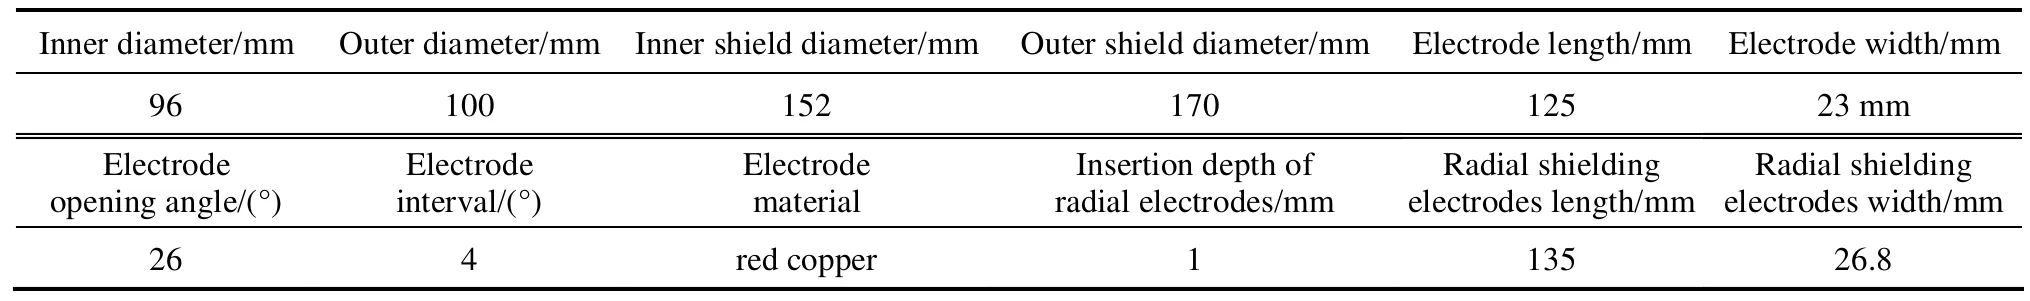
Table 1 Main parameters of ECT sensor
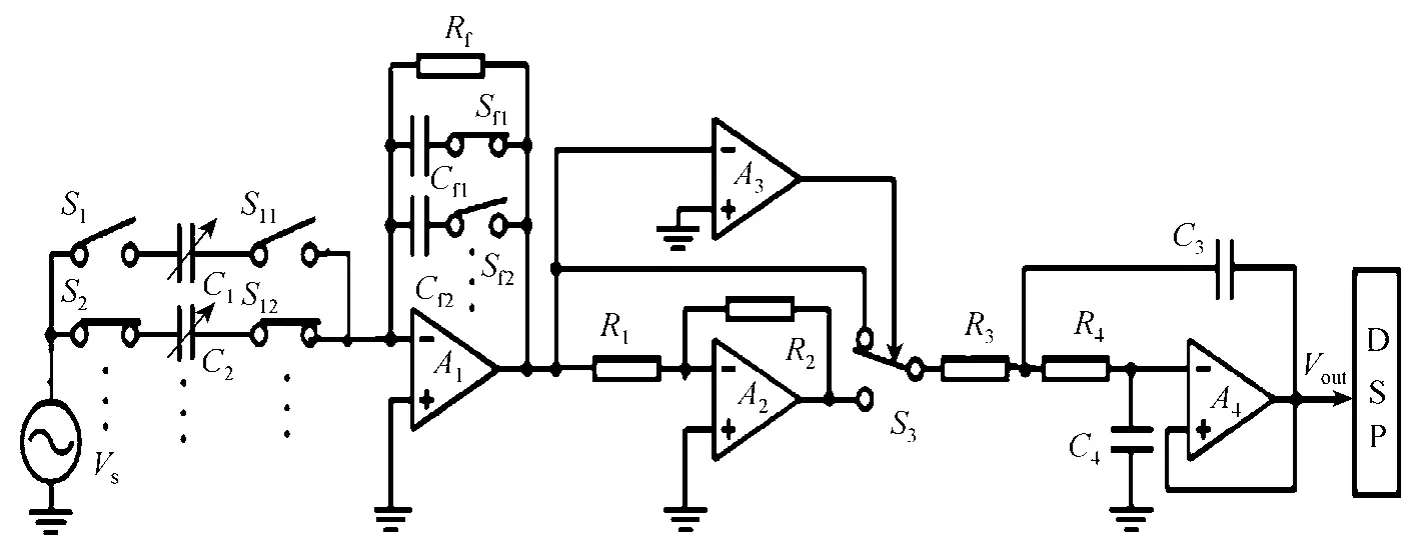
Figure 2 The circuit diagram of data acquisition and processing unit
2.1 Capacitance measurement electrode array
In this work, epoxy glass tube as the insulated pipeline was 400 mm long; 12 measurement electrodes were mounted symmetrically on the outside of the epoxy pipe. In order to reduce high constant capacitance between adjacent electrodes for expanding dynamic range of the system, radial shielding electrodes were used. Additionally, insulating materials were filled between the radial electrodes, around which another thin copper plate was welded to form the inner screen. A supporting copper tube outside of the inner screen acts as the outer screen. A follower was connected between the inner and outer screens,which formed an equal potential space between the screens. This specific design is used to prevent leakage of weak signal and to eliminate the effect of electromagnetic interference and stray capacitance.
Parameters of ECT sensor were listed in Table 1.
2.2 Data acquisition and processing unit
Data acquisition and processing unit included multi-channel data acquisition, capacitance/voltage(C/V) conversion, A (analog)/D (digital) conversion and communication interface. This unit adopted a control structure based on data acquisition card. In this unit, the design of C/V conversion circuit was a most critical problem as imaging effect and real-time performance largely depended on the accuracy and the speed of data acquisition system.
The basic circuit of the data acquisition and processing unit was shown in Fig. 2 [11]. It consisted of a current detector with a capacitor-array, a precision rectifier circuit and a second-order low-pass filter,which acted as AM (amplitude moderation) modulator and demodulator, respectively. An excitation voltage with 1 MHz carrier frequency and 1 V amplitude was used. A DSP (digital signal processor) with 2-channel 18-bit ADC (analog to digital converter) was used for data processing and logic control. The feedback capacitance is selected to approximate measurement capacitance in order that the gain of A1is about one in a wide range of measured capacitance.
2.3 Image reconstruction
Image reconstruction is generally aided by a computer, mainly responsible for transmitting data to the external interface circuit and receiving data from the acquisition system. Then use the appropriate algorithm for image reconstruction and display the image.As image reconstruction of ECT system is a non-linear and ill-posed inverse problem, a new image reconstruction algorithm based on improved RBF neural network and adaptive wavelet image enhancement for solid/gas two-phase flow was presented.
3 THEORY OF IMPROVED RBF NEURAL NETWORK
3.1 RBF neural network
RBF (radial basis function) network is a local approximation three-layer feed forward neural network. It is much better than the traditional BP network in approximation ability, classification ability and learning speed [12]. The structure of RBF neural network is shown in Fig. 3 [13, 14].
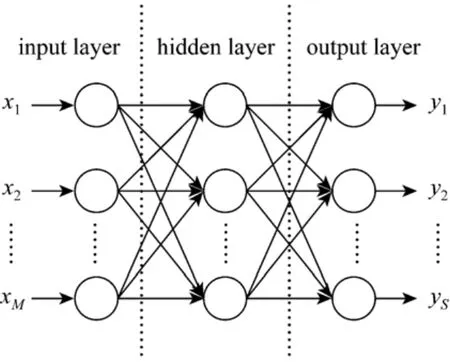
Figure 3 Structure of RBF neural network
The input vector and the corresponding desired output vector of the ith normalized sample are respectively set:

where N is the sample size, M and S are respectively the dimensions of input vector and output vector.
Select Gaussian kernel—function of the Euclidean distance between input vectors and training data points—as the radial basis function in this work. For the nth sample, input of the jth hidden layer neuron is

jiis the ith central vector of the jth hidden layer basis function,jσ is the width of the jth basis function.
Output of the jth hidden layer neuron is

Output of the output layer is

wherekjω is the connection weight value between the jth hidden layer neuron and the kth output layer neuron.
3.2 Improved RBF neural network
During the training of RBF network, identifying the number of hidden layer neurons is a key issue. The traditional approach is to make it equal to the input vector elements. Clearly, in most cases, the input vectors are too many and the over-calculated hidden neurons will inevitably lead to the increase in computational load. Therefore, the dynamic-means clustering algorithm is introduced in this paper.
The mathematical steps are as follows:
(1) Set the output precision E, that is, the rms(root-mean-square) error between actual output and target output of the RBF neural network; Arbitrarily set the number of hidden layer neurons;
(2) Randomly select M samples from the input sample sets and take them as the central data of Gaussian function for the hidden layer; Choose the width of Gaussian function at random;
(3) Construct RBF network on the basis of the selected central data and width; Calculate weight values between hidden layer and output layer; Calculate the actual output Y and thus the rms error between actual output Y and target output y.
(4) If ()EME>, go to Step (5); otherwise set M = M +1 and repeat Steps (2) to (4);
(5) Compare E(M ) with E(M − 1 ); If they can both met accuracy requirements, then let M = M −1 and go to Step (2); If E(M −1)>E, then let M be the number of hidden layer neurons.
4 ADAPTIVE WAVELET IMAGE ENHANCEMENT TECHNIQUE
Image reconstruction algorithm based on neural network commonly has the features of vague characteristic and poor accuracy, so a space-frequency analysis method that has multi-resolution characteristic and the capacity of characterizing local features of signals both in time domain and frequency domain was applied to this work to enhance image feature [15, 16].Such methods commonly adopted the following steps:First, multi-level wavelet decomposition for original image, determine edge points of each sub-band image by their field characteristics; Then, estimate the noise distribution of space-frequency domain on the basis of statistical properties and successively construct edge enhancement gains; Finally, reconstruct the image with the adjusted wavelet coefficients [17].
4.1 Theory of wavelet decomposition
Two-dimensional discrete wavelet decomposition was frequently applied in the field of image processing.Suppose both the two-dimensional scaling function and the wavelet function are equations with variables separable: φ(x,y) = φ(x) · φ (y), ψ(x,y) =ψ(x) ·ψ(y).By use of tensor product, the concept of one-dimensional resolution can be easily extended to two-dimensional circumstances [18].
Steps of two-dimensional discrete wavelet are as follows: First, decompose the original image along its line direction with low-pass decomposition filter(LP_D) and high-pass decomposition filter (HP_D).Then decompose the results of line direction decomposition along the column direction. Decomposition process was shown in Fig. 4. After that, repeat the previous decomposition process twice with input signal LL1. Finally, the sub_band image of three-level wavelet decomposition can be obtained.
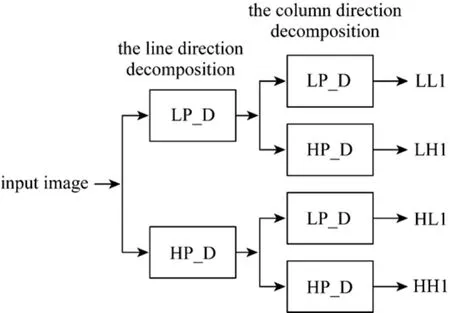
Figure 4 Two-dimensional discrete wavelet decomposition
Wavelet decomposition has the ability of energy compression. That is, most energy is concentrated on a few wavelet coefficients which have larger amplitudes and generally represent important image characteristics, such as edge points; While amplitudes of majority coefficients are small, generally corresponding to the noise points of image. By setting a certain approach to adjust the wavelet coefficients according to some rules, the purpose of improving imaging quality could be achieved [19].
4.2 Theory of adaptive wavelet image enhancement technique
Adaptive wavelet image enhancement technique has two key issues: discrimination of sub-band image edge points and determination of adjustment function of wavelet coefficients.
(1) The discriminate of sub-band image edge points
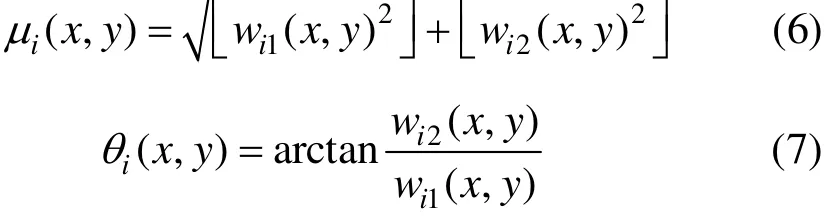
The multi-scale gradients of the sub-band image with three-level wavelet decomposition are calculated according to the following formulas [20]:Here wi1(x,y) and wi2(x,y) denote the horizontal and the vertical sub-band image of the ith layer, respectively. μi( x ,y) and θi(x ,y) are the gradient magnitude and the gradient direction, respectively. The gradient direction is usually quantified to eight directions: 0°, ±45°, ±90°, ±135°, 180°.
wij(x,y) would be considered as an edge point if the following conditions are met: (1) The gradient magnitude μi( x ,y) of point wij(x,y) is greater than the other two points in the gradient direction θi( x ,y).(2) μi( x ,y) is greater than a certain threshold value,for example σij/2, where σijis the standard deviation of sub-band imageijw.
(2) Adjustment functions of wavelet coefficients.
Although edge points and noise points have different properties in the space-frequency domain, their disparity is relative and it is difficult for any method to absolutely distinguish them. This work adopted the following adjustment function of wavelet coefficients to enhance the edge points with certain self-adaptability in space-frequency domain.
The sub-band image wij(x,y) was adjusted according to the following formula:

where wˆij(x,y) is the sub-band image after adjustment, and gij(x,y) is the enhancement gains with self-adaptability in space-frequency domain. If wij(x,y) is judged to be the non-edge point, gij(x,y)does not to enhance and equals to 1.
gij(x,y) should be adaptive so that it can be applied to images whose noise is unevenly distributed in frequency space. In this work, gij(x,y) was defined by the following formula:
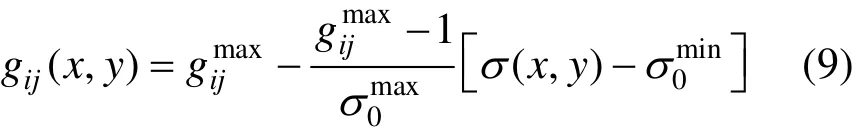
where (,)xyσ denotes the local standard deviation of a neighborhood of point (,)xy in the original image S.denote respectively the maximum and the minimum local standard deviation in the original image S.is defined as
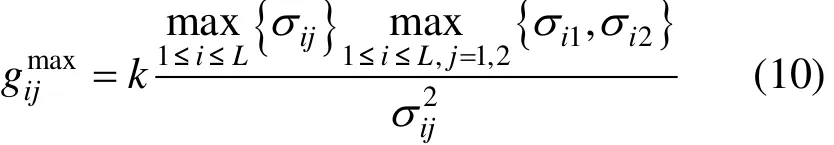
whereijσ is the standard deviation of sub-band image wij. k, a constant factor, is selected based on image content to avoid over-enhancement and less-enhancement of edge points. In this paper, let 1k=. L is the level of wavelet decomposition.
It can be seen from Eq. (9), the maximum value of gij(x,y) is. When the noise level of sub-band imageijw is low,is larger; otherwise,is relatively smaller. Namely,has certain adaptability in noise distribution at different analysis levels and directions [21].
5 IMAGE RECONSTRUCTION
For an ECT system, image reconstruction is to reflect phase distribution of the internal dielectric constants in solid/gas two-phase flow. Algorithm was approximately divided into two steps:
(1) Establish mapping model between capacitance values and image pixels of corresponding flow regime based on improved RBF neural network.
(2) Adaptive wavelet filtering for the reconstructed images which was obtained through RBF neural network established above.
5.1 Training of RBF neural network
(1) Input training sample set
Core, annular and bottom flow regimes of different sizes in horizontal gas-solid flow pipe were generated by the assembling throttling devices (described in Section 6.2) under different operation conditions (different kinds of coals with different particle diameters used as the conveyed medium and the carrier air rate from 15 to 25 m·s−1), and the data summed to 110 groups for the network training. For each flow condition, 66 capacitance values of a data point would be obtained between 12 ECT electrodes as the input training sample to the RBF neural network. In order to improve the generality of this algorithm, capacitance values were normalized.
(2) Target output sample set
Extract pixels from images of different flow regimes of different sizes under MATLAB platform and take them as the target output sample set of RBF network. Comprehensively considering imaging speed,computer memory and actual measurement requirements, we chose 100×100 pixels as the image output.
(3) Construct RBF neural network
The neuron numbers of input layer and output layer of RBF network respectively depended on input dimension and output dimension: 66 and 100×100.Gaussian function was adopted as the basic function of hidden-layer. The number of the hidden layer neurons was determined by the method described in Section 3.2, and here it was 23 after training starting from certain initial weights set randomly. Training process of RBF network under MATLAB platform was shown in Fig. 5.

Figure 5 Program flowchart of RBF neural network training
5.2 Image reconstruction with adaptive wavelet filtering
Once the RBF network is trained successfully,the mapping model between the capacitance values and the reconstructed image pixels is established. For a tested sample (a group of 66 capacitance values), the corresponding reconstructed image can be gained immediately using the trained RBF network.
According to the principles of orthogonality, linear phase, continuation and compactly support set,Harr function [22] was chosen as the wavelet function in this paper. Through adaptive wavelet image enhancement, the edge points that contain detail features of the image can be enhanced to obtain better reconstruction effects. The process of adaptive wavelet image enhancement was shown in Fig. 6.

Figure 6 Program flowchart of image reconstruction with adaptive wavelet image enhancement
The determination of the wavelet decomposition level L should be considered. This paper chose L to be 3 because with the increase of the decomposition level,the enhancement effect would decrease to some extent.The size of neighborhood window has great influence on algorithm performance in calculating local standard deviation of the original image. A large size would lower its adaptability and increase computation, while a small one would result in a longer running time and make the algorithm severely affected by noise. This paper chose a neighborhood window of 33×33; Let the constant factor k in Eq. (10) be 1.
6 EXPERIMENTAL RESULTS
The experiments were divided into two parts:static and dynamic experiments. For the two totally different experimental conditions, the sizes of the reconstruction domain both are 96 mm×96 mm.
6.1 Static experiments
In the static experiments, three typical flow regimes of certain sizes are taken as test samples to verify the performance of proposed ECT image reconstruction method. The epoxy glass tube filled with pulverized coal was placed into the center of measurement pipe to simulate core flow for data collection.And the wall thickness of the epoxy glass tube is 1 mm and outer diameter is 50 mm. Similarly, adopt one plate (width 96 mm, length 200 mm) of the same material placed horizontal to simulate bottom flow and use three pipes (outer diameter: 25 mm) of the same material bound together to simulate roping flow. As for the target image for test, it was the cross section view of the measurement pipe after triangulation, in which the epoxy glass tube of different size, full of pulverized coal, is placed.
The measured capacitances are obtained by the 12-electrode ECT system in static experiments, and they were taken as the input of the image reconstruction model for test. Reconstruction results based on RBF neural network and adaptive wavelet image enhancement were shown in Table 2.
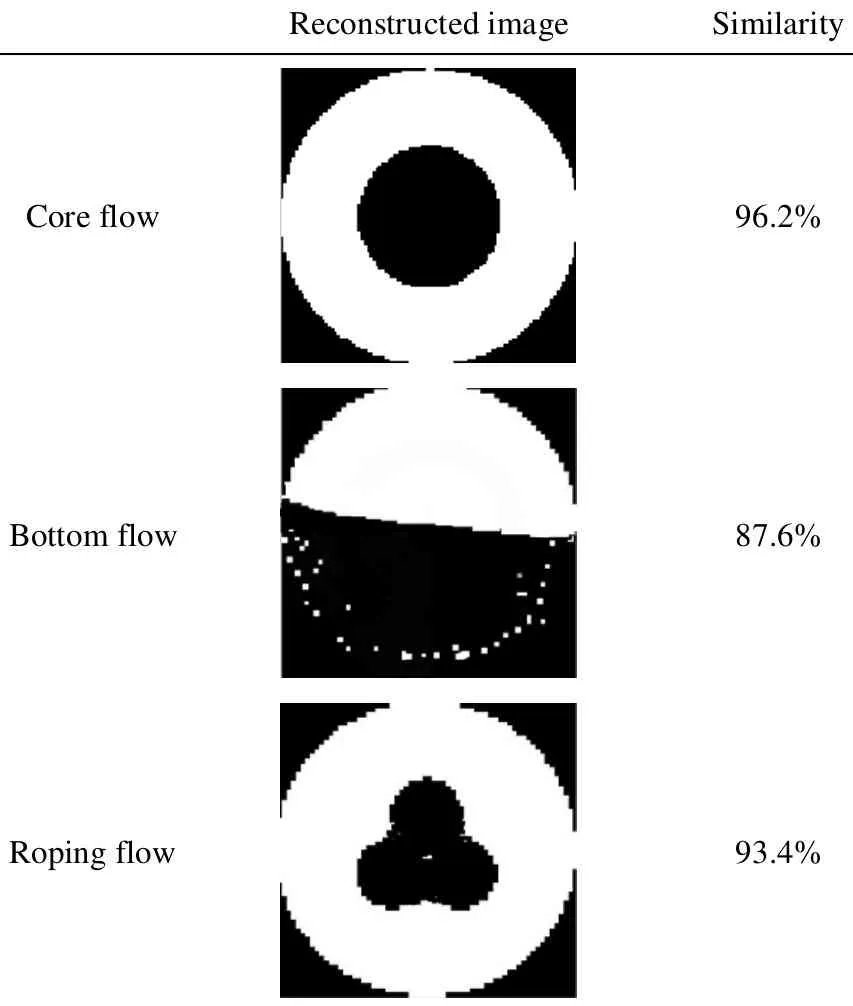
Table 2 Imaging results of static experiments
From the images, we can see that the ECT system worked well. The algorithm based on RBF and adaptive wavelet image enhancement technique could effectively reflect the phase distribution of the three static simulation flow regimes with edge points enhanced. In addition, the identification results have high fidelity, especially for the media concentrated flow regime (core flow). However, there are subtle difference between the real image and the reconstructed image. For example, the demarcation line between the pulverized coal and the air in the reconstructed image of the bottom flow is slanted, while in the real image it is horizontal. In order to describe the performance of this system quantitatively, similarity degree is introduced to reflect the spatial location error.The expression of similarity degree “S” is shown as
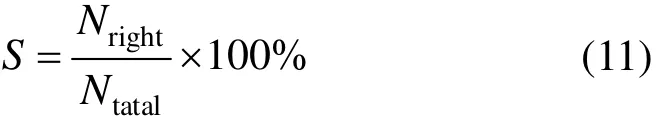
Here, Ntotalis the total pixel number; Nrightis the correct pixel number of reconstructed image. The similarity degrees of the static experiments are also shown in Table 2. The similarity degrees of the three test samples are 96.2%, 87.6% and 93.4%, respectively. The similarity degree can be improved by increasing the number of the training samples to promote the generalization ability of the algorithm.
6.2 Dynamic experiments
A pneumatic conveying platform for experiments was designed in Fig. 7. It comprised the following four major subsystems [23]: carrier air supply system,feeding system, horizontal test section, and assembling throttling device.
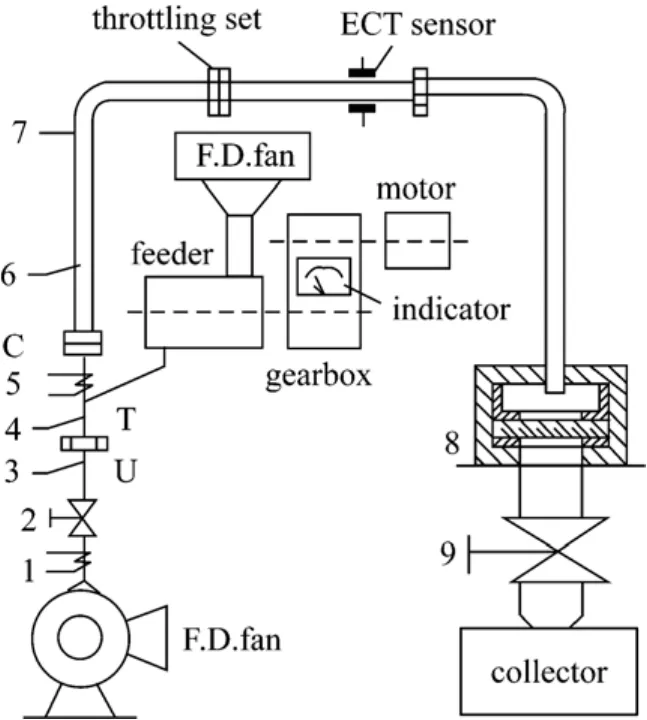
Figure 7 Schematic diagram of pneumatic conveying platform1,5—heater; 2,9—throttle valve; 3—pitot tube; 4,6—RTD; 7—flexible tube; 8—separator; C—coupling; T—t-mixer; U—union joint
Carrier air is supplied by a forced draft fan (FD fan). Air supply rate is controlled finely with a control valve 2 and coarsely with valve 9, respectively. Feeding system consists of a uniform speed motor, a continuously adjustable gearbox, a fine linear screw feeder and an adjustable pressure source (FD fan) to produce solid/gas flow continuously and smoothly. Feeding ranges from 30 g·min−1to 3 kg·min−1of particles of pulverized coal. The amount of discharging is adjusted and calibrated by the feeder and a mesh dust collector,respectively. Test section is the capacitance sensor of the ECT system which is described in Section 2.
The particle size distributions of pulverized coals were determined with a Malvern particle analyzer.Nos.4 and 5 pulverized coals were performed using Ray-mond mill. Nos. 1, 2 and No. 3 coals were performed using centrifugal pneumatic mill that works on the principle of particle-to-particle attrition. The coal particle-size distributions and coal median diameters(dm) are shown in Fig. 8. No. 5 coal is conventional coal (the particle-size distribution of No. 5 coal is similar to that of the coal used in most utility boilers)was used as conveying mediums for test in the experiment. Nos. 1 through 4 coals can be considered as micronized coal in accord with the standard of micronized coal in USA. And they were used as conveying mediums for training in the experiment.
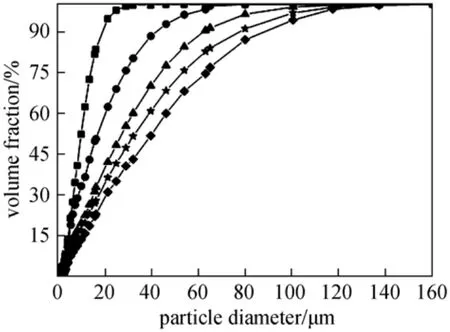
Figure 8 Cumulative particle-size distributions of coal■ No.1, dm 11.47; ● No.2, dm=21.73; ▲ No.3, dm 33.69;★ No.4, dm 43.12; ◆ No.5, dm=53.69
Due to the objective of this experiment, an assembling throttle is fixed in the pipeline as the flow regime generator in order to measure or control flow parameters. It is significant to do researches on these sectional dynamic processes for development and application of throttling devices. A transition flow regime is generated and kept in a short time at the downstream of the throttle in a short distance. For example,a bottom flow can be generated behind a gate valve, a core flow can be generated behind a venturi tube or an orifice plate, and an annular flow can be generated behind an impact plate. The upstream edge of the assembling throttle is especially designed to be streamlined to avoid powder accumulation, and the equivalent pore diameter of the throttle is about one tenth ofits length. In this work, three different throttles are used to generate core flow, annular flow, and bottom flow. It is necessary to mention that, before every regime measuring experiment starts, the experimental system is operated by a solenoid valve from no-flow to short-time flow conditions several times with pulverized coal as the conveyed medium and the flow regime can be observed by scenes imaged on the screen cloth fixed at the downstream of the throttle.Once a satisfactory flow regime is observed under several conditions, the screen cloth is removed and the ECT sensor is installed at the immediate downstream of the throttle in order to detect the transition flow regime under corresponding conditions. Steady flow can be also achieved by a forced draft fan or air compressor under the condition of solid/gas mass ratio around 5︰1 and the carrier air velocity larger than 15 m·s−1, which can be detected by the ECT system designed here. Cross section diagrams of flow regime generators for test were shown in Table 3.

Table 3 Cross section of flow regime generators and imaging results under solid/gas mass ratio 5︰1 and air velocity larger than 15 m·s−1

Table 4 Sizes of flow regime generators
In the dynamic experiments, three typical flow regimes of certain sizes generated by the flow regime generator are taken as test samples to verify the performance of proposed ECT image reconstruction method.The cross section of the flow regime generator for test is shown in Table 3, and their sizes are shown in Table 4.The measured capacitances of 12-electrode ECT system in dynamic experiments were obtained, and they were taken as the input of the image reconstruction model for test. The imaging results are shown in Table 3, and similarity degrees of reconstructed results are calculated, as shown in Table 3.
As the reconstructed images shown, identification and imaging of the three common flow regimes were basically realized. In particular, the demarcation line of the surrounding stray points in annular flow and core flow are more obvious. Part of coal particles perhaps move and scatter irregularly in high-speed flow when going through the test section, resulting in diffusion.
This testing method had certain shortcomings to be improved. In addition, the similarity of reconstruction image was affected by some factors in actual measuring system such as pulverized coal type, particle size and air supply rate. This can be overcomed by taking more measurement values as the training sample set in the future.
7 CONCLUSIONS
In this work, an image reconstruction algorithm for a 12-electrode ECT system based on improved RBF neural network and adaptive wavelet image enhancement was presented. This method established the mapping model between capacitance values and image pixels under MATLAB platform with the adaptive wavelet image enhancement technology to enhance image feature. An ECT system and a pneumatic conveying platform were built up for verifying the algorithm. Results of static experiment and dynamic experiment with a pneumatic conveying platform indicated that this image reconstruction algorithm could effectively enhance the image edges so that the detail features were manifested clearly, besides, the hybrid algorithm greatly improved the quality of reconstructed image and made solid/gas two-phase flow (pulverized coal/air flow) regime identification possible using ECT.
1 Yan, H., Liu, L.J., Xu, H., “Image reconstruction in electrical capacitance tomography using multiple linear regression and regularization”, Measur. Sci. Technol., 12, 575-581 (2001).
2 Yang, W.Q., “Key issues in designing capacitance tomography sensors”, IEEE Sensors, 25, 498-499 (2006).
3 Kjell, J.A., Saba, M., “Electrical capacitance tomography—Sensor models, design, simulations, and experimental verification”, IEEE Sensors J., 6 (5), 1256-1266 (2006).
4 Huang, Z.Y., Wang, B.L., Li, H.Q., “Application of electrical capacitance tomography to the void fraction measurement of two-phase flow”, IEEE Trans. Instrum. Measur., 52 (1), 7-12 (2003).
5 Wang, H.X., Tang, L., Cao, Z., “An image reconstruction algorithm based on total variation with adaptive mesh refinement for ECT”,Flow Measur. Instrum., 18, 262-267 (2007).
6 Lei, J., Liu, S., Sun, M., “An image reconstruction algorithm base on the extended Tikhonov regularization method for electrical capacitance tomography”, Measurement, 42, 368-376 (2009).
7 Lu, G., Peng, L.H., Zhang, B.F., Liao, Y.B., “Preconditioned Landweber iteration algorithm for electrical capacitance tomography”,Flow Measur. Instrum., 16, 163-167 (2005).
8 Polydorides, N., Lionheart, W.R.B., “A Matlab toolkit for three-dimensional electrical impedance tomography: A contribution to the electrical impedance and diffuse optical reconstruction software project”, Measur. Sci. Technol., 13 (12), 1871-1883 (2002).
9 Li, Y., Yang, W.Q., “Image reconstruction by nonlinear Landweber iteration for complicated distributions”, Measur. Sci. Technol., 19 (9),094014 (2008).
10 Yan, H., Liu, L.J., Xu, H., “Image reconstruction in electrical capacitance tomography using multiple linear regression and regularization”, Measur. Sci. Technol., 12 (5), 575-581 (2001).
11 Hu, H.L., Xu, T.M., Hui, S.E., “A high-accuracy, high-speed interface circuit for differential-capacitance transducer”, Sensors Actuators A, 125, 329-334 (2006).
12 Yan, H., Liu, Y.H., Liu, C.T., “Identification of flow regimes using back-propagation networks trained on simulated data based on a capacitance tomography sensor”, Meas. Sci. Technol., 15, 432-436 (2004).
13 Zhang, L.F., Wang, H.X., Ma, M., “Image reconstruction algorithm for electrical capacitance tomography based on radial basis function neural network”, In: Proceedings of 2005 International Conference on Machine Learning and Cybernetics, Machine Learning and Cybernetics, Machine Learning and Cybernetics, Guangzhou, China,4149-4152 (2005).
14 Hu, H.L., Chen, X., Bai, T., “An ECT image reconstruction method based on radial basis function and wavelet transform”, Journal of Xi’an Jiaotong University, 44 (2), 1-5 (2010). (in Chinese)
15 Ercelebi, E., Koc, S., “Lifting-based wavelet domain adaptive Wiener filter for image enhancement”, In: IEEE Proceedings on Vision,Image and Signal Processing, Institution of Engineering and Technology, UK, 31-36 (2006).
16 Chang, S.G., Yu, B., Vetterli, M., “Spatially adaptive wavelet thresholding with context modeling for image denoising”, IEEE Trans.Image Process., 99, 1522-1531 (2000).
17 Cláudio, R.J., Jacob, S., “Adaptive image denoising and edge enhancement in scale-space using the wavelet transform”, Pattern Recogn. Lett., 24 (7), 965-971 (2003).
18 Ciarlini, P., Cascio, M.L.L., “Stationary wavelet decomposition in image restoration: Some experimental results”, In: International Conference on Numerical Analysis and Applied Mathematics, Rhodes, Greece, 612-614 (2005).
19 Lee, H.S., Cho, Y., Byun, H., Yoo, J., “An image enhancement technique based on wavelets”, In: Proceedings of the First IEEE International Workshop on Biologically Motivated Computer Vision, Lee,S.W., Bülthoff, H.H., Poggio, T., eds., Springer-Verlag, London, UK,286-296 (2000).
20 Heric, D., Potocnik, B., “Image enhancement by using directional wavelet transform”, J. Comput. Infor. Technol., 14, 299-305 (2006).
21 Claudio, R.J., Scharcanski, J., “Wavelet transform approach to adaptive image denoising and enhancement”, J. Electr. Imag., 13, 278-285(2004).
22 Yang, C.C., “Improving the sharpness of an image with non-uniform illumination”, Optics Laser Technol., 37, 235-238 (2005).
23 Hu, H.L., Xu, T.M., “A novel capacitive system for the concentration measurement of pneumatically conveyed pulverized fuel at power stations”, Flow Measur. Instrum., 17, 87-89 (2006).
2011-01-18, accepted 2012-01-12.
* Supported by the National Natural Science Foundation of China (50777049, 51177120), the National High Technology Research and Development Program of China (2009AA04Z130) and the RCUK’s Energy Programme (EP/F061307/1).
** To whom correspondence should be addressed. E-mail: hlhu@mail.xjtu.edu.cn
猜你喜欢
疯狂英语·新读写(2022年12期)2022-03-07
Chinese Physics B(2022年2期)2022-02-24
知识经济·中国直销(2018年5期)2018-05-26
商周刊(2017年26期)2017-04-25
中国卫生(2016年8期)2016-11-12
中国卫生(2016年2期)2016-11-12
海峡姐妹(2015年9期)2015-02-27
浙江人大(2014年6期)2014-03-20
卷宗(2014年1期)2014-03-20
 Chinese Journal of Chemical Engineering2012年2期
- Chinese Journal of Chemical Engineering的其它文章
- Optimization for Production of Intracellular Polysaccharide from Cordyceps ophioglossoides L2 in Submerged Culture and Its Antioxidant Activities in vitro*
- Application of Choline Chloride·xZnCl2 Ionic Liquids for Preparation of Biodiesel*
- Inhibiting Effect of Ciprofloxacin, Norfloxacin and Ofloxacin on Corrosion of Mild Steel in Hydrochloric Acid*
- Experimental and Numerical Study on Heat Transfer Enhancement of a Rectangular Channel with Discontinuous Crossed Ribs and Grooves*
- Effect of the Interference Instant of Zeolite HY Catalyst on the Pyrolysis of Pubescens*
- Translocation of Polymer Through a Nanopore Studied by Langevin Dynamics: Effect of the Friction Coefficient*