
Voidage Measurement of Air-Water Two-phase Flow Based on ERT Sensor and Data Mining Technology*
2012-10-31 03:35WANGBaoliang王保良MENGZhenzhen孟振振HUANGZhiyao黄志尧JIHaifeng冀海峰andLIHaiqing李海青
关键词:海峰
WANG Baoliang (王保良)**, MENG Zhenzhen (孟振振), HUANG Zhiyao (黄志尧), JI Haifeng(冀海峰) and LI Haiqing (李海青)
State Key Laboratory of Industrial Control Technology, Department of Control Science and Engineering, Zhejiang University, Hangzhou 310027, China
Voidage Measurement of Air-Water Two-phase Flow Based on ERT Sensor and Data Mining Technology*
WANG Baoliang (王保良)**, MENG Zhenzhen (孟振振), HUANG Zhiyao (黄志尧), JI Haifeng(冀海峰) and LI Haiqing (李海青)
State Key Laboratory of Industrial Control Technology, Department of Control Science and Engineering, Zhejiang University, Hangzhou 310027, China
Based on an electrical resistance tomography (ERT) sensor and the data mining technology, a new voidage measurement method is proposed for air-water two-phase flow. The data mining technology used in this work is a least squares support vector machine (LS-SVM) algorithm together with the feature extraction method, and three feature extraction methods are tested: principal component analysis (PCA), partial least squares (PLS) and independent component analysis (ICA). In the practical voidage measurement process, the flow pattern is firstly identified directly from the conductance values obtained by the ERT sensor. Then, the appropriate voidage measurement model is selected according to the flow pattern identification result. Finally, the voidage is calculated. Experimental results show that the proposed method can measure the voidage effectively, and the measurement accuracy and speed are satisfactory. Compared with the conventional voidage measurement methods based on ERT, the proposed method doesn’t need any image reconstruction process, so it has the advantage of good real-time performance. Due to the introduction of flow pattern identification, the influence of flow pattern on the voidage measurement is overcome. Besides, it is demonstrated that the LS-SVM method with PLS feature extraction presents the best measurement performance among the tested methods.
two-phase flow, voidage measurement, electrical resistance tomography sensor, data mining, feature extraction
1 INTRODUCTION
Voidage, which is the ratio of gas area to the total area of pipeline cross section, is an important parameter in gas-liquid two-phase flow. Its measurement is significant for status monitoring, quality control,safety assurance and flowrate measurement of the two-phase flow system [1]. Although many voidage measurement methods have been proposed, few of them can meet the practical requirements because of the inherent complexity of two-phase flow.
Electrical resistance tomography (ERT) technique has proved to be an attractive and promising method for voidage measurement of gas-liquid two-phase flow [2-4].However, most of the conventional voidage measurement methods based on ERT are to construct the phase distribution image of two-phase flow in the pipe and calculate the voidage value based on the image [2, 4].In these methods, the complex and time-consuming image reconstruction process will lead to bad real-time performance, and the measurement accuracy is not satisfactory because of the influence of “soft-field”characteristics of ERT. Therefore, their practical applications are limited, and more research work should be undertaken in this area.
The conductance data measured by the ERT sensor reflects the information of the phase distribution and fraction of gas-liquid flow. It is possible to identify the flow pattern and measure the voidage directly from the conductance data. The aim of this work is to propose a new voidage measurement method for air-water two-phase flow based on a 16-electrode ERT sensor and the data mining technology. The data mining technology is used to implement the flow pattern identification using the least squares support vector machine(LS-SVM) classification algorithm [5], and the voidage determination from the conductance data using the LS-SVM regression algorithm [6]. Thus, the image reconstruction process in conventional voidage measurement methods is by-passed, and the real-time performance is improved. Meanwhile, flow pattern identification is introduced before voidage measurement and different measurement models are used for different flow patterns, so the influence of flow pattern on the voidage measurement is overcome. Three feature extraction methods are applied to pre-process the conductance data and reduce the input dimensionality of LS-SVM: principal component analysis (PCA), partial least squares (PLS) and independent component analysis (ICA). These three methods are tested and compared in their performance for the voidage measurement.
Experiments showed that the proposed method could measure the voidage effectively for air-water two-phase flow and the LS-SVM method with PLS feature extraction presented the best measurement performance among the tested methods.
2 VOIDAGE MEASUREMENT SYSTEM
2.1 Structure of measurement system
The voidage measurement system consists of anERT sensor, a data acquisition unit and a computer.The ERT sensor is made of a plexiglas pipe with 16 evenly spaced electrodes mounted around the inner surface. The data acquisition unit injects the bi-directional pulse current into the two neighbouring electrodes,and measures the voltage from other pairs of neighbouring electrodes. This procedure is repeated until all the independent measurements have been made, and then 104 independent voltage values which represent the conductance of the two-phase fluid are obtained and transferred to the computer [7]. The computer uses the conductance data to identify the current flow pattern and calculate the voidage.
2.2 Voidage measurement scheme
Flow patterns of two-phase flow influence the output signal of ERT sensor, then affect strongly the way of estimating the voidage. In order to overcome this influence, the flow pattern is identified first and different voidage measurement models are used for different flow patterns in this work.
Various flow patterns appear in the horizontal air-water flow, such as bubble flow, stratified flow,slug flow and annular flow. However, voidage is a parameter defined over the cross section of pipe, and only three typical flow patterns appear at the cross section of ERT sensor: bubble flow, stratified flow and annular flow, so the voidage measurement models are constructed for these three cross-sectional flow patterns only.
Due to the complexity of two-phase flow, it’s difficult to explore the accurate relationship between the conductance data and the flow pattern (or voidage).The data mining technology is applied here to implement this work, that is, the LS-SVM classification algorithm is used to develop the flow pattern classifier,and the LS-SVM regression algorithm is applied for the development of the voidage measurement models.
Because the irrelevant features and correlated features in the input data could deteriorate the generalization performance of LS-SVM [8], feature extraction for LS-SVM is necessary. PCA (principal component analysis), PLS (partial least squares) and ICA(independent component analysis) are all well-known methods for feature extraction. PCA linearly transform the input data into the uncorrelated components [9],and PLS extracts the components which are uncorrelated among themselves and most correlated to the objective variable [9, 10]. ICA extracts mutually statistically independent components from input variables [11].
The voidage measurement scheme is illustrated in Fig. 1. The left side of this figure shows the practical voidage measurement process and the right side gives the development process of flow pattern classifier and voidage measurement model.
3 FEATURE EXTRACTION OF CONDUCTANCE DATA
3.1 Three feature extraction methods
PCA, PLS and ICA all linearly transform the 104-dimensional input conductance data into n-dimensional features (n<104). Given l input data rt(t 1, 2, ··, l and rt[rt1, rt2, ··, rt104] is the 104 conductance values measured in one time), the feature vector stis obtained as follows [9-11]:

where U is 104×n transformation matrix which is different in different methods. st=[st1, st2,··, stn] is the vector with n extracted features.
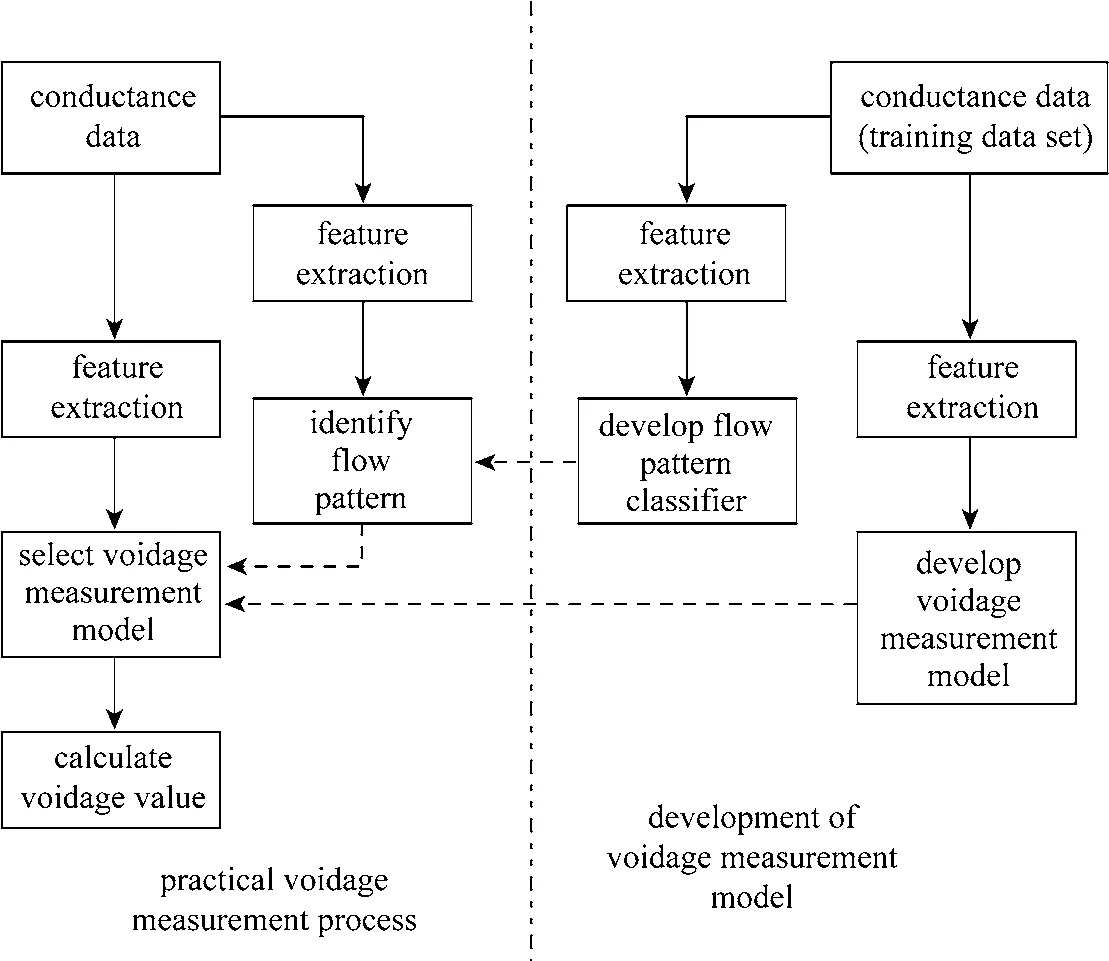
Figure 1 Voidage measurement flowsheet
PCA transforms the original input data into uncorrelated features, which is very common used in the statistics analysis. The column vector of transformation matrix U is the eigenvector of the sample covariance matrix, whereThe 104-dimensional conductance data can be transformed into 104 features, namely there are 104 elements in st(st=[st1, st2,··, st104]). The first several features in stcontain the maximum variances of original conductance data, while the last ones in stare practically noise signals. Besides, because these features are uncorrelated with each other, the multicollinearity of original conductance data is eliminated,and this can improve the performance of LS-SVM models. In order to reduce the dimensionality of features, only the first n features which have the maximum variances are retained.
ICA is famously used in blind source separation.It transforms the original mixing signal to the features which are statistically independent, i.e. the joint probability density of the components in stis equal to the product of the marginal densities of these components. The higher order information of the input variables is required to implement ICA, while the features extracted by PCA are merely uncorrelated, and only the second-order information of the sample covariance is used in PCA. Therefore, the ICA can also eliminate the multi-collinearity of conductance data, and can be expected to perform better than PCA. Many algorithms have been developed for performing ICA, the one used in this work is called fixed-point FastICA algorithm [12]. The first step of ICA is to make the input data orthonormal, which is realized by PCA in this work. The use of PCA also reduces the dimensionality of extracted features in st.
The most difference of PLS to PCA and ICA is that PLS takes the objective variable (i.e. the flow pattern and the voidage in this paper) into consideration in the transformation process. The features extracted by PLS are uncorrelated to each other as that in PCA,and they are most correlated to the objective variable.PLS can be implemented by carrying out NIPALS(nonlinear iterative partial least squares) algorithm [9].The features are extracted one by one from the conductance data and the objective variable. Every extracted feature is uncorrelated to the others, and the covariance between the feature and the objective variable is maximized. After extraction, 104 uncorrelated features are obtained. Similarly, only the first n features which are the most correlated to the objective variable are retained, so the dimensionality is reduced.
3.2 Feature extraction of conductance data
By using the above algorithms, the experimental data set of conductance values are processed to obtain the transformation matrix U. One important parameter in these feature extraction methods is the number n of retained features. In this work, this number is determined through five-fold cross-validation method [8].The experimental data set is divided into five parts,four parts are used to construct the measurement model, and the other one part is used to validate this model and give the measurement error. After five parts are used as the validation set in turn, the measurement errors are summed up as the cross-validation error.The number n which produces the smallest crossvalidation error is selected as the final number of retained features.
4 FLOW PATTERN IDENTIFICATION
4.1 Development of flow pattern classifier
The cross-sectional flow pattern is identified as bubble flow, stratified flow and annular flow, so the flow pattern classification is a multiclassification problem. The LS-SVM multiclassification method used in this work is the “one-against-one” method [13].The binary classifier is constructed between every two flow patterns, so three binary classifiers are constructed between three flow patterns.
For training data set with l samples {st, yt} (t1,2, ··, l, stis the extracted feature, yt∈{−1, 1} is the flow pattern label) from two flow patterns, the binary flow pattern classifier is constructed in the following form [5]:
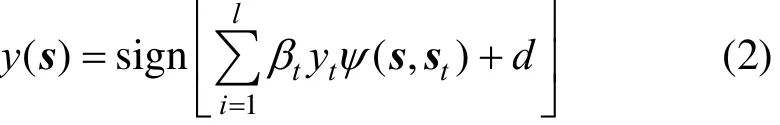
where y is the predicted flow pattern label, s is the feature vector transformed from the measured conductance values,is called the kernel function (σ is its parameter),tβ is the Lagrangian multiplier and d is the deviation item.tβ and d are determined by solving the following matrix equation [5]:
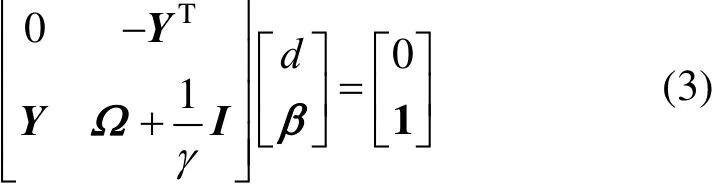
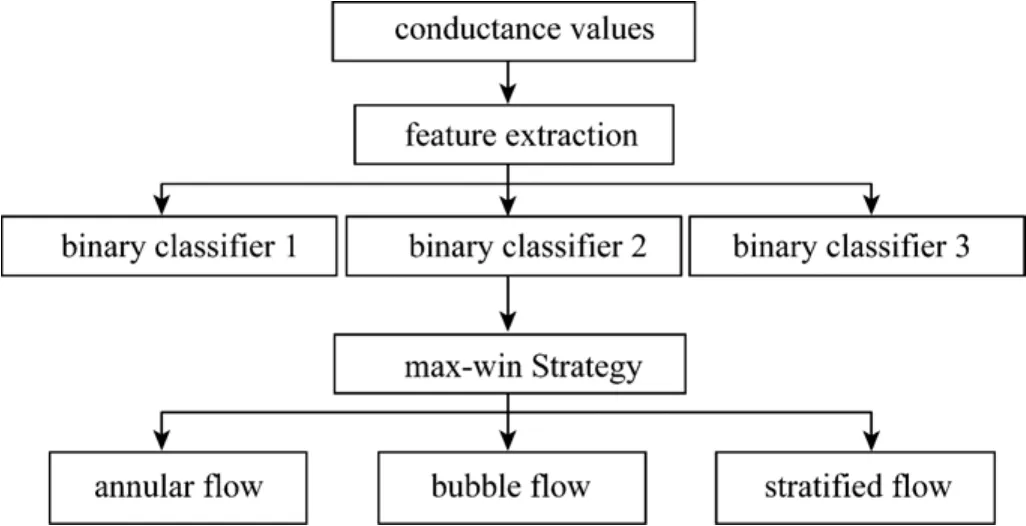
Figure 2 Flowchart of flow pattern identification process
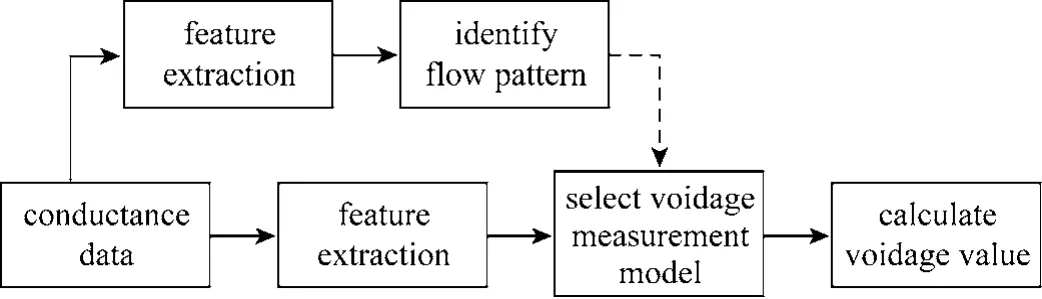
Figure 3 Flowchart of voidage measurement process
4.2 Flow pattern identification process
Figure 2 illustrates the practical flow pattern identification process in which the voting and “max wins” strategy is used [13]. The conductance values measured by the ERT sensor are firstly transformed by the feature extraction, and the features are fed into the three binary classifiers. The three binary classifiers are constructed beforehand between every two flow patterns, and they are “annular flow vs. bubble flow”classifier, “annular flow vs. stratified flow” classifier and “bubble flow vs. stratified flow” classifier. All three classifiers identify the current flow pattern and“vote” for one pattern. For example, if one classifier identifies the flow as annular flow, then the vote for annular flow is added by one, so the maximum vote for a candidate pattern is two. After voting, one of the three flow patterns will get the largest vote, which is then identified as the current flow pattern.
5 VOIDAGE MEASUREMENT
5.1 Development of voidage measurement model The voidage measurement models are constructed for bubble flow, stratified flow and annular flow respectively. For the training data set with l samples {st, αt} (t=1, 2, ··, l, stis the extracted feature,which is defined by Eq. (1), αtis the voidage) from one flow pattern, the voidage measurement model is in the following form [6]:
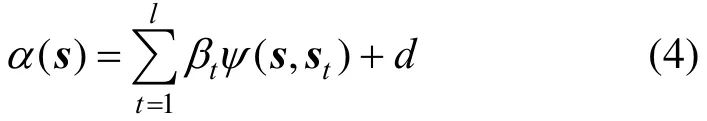
where α is the calculated voidage, s is the feature vector transformed from the measured conductance values, ψ (s,st) = e xp(−|s − st|2/σ2) is the kernel function. The parameterstβ and d can be obtained by solving the following matrix equation [6]:
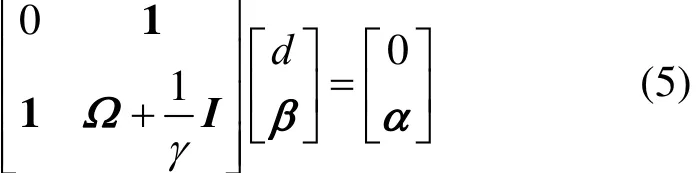
where 1 = [ 1,1,···,1]T, the element in matrix Ω is Ωij=The evolutionary strategy [(μ +λ) − ES] was used to optimize the parameters γ and σ by minimizing the cross-validation errors [14, 15], which is similar to the parameter optimization in flow pattern identification.
5.2 Voidage measurement process
The practical voidage measurement process is shown in Fig. 3. Firstly, the conductance data are pre-processed by the feature extraction (i.e. PCA, ICA and PLS methods), as shown by Eq. (1). Secondly, the extracted features are inputted to the flow pattern classifiers as shown in Eq. (2), and to identify the current flow pattern according to the method in Fig. 2.Then, according to the flow pattern identification result, the appropriate voidage measurement model forthis flow pattern, Eq. (4), is selected to calculate the voidage value from the conductance data.
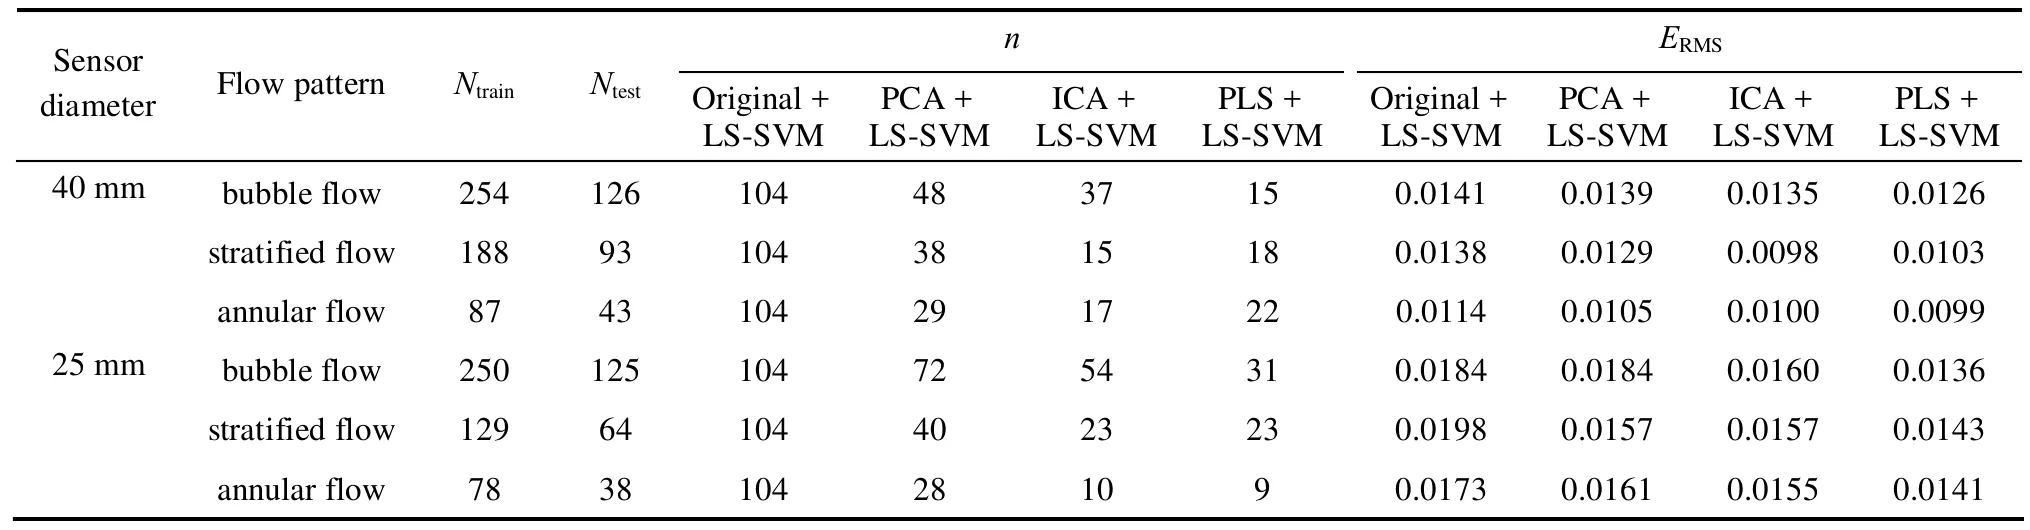
Table 1 Comparison between different feature extraction methods
6 EXPERIMENTAL RESULTS
Because of the lack of dynamic measurement methods to effectively obtain precise reference voidage, static experiments were carried out to evaluate the performance of the voidage measurement method.Water and some glass pipes of different diameters were used to simulate the cross-sectional geometric structure of air-water flow, so that the actual voidage could be calculated. Two ERT sensors with inner diameters of 40 mm and 25 mm were tested, and three typical flow patterns are simulated: bubble flow,stratified flow and annular flow. Many small-sized glass tubes are used to act as bubbles, and put different numbers of pipes in the ERT sensor which is full of water to simulate the bubble flow; put different large glass tubes in the ERT sensor and fill the gap between them with water to simulate the annular flow;place the ERT sensor horizontally and adjust the water level in it to simulate the stratified flow.
All the data were divided into two parts for different pipe diameters and flow patterns: training data set and testing data set. The numbers of training data(Ntrain) and testing data (Ntest) for each flow pattern are shown in Table 1. The feature extraction methods PCA, PLS and ICA are tested and compared for every flow pattern in the experiment. The root mean squares error (ERMS) and the number of features used (n) are utilized as the evaluation criterion. ERMSis defined as
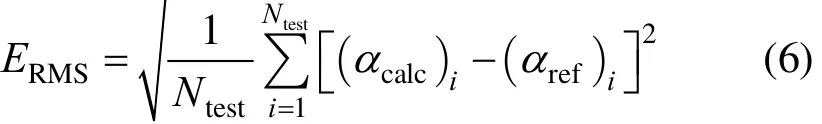
in which αcalcis the calculated voidage, and αrefis the reference voidage value.
The experiment shows that the proposed method can measure the voidage effectively, and the experimental comparison result is given in Table 1. Besides,the validation of the flow pattern identification method in Section 4 can be found in Ref. [16], which is used in the dynamic flow experiment.
It can be seen that the voidage measurement models with PCA give similar and sometimes smaller error than that without feature extraction. The number of features is dramatically decreased compared with the original number 104. The higher order information of the input variables is extracted by ICA, and this makes ICA perform better than PCA. The ICA +LS-SVM method presents smaller measurement error and less extracted features (n). Overall, the PLS method presents the best performance for two pipe diameters and all flow patterns, even though sometimes ICA gives better ERMS(i.e. stratified flow 40 mm). Because the PLS method extracts the conductance features that are most correlated to the voidage,so it can give the smallest error and the lowest feature number most of the time.
Figure 4 shows the voidage measurement results with PLS feature extraction. The maximum error for bubble flow, stratified flow and annular flow is less than 6.0%, 4.9% and 3.9% respectively, and the measurement time is less than 0.1 s.
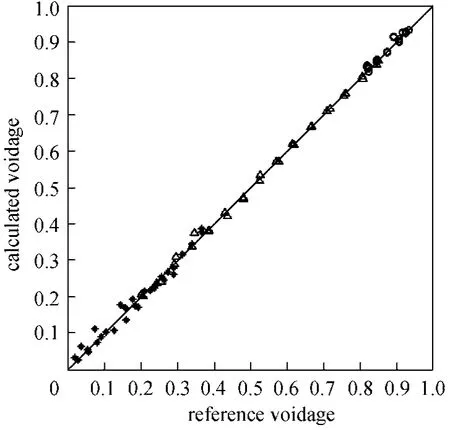
Figure 4 Voidage measurement results of LS-SVM model with PLS feature extraction
7 CONCLUSIONS
A new voidage measurement method for air-water two-phase flow is proposed based on an ERT sensor and the data mining technology. The data mining technology used for flow pattern identification and voidage measurement is the LS-SVM algorithm.Static experimental results demonstrate that the proposed method can achieve effective and rapid voidage measurement. Compared with the conventional voidage measurement methods based on ERT, the proposed method doesn’t need any image reconstruction process and has the advantage of good real-time performance.Meanwhile, the flow pattern identification is introduced to the voidage measurement, so the influence of flow pattern on the voidage measurement is overcome.
Three feature extraction methods, PCA, PLS and ICA, were used for pre-processing the conductance data from ERT sensor. Experimental results show that PLS feature extraction presents better overall performance of dimensionality reduction and measurement accuracy than PCA, ICA and that without feature extraction. With the PLS method and the LS-SVM algorithm, the maximum error of voidage measurement for bubble flow, stratified flow and annular flow is less than 6.0%, 4.9% and 3.9% respectively, and the measurement time is less than 0.1 s.
1 Li, H.Q., Two-phase Flow Parameter Measurement and Applications,Zhejiang University Press, Hangzhou (1991). (in Chinese)
2 Giguere, R., Fradette, L., Mignon, D., Tanguy, P.A., “ERT algorithm for quantitative concentration measurement of multiphase flows”,Chem. Eng. J., 141, 305-317 (2008).
3 Dong, F., Jiang, Z.X., Qiao, X.T., Xu, L.A., “Application of electrical resistance tomography to two-phase pipe flow parameter measurement”, Flow Meas. Instrum., 14 (4-5), 183-192 (2003).
4 Dickin, F., Wang, M., “Electrical resistance tomography for process applications”, Meas. Sci. Technol., 7, 247-260 (1996).
5 Suykens, J.A.K., Vandewalle, J., “Least squares support vector machine classifiers”, Neural Process. Lett., 9 (3), 293-300 (1999).
6 Suykens, J.A.K., Vandewalle, J., “Recurrent least squares support vector machines”, IEEE Trans. Circuits Syst. I Fundam. Theor. Appl.,47 (7), 1109-1114 (2000).
7 Wang, B.L., Huang, Z.Y., Li, H.Q., “Design of high-speed ECT and ERT system”, In: the 6th International Symposium on Measurement Techniques for Multiphase Flows, J. Phys. Conf. Ser., 147 (1),012035 (2009).
8 Cao, L.J., Chua, K.S., Chong, W.K., Lee, H.P., Gu, Q.M., “A comparison of PCA, KPCA, and ICA for dimensionality reduction in support vector machine”, Neurocomputing, 55, 321-336 (2003).
9 Chen, D.Z., Multivariate Data Processing, Chemical Industry Press,Beijing (1998). (in Chinese)
10 Wang, H.W., Partial Least Square Regression Method and Applications, National Defence Industry Press, Beijing (1999). (in Chinese)
11 Hyvarinen, A., Oja, E., “Independent component analysis: Algorithms and applications”, Neural Networks, 13, 411-430 (2000).
12 Hyvarinen, A., “Fast and robust fixed-point algorithm for independent component analysis”, IEEE Trans. Neural Networks, 10 (3),626-634 (1999).
13 Hsu, C.W., Lin, C.J., “A comparison of methods for multiclass support vector machines”, IEEE Trans. Neural Networks, 13 (2),415-425 (2002).
14 Friedrichs, F., Igel, C., “Evolutionary tuning of multiple SVM parameters”, Neurocomput., 64, 107-117 (2005).
15 Bäck, T., Schwefel, H.P., “An overview of evolutionary algorithms for parameter optimization”, Evol. Comput., 1 (1), 1-23 (1993).
16 Meng, Z., Huang, Z., Wang, B., Ji, H., Li, H., Yan, Y., “Air-water two-phase flow measurement using a venturi meter and an electrical resistance tomography sensor”, Flow Meas. Instrum., 21 (3),268-276 (2010).
2011-11-17, accepted 2012-01-17.
* Supported by the National Natural Science Foundation of China (60972138).
** To whom correspondence should be addressed. E-mail: blwang@iipc.zju.edu.cn
猜你喜欢
读者(2022年21期)2022-10-24
Chinese Physics B(2022年8期)2022-08-31
歌海(2022年1期)2022-03-29
Chinese Physics B(2019年8期)2019-08-16
河北书画研究(2019年2期)2019-08-04
儿童大世界(2019年3期)2019-04-11
歌海(2019年6期)2019-02-22
黄梅戏艺术(2018年1期)2018-07-08
商周刊(2017年25期)2017-04-25
阅读(中年级)(2016年5期)2016-05-14
 Chinese Journal of Chemical Engineering2012年2期
- Chinese Journal of Chemical Engineering的其它文章
- Optimization for Production of Intracellular Polysaccharide from Cordyceps ophioglossoides L2 in Submerged Culture and Its Antioxidant Activities in vitro*
- Application of Choline Chloride·xZnCl2 Ionic Liquids for Preparation of Biodiesel*
- Inhibiting Effect of Ciprofloxacin, Norfloxacin and Ofloxacin on Corrosion of Mild Steel in Hydrochloric Acid*
- Experimental and Numerical Study on Heat Transfer Enhancement of a Rectangular Channel with Discontinuous Crossed Ribs and Grooves*
- Effect of the Interference Instant of Zeolite HY Catalyst on the Pyrolysis of Pubescens*
- Translocation of Polymer Through a Nanopore Studied by Langevin Dynamics: Effect of the Friction Coefficient*