
Evaluation of suspended load transport rate using transport formulas and artificial neural network models (Case study: Chelchay Catchment)*
2013-06-01 12:29HADDADCHIArman
水动力学研究与进展 B辑 2013年3期
HADDADCHI Arman
Australian Rivers Institute, Griffith University, Nathan, QLD 4111, Australia, E-mail:arman.haddadchi@griffithuni.edu.au
MOVAHEDI Neshat
Department of Water Engineering, Gorgan University of Agricultural Sciences and Natural Resources, Gorgan, Iran
VAHIDI Elham
Department of Irrigation and Reclamation Engineering, University of Tehran, Karaj, Iran OMID Mohammad Hossein
Department of Irrigation and Reclamation Engineering, University of Tehran, Karaj, Iran
DEHGHANI Amir Ahmad
Department of Water Engineering, Gorgan University of Agricultural Sciences and Natural Resources, Gorgan, Iran
Evaluation of suspended load transport rate using transport formulas and artificial neural network models (Case study: Chelchay Catchment)*
HADDADCHI Arman
Australian Rivers Institute, Griffith University, Nathan, QLD 4111, Australia, E-mail:arman.haddadchi@griffithuni.edu.au
MOVAHEDI Neshat
Department of Water Engineering, Gorgan University of Agricultural Sciences and Natural Resources, Gorgan, Iran
VAHIDI Elham
Department of Irrigation and Reclamation Engineering, University of Tehran, Karaj, Iran OMID Mohammad Hossein
Department of Irrigation and Reclamation Engineering, University of Tehran, Karaj, Iran
DEHGHANI Amir Ahmad
Department of Water Engineering, Gorgan University of Agricultural Sciences and Natural Resources, Gorgan, Iran
(Received September 25, 2012, Revised March 15, 2013)
Accurate estimation of sediment load or transport rate is very important to a wide range of water resources projects. This study was undertaken to determine the most appropriate model to predict suspended load in the Chelchay Watershed, northeast of Iran. In total, 59 data series were collected from four gravel bed-rivers and a sand bed river and two depth integrating suspended load samplers to evaluate nine suspended load formulas and feed forward backpropagation Artificial Neural Network (ANN) structures. Although the Chang formula with higher correlation coefficient (r =0.69)and lower Root Mean Square Error (RMSE=0.013)is the best suspended load predictor among the nine studied formulas, the ANN models significantly outperform traditional suspended load formulas and show their superior performance for all statistical parameters. Among different ANN structures two models including 4 inputs, 4 hidden and one output neurons, and 4 inputs, 4 and one hidden and one output neurons provide the best simulation with the RMSE values of 0.0009 and 0.001, respectively.
sediment transport, suspended load formulas, Artificial Neural Network (ANN), river engineering
Introduction
The prediction of river sediment load is an important issue in hydraulic engineering. In most natural rivers, sediments are mainly transported as suspended load[1]. Suspended load transport is an advanced stage of bed load transport defined as that moving with the flow without contact with the bottom[2]and staying in suspension for an appreciable length of time[1]. As the hydraulic forces exerted on sediment particles exceed the threshold value at the beginning of motion, coarse sediment particles move in contact with the bed surface, and the amount of these particles called bed load. Fine particles are brought into suspension when turbulent velocity fluctuations are sufficiently large to maintain the particles within the mass of fluid without frequent bed contact[3]. There have been several publicshed suspended transport formulas and the verification of the accuracy of these formulas is mainly based on laboratory data and limited field data in some carefully designed data collection programs. It is desirable to use routine data collected from river gauging stations to determine the ability of some commonly-used formulas to predict sediment transport. Although manystudies evaluated bed load formulas[4-6], they rarely evaluated suspended load formulas. For example, Worapansopak (1992) evaluated five sediment transport formulas including the Bagnold, Bruk, Celik, modified Celik, and Vlugter formulas for the total suspended sediment. The main conclusion was that all the formulas overestimated the sediment transport[7].

Table 1 Suspended load formulas

Different from the approach of hydrodynamic and transport modeling, the adoption of expert system related with modeling techniques, such as artificial neural networks, has drawn increasing attention recently. Artificial Neural Network (ANN) system, a massively parallel distributed information processing system, has gained popularity among researchers as predictive models of complex phenomena. The main advantage of using ANNs is their ability to identify complex non-linear relationship between input and output data without detailed investigation of the nature of the internal structure of the physical process. In the present study, the results of the ANN model are compared with nine conventional suspended load discharge formulas, to assess its improved predictive abilitycompared with conventional approaches.
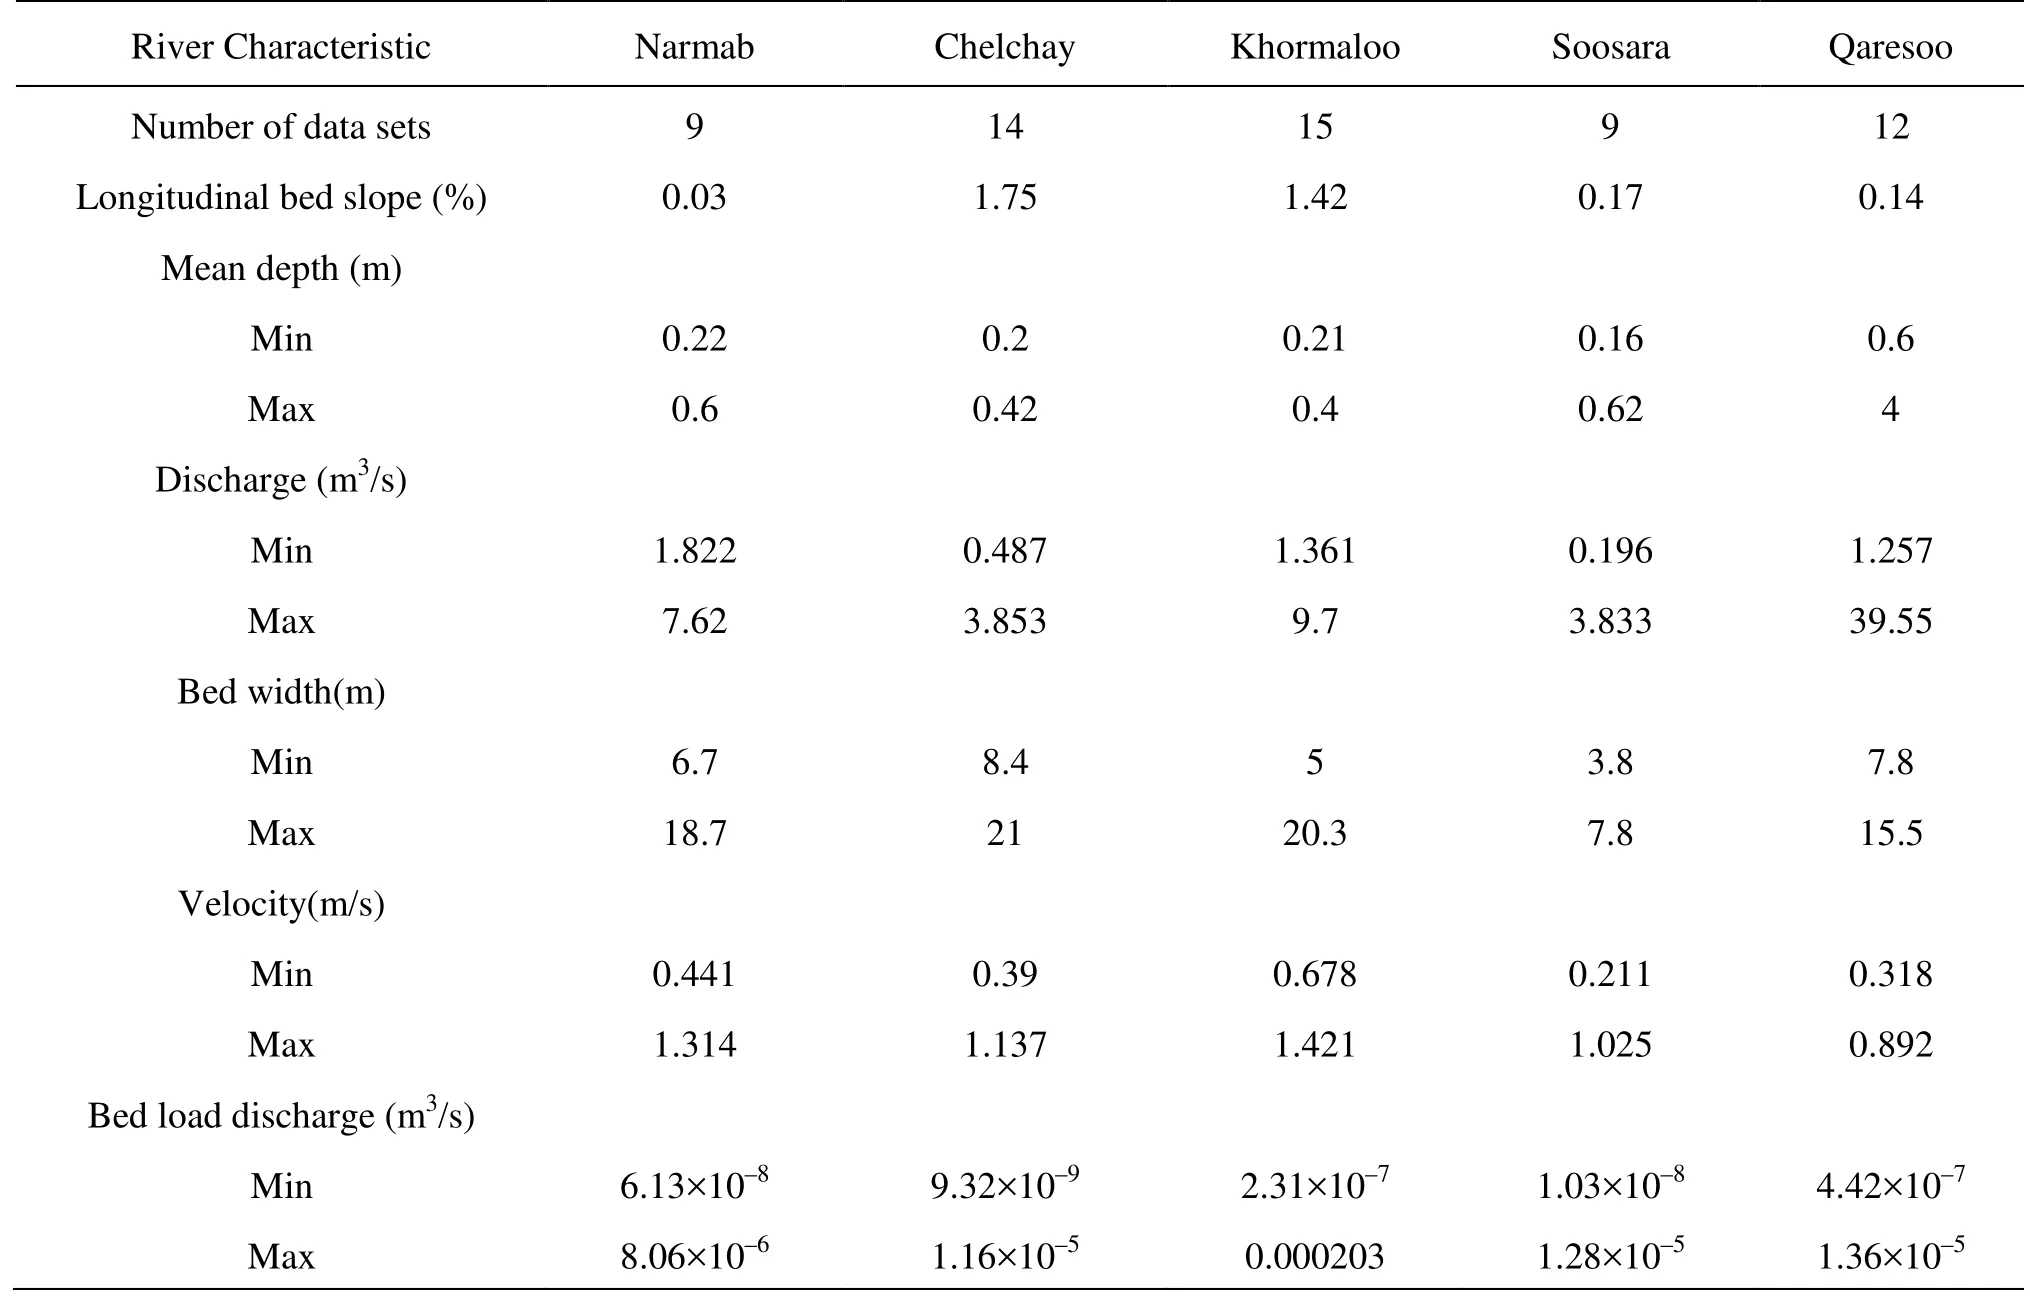
Table 2 Ranges in hydrologic characteristics of Chelchay Watershed Rivers
The application of ANN technology has offered promising results in sediment transport forecasting context. ANNs provided powerful alternative for suspended sediment estimation using hydrologic data[8-11]and hydro-climatic data[12-14], using hydraulic parameters to predict bed load[15-17]and total load[18]. To the knowledge of the authors, no work has been reported in the literature that addresses the application of the ANN approach using hydraulic and sediment data for the estimation of suspended sediment. Therefore, the aims of this paper is to: (1) compare nine formulas for suspended load transport with prototype data from four gravel bed rivers and a sand bed river with different hydrological and sedimentological criteria and (2) evaluate the results of suspended load formulas in allrivers with different structures of artificial neural network models.
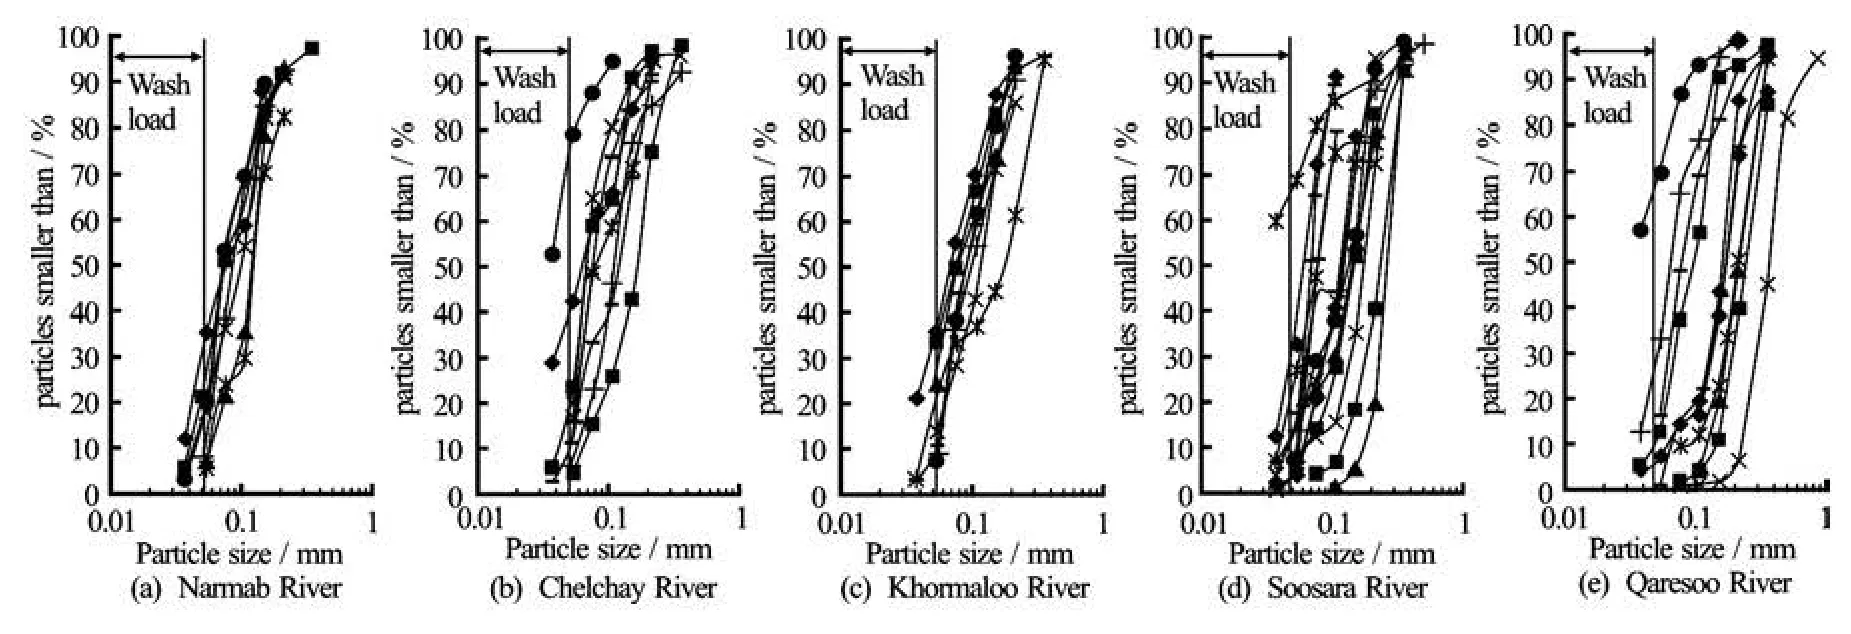
Fig.2 Grain size distribution of suspended load for Narmab, Chelchay, Khormaloo, Soosara, and Qaresoo Rivers
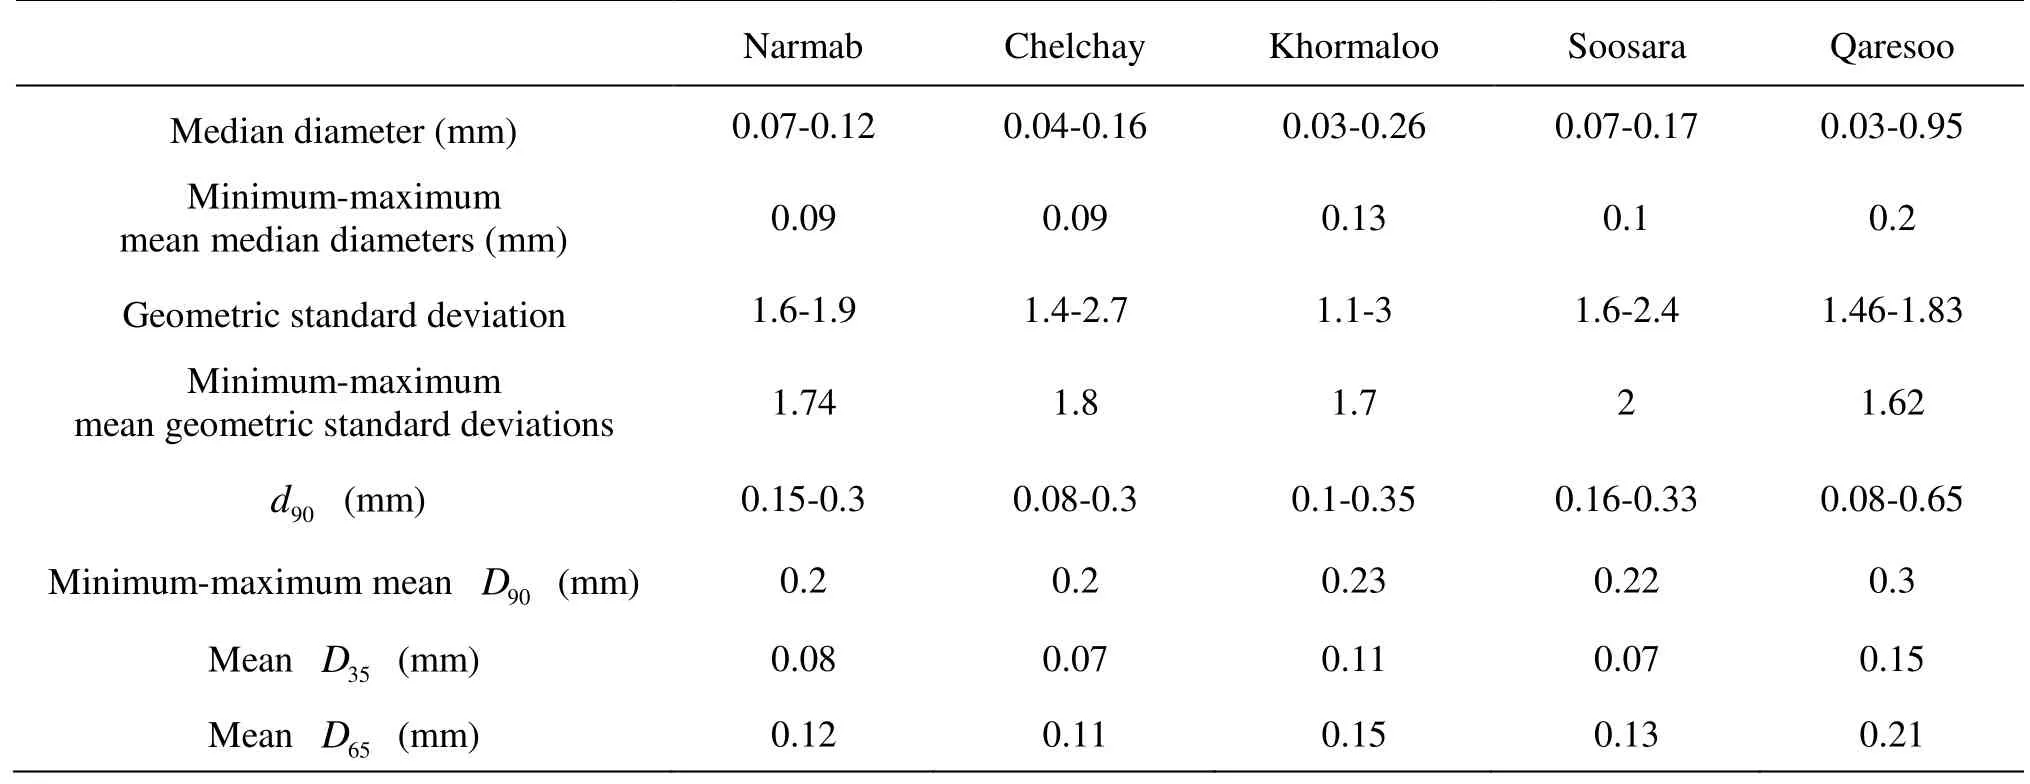
Table 3 Sediment properties of suspended load in Chelchay Watershed Rivers
2. Materials and methods
2.1 Selection of suspended load formulas
The following nine suspended load discharge formulas were applied for the comparison of measured and calculated values (see Table 1).
Einstein (1950) introduced his method based on parabolic distribution of the fluid mixing coefficient and a logarithmic distribution of the velocity. Einstein was probably the first to propose a method for the calculation of sediment transport on a grain-size specific basis, proposing separate relations for bed and suspended loads. For the suspended load, Einstein used estimators of the log-law velocity profile and Rouse concentration profile along with the Einstein bed-load equation for the near-bed concentration[19].
The method of Bagnold (1966) is based on an energy balance concept relating the suspended load transport to the work done by the fluid. Bagnold stated that particles only remains in suspension when the turbulent eddies have dominant vertical velocity components which exceed the particle fall velocity.
Bijker’s (1971) formula is based on a transport formula for rivers proposed by Kalinske and Frijlink (Frijlink 1952) and the concept of Einstein’s formula. The reference concentration for the suspended sediment was expressed as a function of the bed load transport. Different empirical coefficient values were used in his formula[20].
Brooks (1963) assumed that the logarithmic velocity distribution is applicable, giving a relationship similar to Einstein (1950). Brooks used a power law velocity distribution equation and numerical integration to develop a graph that can be used to calculate suspended sediment transport if the sediment concentration at mid-depth is known.
Indian engineers Samaga, Ranga Raju and Garde (1986) introduced a theory for the computation of the transport rates of different size fractions of bed material for the suspended load. The theory is complicated and uses a number of parameters to be read from several tables and graphs.
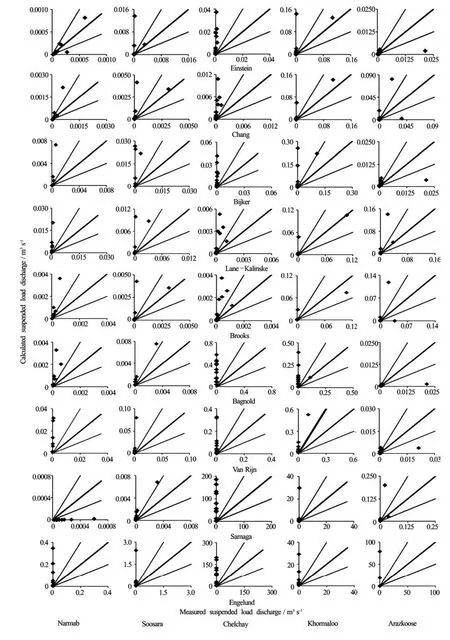
Fig.3 Comparisons between calculated and measured suspended load discharges (m3/s)
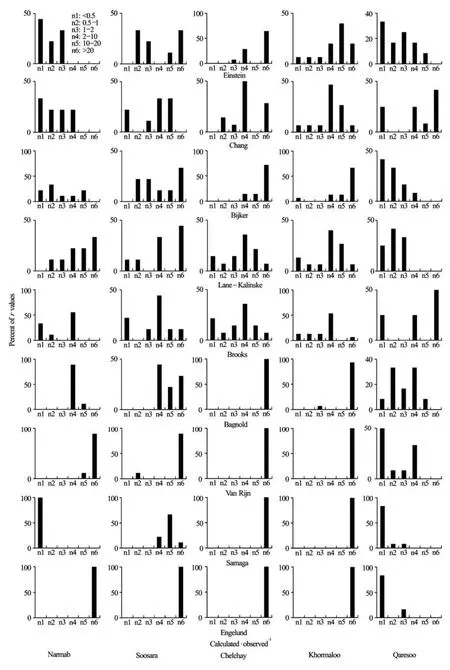
Fig.4 Distribution of Calculated/observed for all formulas and suspended load data
In 1984, Van Rijn proposed a comprehensive theory for the sediment transport rate in rivers byconsidering both fundamental physics and empirical observations and results. Suspended load is determined by integrating the product of the vertical concentration and velocity profiles, where the concentration profile is calculated in three layers. Different exponential or power functions were employed in these layers with empirical expressions that depend on the mixing characteristics in each layer[20].
The Lane-Kalinske (1941) equation requires an estimate of reference concentration, Ca, at a known elevation above the bed, a. This parameter was measured with a Helley-Smith bed load sampler while suspended load was measured with two types of depth integrating samplers. Suspended load and bed load samplers were operated simultaneously. This equation was verified with the help of data collected on the Mississipi River. Chang et al. (1965) assumed that Lane-Kalinske’s method is valid and rewrote it.
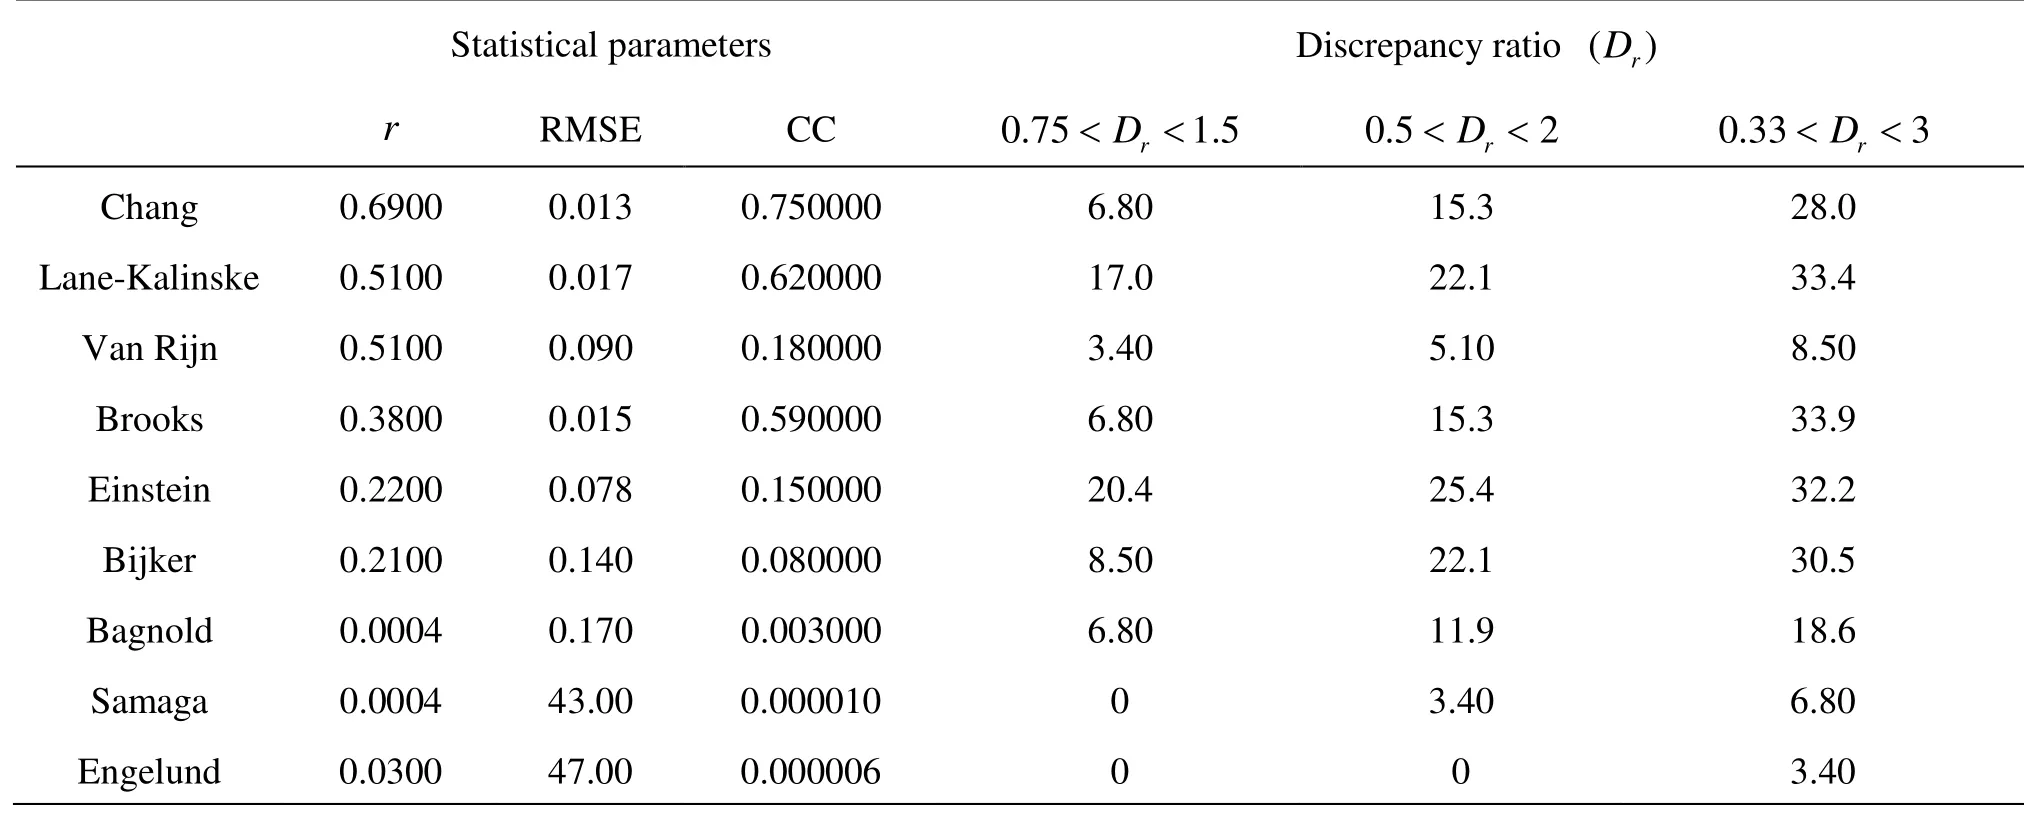
Table 4 Total ranking of suspended load formulas in terms of statistical parameters
Engelund (1970) found a relationship between unit suspended load discharge (qs)to water discharge (q)and shear velocity to fall velocity (ws)through analysis of laboratory data. However, Garde and Pande (1976) used field data and found these data to be in fair agreement with Engelund’s method.
2.2 Artificial neural network
Determining an appropriate architecture of a neural network for a particular problem is an important issue since the network topology directly affects its computational complexity and its generalization capability[10]. To overcome the complexity and uncertainty associated with suspended load prediction, the feed forward backpropagation network (BP), in which the external input information at the input nodes is propagated forward to compute the output information signal at the output unit using the Levenberg-Marquardt optimization technique, was written in MATLAB.
A tangent sigmoid function, which was widely used in sediment transport modeling[10,12,16,17], was chosen as neuron transfer function. Also, linear transfer functions at the output layer nodes were used.
2.3 Study site and data used
Our study site is located on the north eastern part of Iran in Golestan Province at the Chelchay Catchment (see Fig.1). Data collection was carried out on Narmab, Chelchay, Khormaloo, Soosara and Qaresoo Rivers at five hydrometrical stations, namely Jangaldeh, Lazoore, Node, Soosara and Qaresoo. The information about the changes of river bed in the cross section of all rivers during the period of operation were gathered and the comparison of cross sectional data during the time shows that there is not any deposition and erosion in the cross section of five hydrometrical stations and in results the conditions of five hydrometrical stations are in equilibrium. The Chelchay River is a steep mountain stream with a drainage area of 272 km2. The Khormaloo River is the longest stream in the Chelchay River Basin with a main channel length of 35 km and drainage area of about 886 km2, and converges with the Soosara River as the smallest stream with a main channel length of 9 km and a drainage area of about 40 km2. The Narmab River that originates from the connection of three tributaries is a mild stream with a basin area of about 197 km2. The Qaresoo River is located at the outlet of the catchment, and is the only sand bed river in the Chelchay Catchment (the rest of rivers are gravel bed rivers).
A special mode of suspended load, i.e., wash load, is shown in Fig.2. Wash load consists of cohesive and very fine sediments. To compare formulas with purified suspended load, wash load was excluded. There are different methods to exclude wash load from suspended load (further explanations were given in Ref.[21]). In this study the sieve number 270 (with opening size 53 µm) was used to separate wash load from suspended load (see Fig.2).
3. Discussion
3.1 Evaluation of suspended load formulas
It should be understood clearly that in our test, the hydraulic data applied to each formula describe section average conditions. Each of the formula has been examined in the light of all the available data and each was applied in precisely the manner that was specified by the original author.
3.2 Evaluation based on absolute values
Figure 3 presents the comparison between observed (i.e., measured with integrated suspended load samplers) and calculated data from all the 9 formulas in five studied rivers.
Equality between measured and calculated suspended load discharges are shown with thick lines (45oto thex -axis), whereas half and double values are shown with thin lines (60oand 30oto the x-axis, respectively).
The absence of grain size parameter in the Engelund equation leads to poor results in calculating suspended load discharge. One of the reasons that can lead to poor prediction of suspended load discharge, specially in gravel bed rivers, with the Van Rijn and Samaga methods was using critical shear stress parameter. Applying critical shear stress to compute suspended load discharge is not reasonable, because suspended loads are chiefly comprised of cohesive materials (Clay with particles smaller than 0.005 mm), and the incipient of motion conditions for cohesive material are more difficult to determine because it depends on clay mineralogy, water quality, and other chemical interactions.
3.3 Evaluation based on distribution of Drvalues
The pattern of the individual data is illustrated in Fig.4 on the basis of data distribution. Calculated to measured suspended load discharges, defined as discrepancy ratio (i.e.,Dr=Qscal./Qsmea.), are clustered into five groups with<0.5, 0.5-1, 1-2, 2-10, 10-20 and>20. The Engelund formula overestimates suspended load using gravel bed rivers data (the values of Drgreater than 20 are 100 percent), whereas underestimation occurs in sand bed river (the Qaresoo River). In the Lane-Kalinske formula, there are a number of datasets within the range of acceptableDrRatio (0.5 <Dr<2)in both gravel and sand bed rivers. This shows the ability of this equation to predict suspended load discharge in different hydrological and morphological situations.correlation coefficient(r), Root Mean Square Error (RMSE), Concordance Coefficient (CC) and three ranges of discrepancy ratio.

Table 5 Scenarios for ANN
3.4 Total ranking of suspended load formulas
The applicability of nine formulas to predict suspended load discharge in five rivers with different morphologic and hydrologic conditions was presented in earlier sections. In Table 4 the robustness of formulas to predict suspended load sediment in all different river conditions (59 datasets) is tabulated based on the
The Chang formula for suspended load with the correlationcoefficient r =0.69andthe concordancecoefficient (CC=0.75)closer to one and the RMSE closer to zero(RMSE=0.013)is the best method. Although based on discrepancy ratio Einstein is the best equation, but it shows the effect of each data set individually, not for all rivers and data sets. Following the Chang formula, the Lane-Kalinske, Van Rijn and Brooks formulas are the best suspended load predictors with an RMSE of 0.017, 0.09, and 0.015 and the correlation coefficient of 0.51, 0.51 and 0.38, respectively.

Table 6 Comparison of some ANN models for suspended load transport for the three scenarios
3.5 Application of ANN
Different forms of the ANN (i, j, l)and ANN (i, j, k, l)were applied to find the best model representing the suspended load transport, because there was not specific method to determine the network structure. isignifies the input layer which may change from four to six inputs,lis the output layer that represents suspended load, while jandksymbolize the hidden layers of which each has different neurons.
Six variables, including the velocity(U), the flow depth(D), the river bed slope(S), the median size of bed material sediments(d50-bm), the bed load (Qb)and the median size of suspended load sediments(d50-s)with three scenarios written in Table 5 were developed in building ANN models of suspended load transport(Qs): Various hidden layer node numbers for one hidden and two hidden layers were tested in all three scenarios, and the best performed hidden layer node numbers were decided by a trialand-error method (see Table 6).
However, in the selection of the most appropriate ANN structures, the RMSE had the priority in the decision making. But in general the values ofrwere in harmony with the RMSE values.
The networks in scenario 1 show relatively poor performances. The values of correlation coefficientr of ANN 6-5-1, ANN 6-12-1, ANN 6-2-2-1 and ANN 6-2-4-1 during the test period are 0.75, 0.74, 0.73, and 0.67, respectively. ANN 6-2-2-1 and ANN 6-2-4-1 with the lowest RMSE are identified as the best performing networks of this group.
In scenario 2, the performance of one hidden layer structures (i.e., ANN 5-6-1 and 5-18-1) are not as good as the performance of two hidden layers structures (i.e., ANN 5-2-1-1 and 5-1-3-1).
The performance of the networks in scenario 3 are improved, compared with those in scenarios 1 and 2. This is mainly due to remove parameters that do not have a close relationship with suspended load discharges.
The prosperity of scenario 3 can make more convenient riverine measurements to predict suspended load, because the input parameters of this scenario (i.e., velocity, flow depth, bed slope and median size of river bed) can be measured much easier than two additional parameters in scenarios 1 and 2 (i.e., bed load discharge and median size of suspended load).
Totally, an ANN 4-4-1 consists of 4 inputs, 4 hidden and one output neurons, and ANN 4-4-1-1 consists of 4 inputs, 4 and one hidden and one outputneurons provide the best simulation in all scenarios with the RMSE values of 0.0009 and 0.001, respectively.

Fig.5 Comparison of measured and predicted suspended sediment based on training and testing data

Fig.6 Comparison of dimensionles(φ)measured and computed results from best formulas and ANN models (left Figure) and their accuracy based onrand RMSE (right Table)
The comparison of the observed and predicted sediment load by the best performing ANN models based on lowest RMSE values of test data is shown in Fig.5, in the form of water-sediment graph and scatterplot (the former plotted as logarithmic for better representation). The scatter plot exhibits the deviations from the observed sediment values for the both testing and training period. The comparison of water-sediment graphs show that in low water discharges the ANN models are not able to predict sediment load very well. Especially, in ANN 4-4-1-1 (Fig.5(b)) and ANN 5-1-3-1 (Fig.5(c)) structures identical results occur for suspended sediments in all water discharges, except in peak sediment values.
In water-sediment graph, ANN 4-4-1 model (Fig.5(a)) closely follows the measured values. This is also confirmed by the scatterplots. The estimate of this model is closer to the exact fit line than those of another best performed ANN structures.
3.6 Comparing the results of ANN and suspended load formulas
Figure 6 shows the comparison between dimensionless measured suspended load (φs)and dimensionless computed results from the best performed suspended load formulas (Chang, Van Rijn, Lane-Kalinsk and Brooks) and ANN models (ANN 4-4-1 and ANN 4-4-1-1).
Most computated values from Van Rijn formula are distributed above the ideal line. This indicates the overprediction of this model in all the rivers. In addition, the results of Brooks, Lane-Kalinske and Chang formulas are highly scattered. In contrast, although ANN 4-4-1 estimates sediment load with a more stable trend than ANN 4-4-1-1, but both have closer points to the equality line, when compared with best physically based suspended load formulas. The correlation coefficient in ANN 4-4-1 and ANN 4-4-1-1 with 0.87 and 0.91, respectively, are significantly higher than the Chang formula that was the best suspended load predictor among the nine suspended load formulas with 0.69 (see Fig.6 right Table). Lower accuracy of sediment transport formulas than ANN models may originate from their limitations to predict wash load as a main part of suspended sediment. In natural streams, where measured suspended load is sampled, wash load is invariably present. Whereas, suspended load formulas are based on flume data in which wash load is absent. To increase the accuracy of comparison wash load was excluded from the suspended load measurements.
4. Conclusion
Finding a reliable and consistent method of computing suspended load discharge as the dominant mode of sediment transport within a river is the most important practical objective of this study. The predictive accuracy of the feed forward backpropagation ANN models to compute suspended load transport has been compared with some of the well-known suspended load formulas due to Einstein (1950), Bijker (1971), Brooks (1963), Samaga (1986), Van Rijn (1984), Lane-Kalinske (1941), Engelund (1970), Chang (1965) and Bagnold (1966). This study demonstrates that ANN models were able to successfully predict suspended load transport in a great variety of fluvial environments, including both sand-bed (e.g., the Qaresoo River) and gravel-bed rivers. The ANNmodel significantly outperforms traditional suspended load formulas and shows its superior performance for all statistical parameters. It can be concluded that suspended sediment transport is a complex process, and expressing it through a deterministic mathematical framework may not be possible.
[1] YANG C. T., Sediment transport theory and pra- ctice[M]. New York, USA: McGraw-Hill,1996.
[2] GARDE R. J., RANGA RAJU K. G. Mechanics of sediment transport[M], Delhi, India: New Age International, 2000.
[3] JULIEN P. Y. Erosion and sedimentation[M]. Cambridge, UK: Cambridge University Press, 2010.
[4] HABERSACK H. M., LARONNE J. B. Evaluation and improvement of bedload discharge formulas based on Helley-Smith sampling in an alpine gravel bed river[J]. Journal of Hydraulic Engineering, ASCE, 2002, 128(5): 484- 499.
[5] MARTIN Y. Evaluation of bed load transport formulae using field evidence from the Vedder River, British ColuMBIA[J]. Journal of Geomorphology, 2003, 53(1-2): 75-95.
[6]HADDADCHI Arman, OMID Mohammad H. and DEHGHANI Amir A. Assessment of bed-load predictors based on sampling in a gravel bed river[J]. Jour- nal of Hydrodynamics, 2012, 24(1): 145-151.
[7] MUNIR S. Role of sediment transport in operation and maintenance of supply and demand based irrigation canals[D]. Doctoral Thesis, Wageningen, The Netherlands: Wageningen University, 2011.
[8] KISI Ö. Multi-layer perceptrons with Levenberg-Marquardt training algorithm for suspended sediment concentration prediction and estimation / Prévision et estimation de la concentration en matières en suspension avec des perceptrons multi-couches et l’algorithme d’apprentissage de Levenberg-Marquardt[J]. Hydrolo- gical Sciences Journal, 2004, 49(6): 1025-1040.
[9] JAIN S. K. Development of integrated sediment rating curves using ANNs[J]. Journal of Hydraulic Enginee- ring, ASCE, 2001, 127(1): 30-37.
[10] CIGIZOGLU H. K. Estimation and forecasting of daily suspended sediment data by multi-layer perceptrons[J]. Advances in Water Resources, 2004, 27(2): 185-195.
[11] KISI O. Suspended sediment estimation using neurofuzzy and neural network approaches/Estimation des matières en suspension par des approches neurofloues et à base de réseau de neurones[J]. Hydrological Sciences Journal, 2005, 50(4): 696.
[12] ALP M., CIGIZOGLU H. K. Suspended sediment load simulation by two artificial neural network methods using hydrometeorological data[J]. Environmental Modelling and Amp, Software, 2007, 22(1): 2-13.
[13] ZHU Y.-M., LU X. X. and ZHOU Y. Suspended sediment flux modeling with artificial neural network: An example of the Longchuanjiang River in the Upper Yangtze Catchment, China[J]. Geomorphology, 2007, 84(1-2): 111-125.
[14] KAKAEI LAFDANI E., MOGHADDAM NIA A. and AHMADI A. Daily suspended sediment load prediction using artificial neural networks and support vector ma- chines[J]. Journal of Hydrology, 2013, 478: 50-62.
[15] YANG C. T., MARSOOLI R. and AALAMI M. T. Evaluation of total load sediment transport formulas using ANN[J]. International Journal of Sediment Re- search, 2009, 24(3): 274-286.
[16] SASAL M., KASHYAP S. and RENNIE C. D. et al. Artificial neural network for bedload estimation in alluvial rivers[J]. Journal of Hydraulic Research, 2009, 47(2): 223-232.
[17] BHATTACHARYA B., PRICE R. K. and SOLOMATINE D. P. Machine learning approach to modeling sediment transport[J]. Journal of Hydraulic Enginee- ring, ASCE, 2007, 133(4): 440-450.
[18] NAGY H., WATANABE K. and HIRANO M. Prediction of sediment load concentration in rivers using artificial neural network model[J]. Journal of Hydrau- lic Engineering, ASCE, 2002, 128(6): 588-595.
[19] WRIGHT S., PARKER G. Resistance and suspended load in aand-bed rivers[J]. Journal of Hydraulic Engi- neering, ASCE, 2004, 130(8): 796-805.
[20] BAYRAM A., LARSON M. and MILLER H. C. et al. Cross-shore distribution of long-shore sediment transport: Comparison between predictive formulas and field measurements[J]. Coastal Engineering, 2001, 44(2): 79-99.
[21] HADDADCHI A., OMID M. H. and SDEHGHANI A. A. Total load transport in gravel bed and sand bed rivers case study: Chelichay watershed[J]. International Journal of Sediment Research, 2013, 28(1): 46-57.
10.1016/S1001-6058(11)60385-6
* Biography: HADDADCHI Arman (1986-), Ph. D. Candidate Correspongidate author: OMID Mohammad Hossein,
E-mail: momid@ut.ac.ir

- 水动力学研究与进展 B辑的其它文章
- Application of signal processing techniques to the detection of tip vortex cavitation noise in marine propeller*
- Flow and heat transfer characteristics of falling water film on horizontal circular and non-circular cylinders*
- Numerical simulation of mechanical breakup of river ice-cover*
- The characteristics of secondary flows in compound channels with vegetated floodplains*
- Analysis and numerical study of a hybrid BGM-3DVAR data assimilation scheme using satellite radiance data for heavy rain forecasts*
- Numerical simulation of scouring funnel in front of bottom orifice*