
3-D simulation of transient flow patterns in a corridor-shaped air-cushion surge chamber based on computational fluid dynamics*
2013-06-01 12:29XIALinsheng夏林生CHENGYongguang程永光
水动力学研究与进展 B辑 2013年2期
关键词:大庆
XIA Lin-sheng (夏林生), CHENG Yong-guang (程永光)
State Key Laboratory of Water Resources and Hydropower Engineering Science, Wuhan University, Wuhan 430072, China, E-mail: xialinsheng_123@sina.com
ZHOU Da-qing (周大庆)
College of Energy and Electrical Engineering, Hohai University, Nanjing 211100, China
3-D simulation of transient flow patterns in a corridor-shaped air-cushion surge chamber based on computational fluid dynamics*
XIA Lin-sheng (夏林生), CHENG Yong-guang (程永光)
State Key Laboratory of Water Resources and Hydropower Engineering Science, Wuhan University, Wuhan 430072, China, E-mail: xialinsheng_123@sina.com
ZHOU Da-qing (周大庆)
College of Energy and Electrical Engineering, Hohai University, Nanjing 211100, China
(Received May 28, 2012, Revised September 29, 2012)
The 3-D characteristics of the water-air flow patterns in a corridor-shaped air-cushion surge chamber during hydraulic transients need to be considered in the shape optimization. To verify the reliability of the water-air two-phase model, namely, the volume of fluid model, the process of charging water into a closed air chamber is successfully simulated. Using the model, the 3-D flow characteristics under the load rejection and acceptance conditions within the air-cushion surge chamber of a specific hydropower station are studied. The free surface waves, the flow patterns, and the pressure changes during the surge wave process are analyzed in detail. The longitudinal flow of water in the long corridor-shaped surge chamber is similar to the open channel flow with respect to the wave propagation, reflection and superposition characteristics. The lumped parameters of the 3-D numerical simulation agree with the results of a 1-D calculation of hydraulic transients in the whole water conveying system, which validates the 3-D method. The 3-D flow structures obtained can be applied to the shape optimization of the chamber.
air-cushion surge chamber, hydraulic transients, Computational Fluid Dynamics (CFD), 3-D flow field
Introduction
In the 1970s, Norwegian experts Svee and Rathe[1,2]proposed the concept of the air-cushion surge chamber for hydropower stations. Because of its better performance in the water hammer protection and the surge wave control, and the economic and environmental adavantages, it has been used in many projects all over the world. An increasing number of high-head power stations with long tunnels have been and will be built in China, and the air-cushion surge chamber is often the preferred option. In air-cushion surge chambers for hydropower stations, the interior wall and the water surface are used to form a closed chamber, and the gas compression and expansion characteristics are used to relieve the water hammer pressure and to suppress the water level fluctuations, which ensures the safety of the power station during the transient process[3].
Generally, the stable cross section of an aircushion surge chamber for large or medium-sized hydropower stations is very large. Therefore, the chamber is usually made into a long corridor-shaped cavern, as is beneficial to the stability of an underground cavern. The cross-section is always in a“horseshoe” shape and the flat layout may take a corridor or cloister shape, according to the geological conditions and for the convenience of internal water level fluctuations[4,5].
A long corridor-shaped cavern involves significant longitudinal fluctuations in the body of water and complex fluctuations on the water surface. At present, the water level fluctuations in air-cushion surge chambers are studied mainly through 1-D numerical simulations and model tests. However, the 1-D simulations cannot accurately describe the interior water and gas flow patterns. The model tests have obvious limitations in having to select the scale to meet the requirement of the similarity criterions[6,7].
Currently, the Computational Fluid Dynamics (CFD) has become an important means for design verification and shows promise for replacing some physical model tests. Houde et al.[8]conducted 3-D CFD simulations of water flow during hydraulic transients in the tailrace surge chamber of a hydropower station. The results of free surface fluctuations are in good agreement with those of a model test. Deng et al.[9]simulated the flow in a long corridor-shaped surge tank using the 3-D Volume Of Fluid (VOF) method, analyzed the characteristics, clarified the causes of poor flow conditions, and proposed measures to eliminate the harmful air-entraining vertical vortices. These studies show that the CFD simulations are effective in the analysis of complex flow patterns in a surge chamber. In view of the complex flow characteristics in a long corridor-shaped air-cushion surge chamber and the limitations of both 1-D methods and model tests, 3-D simulations of hydraulic transients are necessary.
This paper starts from a two-phase model, namely, the VOF model of the CFD, and then resorts to the existing theory to verify the reliability and accuracy of the model[10-12], and finally carries out simulations and analyses of the transient flow in a corridorshaped air-cushion surge chamber.
1. Mathematical models and numerical methods
1.1 Governing equations
With consideration of the compressibility of air in a chamber, the continuity equation can be written as follows
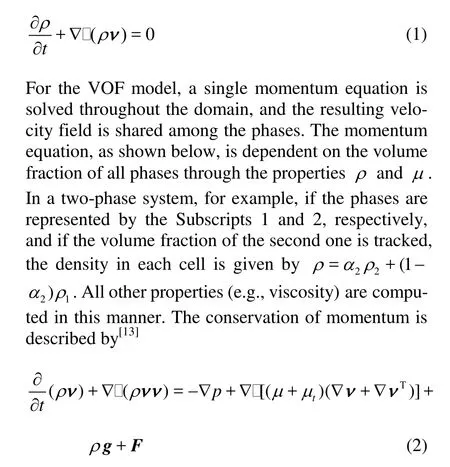
whereρis the density of fluid,µis the dynamic viscosity of fluid,µtis the turbulent eddy viscosity of fluid,pis the pressure,gis the gravitational acceleration andFis the body force.
The tracking of the interface(s)between phases is accomplished by solving the continuity equation for the volume fraction of each phase. For theqthphase, this equation takes the following form

in which m˙pqis the mass transfer from phase qto phasep,m˙pqis that from phase p to phase q, Sαqis the source term,αqis the volume fraction of the qthphase in a cell ranging between 0-1. The volume fraction is not solved for the primary phase (i.e., the air in this model), which can be calculated simply through∑αq=1.
1.2 Turbulence model
Based on a comparative analysis, our code adopts the realizablek-εmodel, which is an improvement on the standardk-εmodel and has been extensively validated for a wide range of flows, including the rotating homogeneous shear flows, the free flows with jets or mixed layers, the pipe flow and the separation flows. The modeled transport equations for kandεare
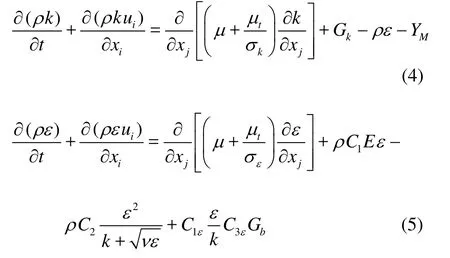
in which Gkis the generation of the turbulence kinetic energy due to the mean velocity gradients,Gbis the generation of the turbulence kinetic energy due to buoyancy (not considered in this problem),YMrepresents the contribution of the fluctuating dilatation in the compressible turbulence to the overall dissipation rate, andσkand σεare the turbulent Prandtl
numbers forkandε, respectively. The above specific coefficients may be found in Ref.[14].

in which p is the absolute pressure of the gas,Vis the gas volume andnis the polytropic exponent. To facilitate the comparison between the results of the CFD simulation and the 1-D calculation, the isothermal process is considered in the CFD simulations, thus n =1.
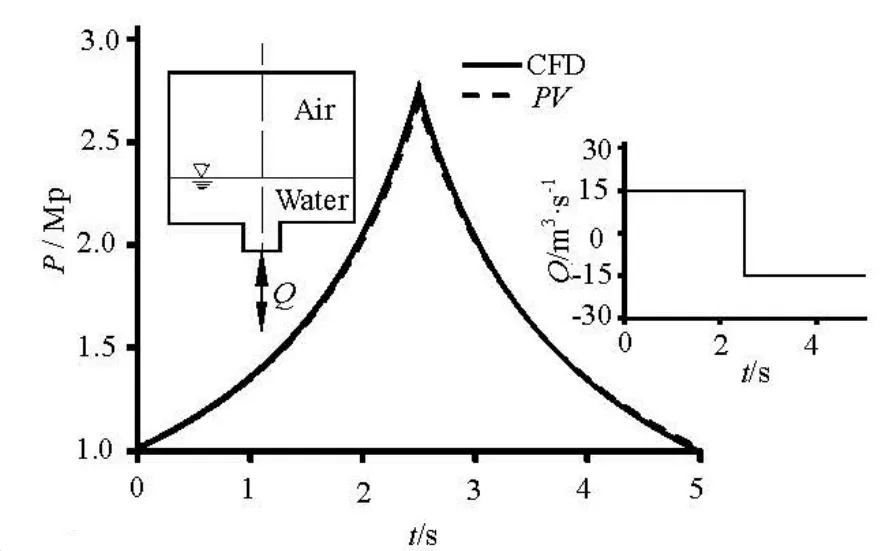
Fig.1 Pressure variation in the container

Fig.2 Schematic diagram of the simulation domain and boundary conditions
2. Validation of the VOF model
To verify the reliability and the accuracy of the VOF model, we consider the following problem: the water is pushed into a closed container and then is drawn out (see Fig.1), the container is initially filled with water in the lower part and gas in the upper part. This problem is simulated by giving the flow rate history. ThePV characteristics in the gas compression and expansion process are analyzed.3
The initial gas volume in the container is 80 m and the initial gas pressure is 1.0 MPa. Both the volum3e flow rates for filling and discharging are 20 m/s, and the durations are both 2.5 s. Figure 1 shows that the pressure variation simulated by the CFD agrees well with the theoretical value, with a maximum relative error of less than 1.95 %.
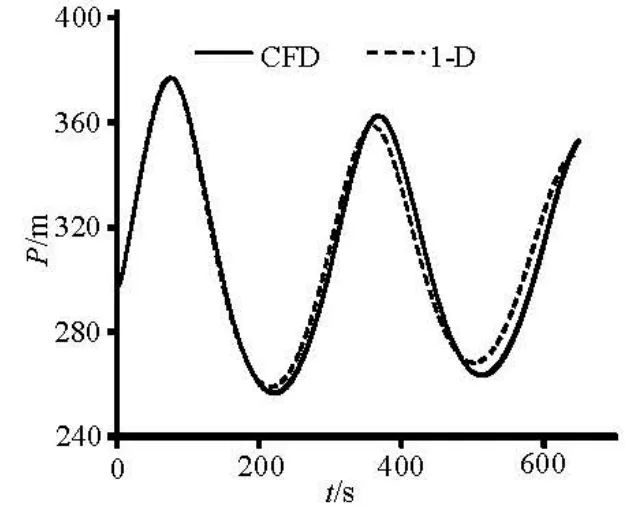
Fig.3 Air pressure variations in the surge chamber
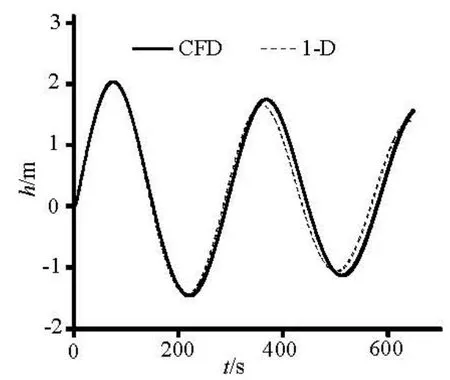
Fig.4 Average water level in the surge wave
3. Simulation and analysis of flow patterns in an air cushion surge chamber
3.1 Simulation objectives and conditions
The hydropower station involved in this simulation has 2 units, each of capacity of 67.5 MW. The water conveying system is composed of an upstream reservoir, a conveying tunnel, an air-cushion surge chamber, a connecting tunnel and a penstock, as shown in Fig.2. The water conveying tunnel is pressured, and is 11 168 m long with a circular cross-section of 4.8 m in inner diameter and a normal flow rate of 53.92 m3/s. The air-cushion chamber has a corridorshaped layout with the dimensions of 110 m×11 m×15.5 m (length×width×height). The bottom elevation is 2 090.0 m and the initial submerged depth is 5.0 m. The penstock is of 4.0 m in inner diameter, leading to a Y-shaped bifurcation, and two units are installed at the terminals of the branched pipes of 2.8 m in inner diameter.
In this paper, the 3-D-VOF model in the Fluent code is used to simulate the air-water flow in an aircushion surge chamber for the transient process in the hydropower station. The simulation domain shown in Fig.2 is divided into 1.63×10⁶unstructured non-uniform grids. To obtain typical transients, the load rejection and the load acceptance of the two units with an upstream water level of 2 391.0 m are simulated.
The boundary conditions shown in Fig.2 are defined as follows: (1) The Inlet is equivalent to the water entrance part of the reservoir. At the Inlet, the pressure outer boundary condition is used in the load rejection and the pressure inlet boundary condition is used in the load acceptance. (2) The Outlet is equivalent to the exits of the penstock. At the Outlet, a user defined function is imposed to control the discharge variation, which changes from 53.92 m3/s to 0 m3/s within 9 s during the load rejection and from 0 to 53.92 m3/s within 12 s during the load acceptance. (3) The remaining boundary conditions are imposed by the non-slip wall boundary using the wall-function.
For the pressure interpolation, the PRESTO! Scheme, as is highly recommended for a pressurebased solver, is used. For the transient flow in this paper, the PISO algorithm is chosen to obtain the coupling solution from the velocity and pressure equations. The Geo-Reconstruct scheme is enabled to capture the free surface. The results of the steady flow calculation are used as the initial flow field for the unsteady calculation.
3.2 Results and analyses
3.2.1 Load rejection condition
During the hydraulic transient process of the load rejection, the discharge in the penstock decreases gradually with the closing of the wicket gate, and finally the discharge comes to 0 when the wicket gate is closed. Due to the inertia, the water flows into the aircushion surge chamber, resulting in the rise of the indoor water level and the air being compressed with the increase of the pressure.

Fig.5 Indoor flow patterns at typical inflow and outflow rates
The air pressure obtained from the CFD simulations is the average pressure at the top of the aircushion surge chamber, and the average water level variation of the surge wave is obtained from the conversion of the air volume change. Figures 3 and 4 show the comparisons of the air pressure and thewater level between the CFD simulation and the 1-D analytical mode calculation. The comparison of the results shows good agreement: the maximum pressure Pmax=374.8 m happens at T=78.58 s in the 1-D calculation, whilePmax=377.3 m at T=74.78 s in the CFD simulation, with the relative errors of 0.5% and 4.8%, respectively. The minimum pressurePmin= 262.1 m happens at T=217.3 s in the 1-D calculation, whilePmin=256.6 m at T=222.3 s in the CFD simulation, with the relative errors of 2.1% and 2.3%. The lumped parameters for the CFD simulation agree with the results of the 1-D calculation, which validates the 3-D-VOF method. As shown in Figs.3 and 4, the pressure and water level fluctuation curves are similar to an attenuated sine wave, with steep peaks and gentle troughs.
The results of the CFD simulation not only are in good agreement with the 1-D calculation with respect to the pressure and the average water level variations, but also give a well defined longitudinal water flow and the wave fluctuations, similar to the open channel flow with the wave propagation, reflection, and superposition characteristics.
(1) Characteristics of the open channel wave
Within the first half cycle, the feature of the wave propagation in the open channel is distinct. A free surface bore, namely, a positive open channel surge wave, is formed because the water quickly fills the surge chamber after the load rejection, and the wave propagates to the tail end of the surge chamber. Behind the bore, the water depth at a particular location increases gradually. After the surge wave has reached the tail end and with the positive reflection, the propagation direction changes from the flow forward to the flow backward, resulting in a large clockwise vortex. These phenomena are demonstrated in Figs.5(a)-5(d).
When the indoor water flows out, a negative open channel wave is formed at the entrance of the chamber and propagates to the tail end. Figs.5(f)-5(h) show the process of the wave confrontation, superposition and staggering with a positive and a negative wave. Two waves change the water level at the same time, as the positive surge wave contributes to the rise in the water level while the negative wave contributes to the fall.
Before the inflow rate turns negative, there is only one type of surge wave in the chamber, namely, the positive surge wave, resulting in the location variation of the maximum water level according to the following sequence: Section 1→Section 2→Section 3→ Section 2→Section 1. Subsequently, this phenomenon disappears because of the wave superposition.
(2) Influence of Froude number on the wave superposition
After the water outflow rate of the surge chamber comes to zero, the water flows into it again. Because the indoor water level is low and the velocity increases faster than the rise in the water level, the Froude number is now larger than that under the inflow condition of the first half cycle, resulting in an undulating hydraulic jump in the surge chamber. After these complex waves reach the tail wall and are reflected from it, the waves in the reverse direction are superimposed with the forward waves, making the air-water surface fluctuate violently, as seen in Figs.5(i)-5(k). The large velocity gradients at the gas-liquid interface cause the instability of the water surface, which intensifies the fluctuations of the waves. As shown in Fig.6, the water surface finally breaks down due to all the above reasons, resulting in the entrapment of air when the Froude number is sufficiently large. The entrapped air gradually escapes in the subsequent propagation of the surge waves. In practice, this entrapped gas water waves will lead to the dissolving of that part of the gas in water, which increases the amount of gas loss. When the water level rises to a certain height in the surge chamber, the Froude number decreases to less than 1, with the flow regime being turned into a subcritical flow state, and therefore, the water surface becomes placid with less fluctuations. This phenomenon can be seen in Figs.5(k)-5(l).

Fig.6 Water surface breakdown with entrapped air
During the transient process, there are obvious secondary flows. The propagation and the reflection of the surge waves cause the inconsistency of the water flow directions at different heights, resulting in large vortexes, as shown in Figs.5(c) and 5(g). When the water flows into the surge chamber, there are two approximately vertical vortexes rotating in opposite directions at both sides of the surge chamber entrance. The oblique angle and direction of the vortexes change with the variation of the water level and the fluctuation of the surge waves. Comparing Fig.5(j) with Fig.5(l), at about the same water inflow rate, the one with a higher water level has vortexes with larger oblique angle, namely, closer to the horizontal direction.
During the water outflow in the period from about 166 s to 180 s, because the velocity of the indoor water is large enough and the water depth is relatively low, the Froude number is sufficiently large, resulting in two pairs of vertical vortexes rotating in opposite directions, as shown in Fig.7. With further decrease of the outflow velocity and the water depth, the vertical vortexes disappear gradually.
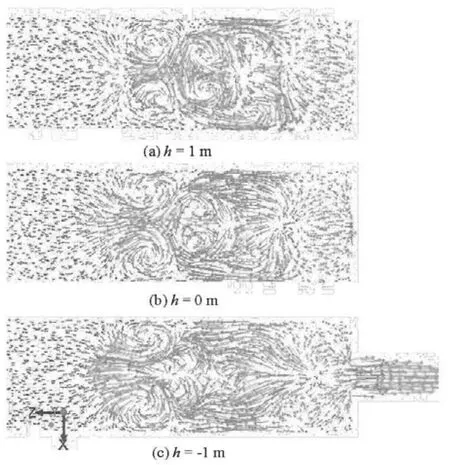
Fig.7 Outflow pattern near the entrance of different heights at 170 s
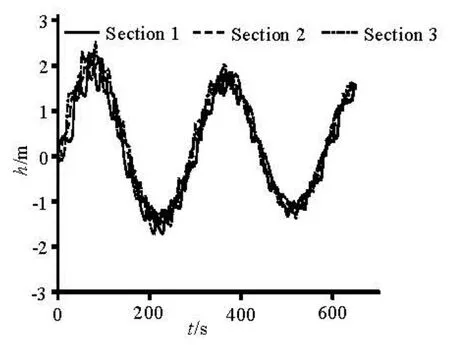
Fig.8 Water levels on the three monitoring sections
Figure 8 and the above analysis show that the open channel wave is superimposed on the mass fluctuation wave. In the air-cushion surge chamber, the water level fluctuating trends on each longitudinal section are in overall consistent with the average surge water level fluctuation predications given by the 1-D calculation. Because of the longitudinal water flow and wave fluctuations, on different longitudinal sections we have different surge water levels. At some time, the maximum difference in the water level in the longitudinal section is nearly 1.0 m. The highest local water level of the CFD simulation is larger than the result from the 1-D calculation and the lowest local water level is lower than the result of the 1-D calculation, both with a difference of about 0.4 m. The results of the CFD simulation show that the moments when the local actual highest and lowest water levels occur are not necessarily the moments for the maximum and minimum indoor air pressures. As shown in Fig.8, the highest and lowest surge water levels both occur at the tail end of the surge chamber.
In the air-cushion surge chamber, the water surface has a distinct lateral flow because of the unsymmetrical distribution of the vorticity on the horizontal plane of the upper water, resulting sometimes in an S-shaped water flow trajectory with secondary flows on the water surface, as can be seen in Fig.9. This phenomenon might be a Kelvin-Helmhotz type instability. Because of the interaction between the airflow and the water surface flow, the water surface velocity reaches the minimum about 25 s to 40 s after the water inflow rate comes to zero, while in the outflow, the maximum water surface velocity occurs about 25 s to 40 s after the water outflow rate reaches the maximum, as shown in Figs.9(b)-9(e).
3.2.2 Load acceptance condition
In the case of a sudden increase in load, the aircushion surge chamber quickly supplies the additional water required, and the water in the tunnel then flows back into the chamber due to the differential water head, resulting in the air expanding with the decrease of the air pressure and later the air being compressed with the increase of the air pressure.
Figure 10 shows the comparison of the air pressure variation curves between the CFD simulation and the 1-D calculation for the acceptance condition. The results from the two methods are in good agreement before 204 s, and then the relative error gradually becomes larger. The minimum pressure Pmin= 251.30 m occurs at T=86.1 s for the 1-D calculation whilePmin=253.71 m at T=82.39 s for the CFD simulation, with the relative errors of 0.95% and 4.31%, respectively. The maximum pressurePmax= 350.10 m occurs at T=238.35 s for the 1-D calculation whilePmin=341.50 m at T=229.68 s for the CFD simulation, with the relative errors of 2.46% and 3.65%, respectively.
During the transient process of the load acceptance, in the initial 50 s, the negative open channel waves propagate in the following sequence: Section 1→Section 2→Section 3→Section 2→Section 1, within about one cycle of the waves. When the outflow rate is relatively small, the water level in the front-end of the air-cushion chamber has a slight rise due to the backwater until the positive waves of the inflow propagate towards the tail end. At some time, the maximum difference of the water level in thelongitudinal section is also nearly 1.0 m. Both the highest and lowest local surge water levels occur close to the tail end, with the amplitude of the positive fluctuation being lower than the amplitude in the load rejection condition while the amplitude of the negative fluctuation being higher. The moment when the local surge water level is the lowest is earlier than the moment when the air pressure is the minimum in the air-cushion surge chamber. These are evidently seen in Fig.11.

Fig.9 Velocity vectors of the air-water interface

Fig.10 Air pressure variations in the surge chamber

Fig.11 Water levels on the three monitoring sections
The intensity of the fluctuations in the load acceptance condition is lower than that in the load rejection condition. As shown in Fig.12, after the water level reaches a minimum value, the water reflows into the surge chamber and the waves are placid with less fluctuations in the initial period, because of the relatively small number of indoor open channel waves and the low water velocity in the chamber. With timeprogresses, the surface fluctuations become complex as a result of the reflection and the superposition of the open channel waves. Because the water level is relatively high and the Froude number is small, the amplitude of the wave fluctuations is smaller than the transients in the load rejection condition, with no distinct water surface breakdown with air entrapment.

Fig.12 Indoor flow patterns at typical inflow and outflow rates
4. Conclusions
The transients for two typical operation conditions are simulated and analyzed in this paper using a 3-D-VOF model. From the results, the following conclusions are drawn:
(1) The 3-D-VOF model is a feasible method for simulating the transients in an air-cushion surge chamber, especially in the long corridor-shaped aircushion surge chamber. The transients can be shown with clear physical meanings and an acceptable numerical accuracy. In particular, it can serve as an effective supplement for model tests and 1-D calculations. The obtained 3-D flow structures may be applied to optimize the shape of the chamber.
(2) The wave fluctuations in a long corridorshaped air-cushion surge chamber have the characteristics of the mass fluctuation and the open channel waves, with the open channel waves superimposed on the mass fluctuation waves. The longitudinal flow shows obvious features of propagation, reflection and superposition of multiple waves, which leads to complex water surface fluctuations.
(3) The Froude number has a clear influence on the fluctuations of the open channel waves. A large Froude number even results in the water surface breaking down with air entrapment. Under the load acceptance condition, more placid waves are seen than under the load rejection condition.
(4) The simulations do not adequately consider the thermodynamic properties of the air in transients. The influence of the thermodynamic properties on the wave fluctuations requires further study. Further validation of the VOF model by physical model tests is also required.
[1] SVEE R. Surge chamber with an enclosed compressed air cushion[C]. Proceeding of the First International Conference on Pressure Surges. Canterbury, New Zealand, 1972, 9: 15-24.
[2] ZHANG Jian, SUO Li-sheng and ZHENG Yuan et al. Study on gas characters of air-cushioned surge tank[J]. Journal of Hydroelectric Engineering, 2003, 23(4): 97-101(in Chinese).
[3] HU Jian-yong, ZHANG Jian and WANG Hui-qing. Review of application research on air cushion surge chamber in hydropower plant[J]. Water Resources and Power, 2007, 25(3): 60-63(in Chinese).
[4] LIU Qi-zhao, HU Ming. Hydropower station[M]. 4th Edition, Beijing, China: China Water Power Press, 2010(in Chinese).
[5] ZHANG Xiao-hong. Calculable research on fluid transients of air cushion surge chambe [D]. Doctoral Thesis, Xi’an, China: Xi’an University of Science and Technology, 2007(in Chinese).
[6] WU Shi-qiang, HU Qi-lie. Discussion on simulation of transient in air cushion surge chmaber[J]. Journal of Hydraulic Engineering, 2000, (7): 26-32(in Chinese). [7] HU Qu-lie, WU Shi-qiang. Modeling law and tests of pressure reduction for air-chshion pressure-regulating chambers[J]. Journal of Hydrodynamics, 2002, 17(5):611-616.
[8] HOUDE S., PAGEÉRIC M. and MAINVILL E. Numerical investigation of the dynamic behavior of surge chamber under normal operating conditions[C]. 2nd IAHR International Meeting of the Work Group on Cavitation and Dynamic Problems in Hydraulic Machinery and Systems. Timisoara, Romania, 2007, 10: 24-6.
[9] DENG Song-yi, ZHANG Jian and CHENG Yong-guang et al. Flow characteristics of long corridor-shaped surge tank and elimination of the air-entraining vertical vortices: CFD simulation and analysis[J]. Journal of Hydroelectric Engineering, 2009, 28(4): 130-136(in Chinese).
[10] HU J., ZHANG J. and SUO L. et al. Study on operation characters of air cushion surge chamber[C]. 5th Joint ASME/JSME Fluids Engineering Conference. California, USA, 2007.
[11] CHENG Yong-guang, LI Jin-ping and YANG Jian-dong. Free surface-pressurized flow in ceiling-sloping tailrace tunnel of hydropower plant: simulation by VOF model[J]. Journal of Hydraulic Research, 2007, 45(1): 88-99.
[12]ZHAO Zhen-xing, HE Jian-jing. Hydraulics[M]. Beijing, China: Tsinghua University Press, 2007(in Chinese).
[13] LIU X., GARCÍA M. Three-dimensional numerical model with free water surface and mesh deformation for local sediment scour[J]. Journal of Waterway, Port, Coastal, and Ocean Engineering, 2008, 134(4): 203- 217.
[14] SHIH T. H., LIOU W. W. and SHABBIR A. et al. A newk-εeddy-viscosity model for high Reynolds number turbulent flows-model development and valida- tion[J]. Computers and Fluids, 1995, 24(3): 227-38.
[15] NIE Yue-guang. Discussion of the real gas equation of state[J]. North Sichuan Institute of Education, 1987, (8): 20-26(in Chinese).
10.1016/S1001-6058(13)60360-1
* Project support by the National Natural Science Foundation of China (Grant Nos. 51039005, 50909076).
Biography: XIA Lin-sheng (1988-), Male, Master
CHENG Yong-guang,
E-mail: ygcheng@whu.edu.cn
猜你喜欢
西部学刊(2023年3期)2023-02-28
中国石油石化(2021年9期)2021-07-17
青年文学家(2020年28期)2020-11-02
传媒评论(2019年12期)2019-08-24
——高大庆作品欣赏
陶瓷科学与艺术(2018年12期)2018-02-19
艺术家(2017年2期)2017-11-26
兰台世界(2017年13期)2017-08-08
知与行(2017年3期)2017-03-30
大庆社会科学(2015年3期)2015-11-28
大庆社会科学(2015年1期)2015-11-28

- 水动力学研究与进展 B辑的其它文章
- Hydrodynamic modeling of cochlea and numerical simulation for cochlear traveling wave with consideration of fluid-structure interaction*
- Orientation of the fiber suspending in the flow through a tube containing a sphere*
- Numerical analysis of vortex core phenomenon during draining from cylinder tank for various initial swirling speeds and various tank and drain port sizes*
- Radiation and diffraction analysis of a cylindrical body with a moon pool*
- Heat transfer characteristics in micro-fin tube equipped with double twisted tapes: Effect of twisted tape and micro-fin tube arrangements*
- Stochastic simulation of fluid flow in porous media by the complex variable expression method*