
Observation of the induced pressure in a hybrid micro/nano-channel*
2013-06-01 12:29KONGGaopan孔高攀ZHENGXu郑旭SILBERLIZhanhua李战华
水动力学研究与进展 B辑 2013年2期
KONG Gao-pan (孔高攀), ZHENG Xu (郑旭), SILBER-LI Zhan-hua (李战华)
The State Key Laboratory of Nonlinear Mechanics, Institute of Mechanics, Chinese Academy of Sciences, Beijing 100190, China, E-mail: kun88d@gmail.com
XU Zheng (徐征)
Key Laboratory for Micro/Nano Technology and System of Liaoning Province, Dalian University of Technology, 116024 Dalian, China
Observation of the induced pressure in a hybrid micro/nano-channel*
KONG Gao-pan (孔高攀), ZHENG Xu (郑旭), SILBER-LI Zhan-hua (李战华)
The State Key Laboratory of Nonlinear Mechanics, Institute of Mechanics, Chinese Academy of Sciences, Beijing 100190, China, E-mail: kun88d@gmail.com
XU Zheng (徐征)
Key Laboratory for Micro/Nano Technology and System of Liaoning Province, Dalian University of Technology, 116024 Dalian, China
(Received June 24, 2012, Revised September 29, 2012)
This paper studies the flow characteristics in micro/nano-channels subjected to an applied electric field. The nano-channel flow was observed by means of the fluorescence Calcein. A Fluorescence Concentration Gradient Interface (FCGI) was observed across the nano-channel array. The front of the FCGI was shown to have an analogous parabolic shape. The propagation of this interface reflects indirectly the induced pressure at the micro/nano-channel junction, where the enrichment-depletion processes are known to take place. This induced pressure was predicted by numerical simulations, and this paper gives the first experimental evidence.
micro/nano-channel, induced pressure, ion enrichment/depletion
Introduction
With the rapid development of the micro- and nano-fabrication technology, many nano-fluidic devices were developed with wide applications in laboratories. It is noted that when the characteristic length of the microfluidics channels is reduced to the same order as the Debye length, the ion selection process becomes more efficient due to the overlapping Electric Double Layers (EDL). One kind of these devices, a hybrid micro/nano-channel, was used to improve the trace element detection and its sensitivity. Wang et al.[1]and Kim et al.[2]observed the protein concentration enrichment (of up to a factor of 106) with this kind of system. Recently, Kim et al.[3]developed a new and efficient device for the direct seawater desalination. The physical mechanism of these devices is as follows.
Basically, the velocity profile of the electro-kinetic flow driven only by an applied electric potential should be shaped as a “plug”. But, Kim et al.[4]observed fast moving vortices in the depletion zone at the positively charged end of the nano-channel array in their hybrid micro/nano-channel chip. They noticed that the front of the depletion zone in the microchannel was like “meniscus” as driven by pressure. This parabolic concentration front in the microchannel was also observed and studied by Yu and Silber-Li[5]. These experimental results indicate that there is an induced pressure in the pure electro-kinetic flow. Jin et al.[6]presented a numerical model based on the Navier-Stokes equation and the Nernst-Planck equation to simulate the flow in a hybrid micro/nano-channel and found that an induced pressure did exist across the micro/nano-channel junction. The associated vortex flow and the induced pressure in the micro/ nano-channel junction were studied by several authors[7-9]. The vortex flows were visualized experimentally, but without the induced pressure distribution being observed in the nanochannel. It is extremely difficult to directly measure the induced pressure distribution in the micro/nano-channel. The present study focuses on the direct observation of this induced pre-ssure field, especially, in the nano-channel.
The propagation of the fluorescence in an array of nano-channels was observed in the present experiments. The observation results, as shown in Section 2, indicate that the propagation lengths in each channel of the nano array are different and an analogous parabolic front is established across the entire array. It is demonstrated that the induced pressure distribution at the micro/nano-channel junction drives the fluorescence propagation passing through the nanoarray. In Section 3, two hypotheses are proposed for analyzing the induced pressure based on the Navier-Stokes (N-S) equation and the Nernst-Planck equation, accompanying with the results of a transient 2-D numerical simulation. The last section is the conclusion.
1. Experimental apparatus and methods
1.1 Experimental setup
The experiments were performed on a fluorescent inverted microscope (Olympus IX71), equipped with a 10×/NA=0.3objective lens. An electronmultiplying charge coupling device (EMCCD, DV885) was used to record the images. A voltage source (HV1005) was used to apply the electric potential.
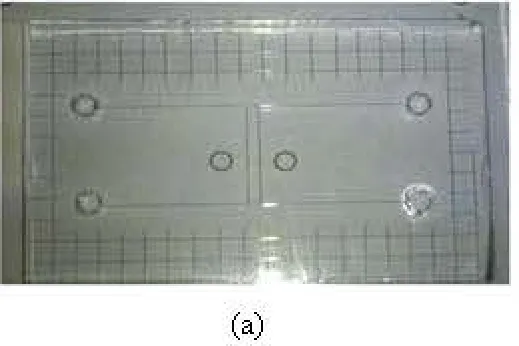
Fig.1(a) A photo of the glass chip
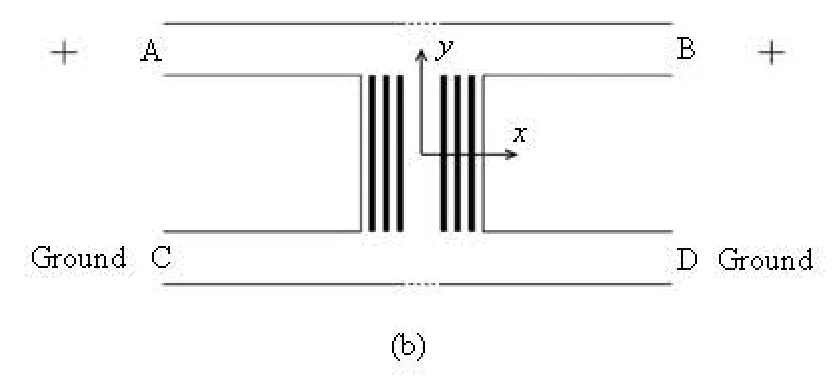
Fig.1(b) Schematic diagram of the microchannel with a nanochannel array
1.2 Chip fabrication
A glass chip employed in the present experiment is shown in Fig.1(a). A schematic diagram of the nano-channel array connected with two micro-channel reservoirs is shown in Fig.1(b), where A-B and C-D are marked. The nominal size of the micro-channel is 40 µm×10 µm×0.02 m and that of each nano-channel is 4 µm×100 nm×200 µm (width×depth×length). The nano-channel bundle consists of 20 channels placed side by side in a linear array with a total width of 120 µm. The entire glass chip is produced by the Dalian University of Technology. (see Xu et al.[10]for details).
1.3 Reagents
The sodium borate buffer solution was prepared by using Di-water (Millipore company) at a concentration of 0.1 mM and a pH value of 9.2.
Two portions of this fluid were prepared. The fluorescence Calcein (an analytical reagent) was diluted into one portion of this solution at a mass concentration of 10 µM and filled into the A-B micro-channel at the beginning of the experiment. The other portion was filled into the C-D micro-channel. Compared with other experiments[4], in which both microchannels were filled with the fluorescence, in our experiment, only one micro-channel is filled with the fluorescence so that the state of the flow passing through the nano-channel array can be observed.
1.4 Experimenl procedure
At the beginning of the experiment, one portion of the sodium borate buffer solution with the fluorescence was filled into the upper micro-channel (A-B) and another portion of the sodium borate buffer solution without the fluorescence was filled into the bottom micro-channel (C-D). Platinum wires were then put into the reservoirs to provide the electric connection. A potential difference was then applied between A-B and C-D micro-channels (see Fig.1(b)) while C-D ends were grounded. The flow fields in the two micro-channels and in the array of nano-channels were observed with the EMCCD at 21 frames/s. The images were captured in sequence with an exposure time of 20 ms and an interval of 27 ms.
The main experiment was conducted as described above with 50 V potential drop across the two microchannels. Also, we used the potential drops of 100 V, 300 V, 500 V and a reduced buffer concentration of 0.01 mM in the tests.
2. Experimental results
The results of the present experiments are as follows. After an electric potential was applied to the micro-channel A-B, a depletion zone was observed to form in the A-B micro-channel (that is, at the anode of the nano-channel array) at t =1.24 s (Fig.2(a)). At t=3.91 s, the depletion zone continued to extend, while the enrichment zone developing in the C-D micro-channel (the cathode end of the nano-channel array) as shown in Fig.2(b). At this instant, a Fluorescence Concentration Gradient Interface (FCGI) appeared in the nanochannel array. Att=7.03 s, it was observed that the fluorescence solution was propagating in each nano-channels of the array from the A-B micro-channel towards the C-D micro-channel.The position of the FCGI assumes an analogous parabolic form (as shown in Fig.2(c)). At t=14.86 s, the position of FCGI was near the bottom micro-channel. In addition, the gray scale values of the fluorescence in the nano-channel were always less than those in the depletion area. While in the enrichment area (that is, at the C-D channel end of the nano-channel array), the fluorescent gray values increased with time.

Fig.2 The FCGI evolution in the nanno-channel array with a depth of 100 nm (the image size is 800 µm ×400 µm)
The front positions of the FCGI in each nanochannel at different moments are shown in Fig.3. They assume an analogous parabolic shape. The average propagating velocity of the FCGI calculated from Fig.3 is shown in Fig.4. The velocity in the center of the nano-channel array is found always higher than the velocities at the edges. For example at t =3.91 s the maximum velocity,vmax, is about 20 µm/s while the velocities at the edges are only in the range of 0 µm/s-5 µm/s. With the time, the maximum velocity decreases. Att =7.03 s,vmax=15 µm/s, and the corresponding velocity values at the edges of the nano-channel array are about 6 µm/s. Att=14.86 s the maximum velocity is reduced to 9 µm/s while the edge velocities are kept on the level of 5 µm/s . The velocity results indicate that the propagation of fluorescence is faster in the middle part than at the edges, however, this propagation becomes much slower as time progresses.
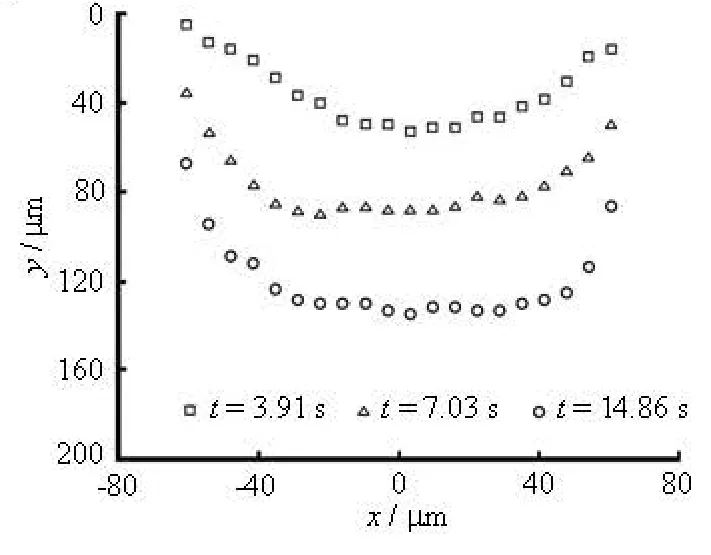
Fig.3 The positions of FCGI’s front at different time corresponding to Figs.2(b)-2(d). The location of xaxis is at the middle of the nano-channel array
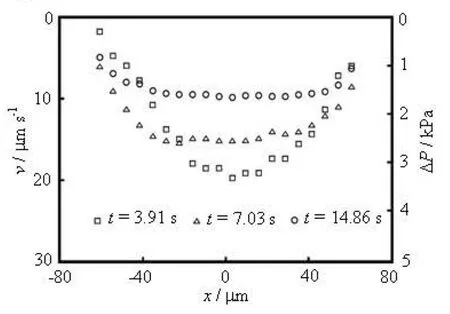
Fig.4 The average velocity of the propagating FCGI and the estimated pressure at different moments
According to the well known Poiseuille formula, the velocity in a channel is proportional to the pressure drop, which can be used to estimate the pressure drop across the nano-channel. The hypothesis involved in the Poiseuille formula will be discussed in Section 3. The Poiseuille formula takes the form
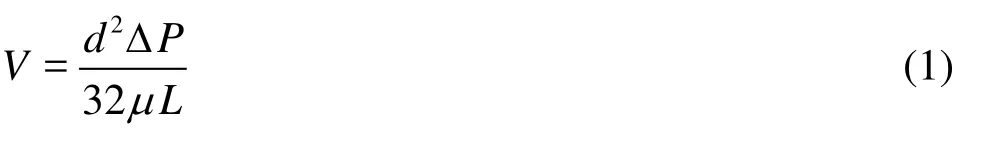
whereV represents the average velocity of the solutions in the nano-channel, andd is the hydraulicdiameter of the nano-channel. The nano-channel length isL while ΔPdenotes the pressure drop between the two ends of the nano-channel. UsingV, as shown in Fig.4, we can calculate ΔPand display it in the same figure. Att=3.91 s, the pressure in the center of the nano-channel arrayΔPmaxis about 3 500 Pa. After 3 s, at t =7.03 s,ΔPmaxdecreases to 2 500 Pa. And att =14.86 s,ΔPmaxis further reduced to about 1 500 Pa. From Fig.4, it is seen that the center of the experimentalΔPmaxis three times higher than the pressure at the edges (which remains at the level of about 1000Pa in the experiment). These estimates provide qualitative information about the pressure distribution along the axis of the micro-channel near the micro/nano junction.
3. Discussions
(1) Ion transportation
Figures. 2(a)-2(d) show that the FCGI is formed as the depletion region is developed at the micro/ nano-channel junction, and extended along the microchannel. The flux of the ions in the nano array is determined from the Nernst-Planck equation

(2) Bulk fluid transportation
The fluid flow is governed by the N-S equation. In the micro/nano-scale, the Reynolds number is low enough, the N-S equation can be simplified as the Stokes equation
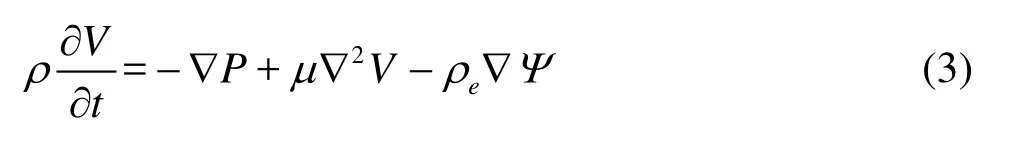
where ρe∇Ψdenotes the electrostatic body force term,ρe=F( z+c++ z-c-)is the net charge density of ions,µdenotes the dynamic viscosity of the fluid, µ∇2Vrepresents the viscous term. It is clear that the velocity of the fluid is influenced by the pressure, the electrical field and the viscosity. As stated above, the electro-migrationVeis nearly the same in each nanochannel, and has little contribution to the parabolicvelocity distribution in the nano array. Therefore, the second hypothesis proposed here is that the pressure gradient term,ΔP, plays the dominant role in the formation of the analogous parabolic FCGI.
The estimated pressure is not quite accurate due to the fact that the average velocity value is obtained from experiments, with the effects of the ion diffusion and the electric potential being neglected as just noted. However, these results represent the experimental evidence of the pressure distribution in the micro/nanochannel flows, which has not been noted before. This observation provides some further basic information to understand these complex flows.
A basic numerical model is tested by a simple verification. It can not fully simulate all the experimental details, but it can help us catch the mechanism in the system.
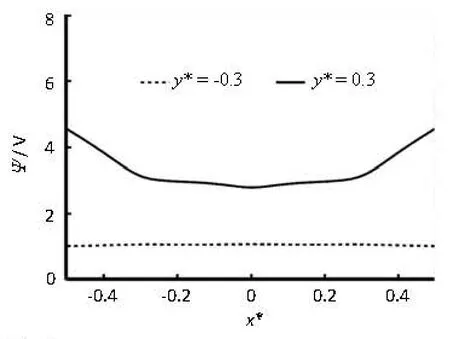
Fig.5 The calculated pressure distribution along x∗axis of the micro-channel in the micro/nano-channel junction. The inset is the computation area of the numerical study, both x and y are normalized by the width of micro-channel

Fig.6 The potential distribution along the x∗axis of the microchannel near the micro/nano-channel junction. Bothx and yare normalized by the width of micro-channel
In the numerical simulation, three nano-channels are arranged at x∗=-0.3, 0 and 0.3, respectively, to represent the nano array (see the inset graph in Fig.5). Their inlets are all located aty∗=0.3, and the outlets are aty∗= -0.3. The junction of the micro/nanochannel is thus betweenx∗= ±0.3. Figure 6 shows the computed electrical potential distribution along the x∗axis of the micro-channel. The curve of voltages is found to be approximately flat fromx∗= -0.3to x∗=0.3, corresponding to the inlet of the nano-channel array aty∗=0.3. This result confirms the above hypotheses that the∇Ψis nearly constant along x direction. Hence the electric field could not induce the analogous parabolic FCGI observed in the experiments (see Fig.2(a)-2(d)).
Figure 5 shows the pressures along thex∗direction of the micro-channel near the micro/nano-channel junction. The pressure distribution in the depletion zone near the junction between x∗= ±0.3at y∗=0.3is in an analogous parabola profile (solid line), and in the enrichment zone aty∗= -0.3it is nearly linear (dotted line). This result is in accordance with the experimental pressure distribution discussed above.
These simulations confirm the existence of an induced pressure distribution in the micro/nano-channel junction and this pressure field is responsible for the formation of an analogous parabolic FCGI in the nano-channel array observed in the experiments.
4. Conclusions
In this study, the propagation of the fluorescence concentration in a hybrid micro/nano-channel under external electric field was observed. The main results can be summarized as follows:
(1) A FCGI was observed across the nano-channel array (20 nano-channels, each of 4 µm×100 nm× 200 µm (width×depth×length). The FCGI front was shown to have an analogous parabolic shape. The average propagation velocity distributions were obtained from images at different moments.
(2) Based on the Nernst-Planck equation, it is shown that the ion diffusion effect can be neglected as compared with the effects of the electromigration and the fluid convection. Two hypotheses are introduced: (a) the electric potential is uniform and thus the potential gradient can be considered as constant in the junction, and (b) in the N-S equation, only the pressure gradient is responsible for this FCGI. Based on these two hypotheses, the distribution of the induced pressure at the micro/nano junction is evaluated.
(3) A basic 2-D numerical model was used to simulate the flow in a hybrid micro-channel with nano array composed of three nano-channels. The numerical results show the similar distribution of the induced pressure in the micro/nano-channel junction. Also from the electrical potential along the x∗direction, it is shown that the values at the inlets of the nano-channels are nearly uniform.
Acknowledgment
The authors wish to thank Professor Trevor Moulden for fruitful discussions.
[1] WANG Y.-C., STEVENS A. L. and HAN J. Millionfold preconcentration of proteins and peptides by nanofluidic filter[J]. Analytical Chemistry, 2005, 77(14): 4293-4299.
[2] KIM S. M., BURNS M. A. and HASSELBRINK E. F. Electrokinetic protein preconcentration using a simple glass/poly (dimethylsiloxane) microfluidic chip[J]. Analytical Chemistry, 2006, 78(14): 4779-4785.
[3] KIM S. J., KO S. H. and KANG K. H. et al. Direct seawater desalination by ion concentration polarization[J]. Nature Nanotechnology, 2010, 5(4): 297-301.
[4] KIM S., WANG Y.-C. and LEE J. H. et al. Concentration polarization and nonlinear electrokinetic flow near a nanofluidic channel[J]. Physical Review Letters, 2007, 99(4): 044501.
[5] YU Q., SILBER-LI Z. Measurements of the ion-depletion zone evolution in a micro/nano-channel[J]. Microfluid Nanofluid, 2011, 11(5): 623-631.
[6] JIN X., JOSEPH S. and GATIMU E. N. et al. Induced electrokinetic transport in micro-nanofluidic interconnect devices[J]. Langmuir, 2007, 23(26): 13209-13222.
[7] KUO T.-C., CANNON D. M. and SHANNON M. A. et al. Hybrid three-dimensional nanofluidic/microfluidic devices using molecular gates[J]. Sensors and Actuators A: Physical, 2003, 102(3): 223-233.
[8] CHANG H.-C., YOSSIFON G. Understanding electrokinetics at the nanoscale: A perspective[J]. Biomicrofl uidics, 2009, 3(1): 12001.
[9] SILBER-LI Z., KONG G. and YU Q. et al. Observation of vorticity generation in micro/nano-channel flows subject to an electric field[C]. Proceedings of the 11th Asian Symposium on Visualization. Niigata, Japan, 2011.
[10] XU Z., WEN J.-K. and LIU C. et al. Research on forming and application of U-form glass micro-nanofluidic chip with long nanochannels[J]. Microfluid Nanofluid, 2009, 7(3): 423-429.
[11] BAO F.-B., LIN J.-Z. Linear stability analysis for various forms of one-dimensional Burnett equations[J]. International Journal of Nonlinear Sciences and Numerical Simulation, 2005, 6(3): 295-303.
[12] BAO F., LIN J. Burnett simulation of gas flow and heat transfer in micro Poiseuille flow[J]. International Journal of Heat and Mass Transfer, 2008, 51(15-16): 4139-4144.
[13] BOCQUET L., CHARLAIX E. Nano fl uidics, from bulk to interface[J]. Chemical Society Reviews, 2010, 39(3): 1073-1095.
[14] KIRBY B. Micro- and nanoscale fluid mechanics: Transport in microfluidic devices[M] Cambridge, UK: Cambridge University Press, 2010.
[15] KIM S. J., LI L. D. and HAN J. Amplified electrokinetic response by concentration polarization near nanofluidic channel[J]. Langmuir, 2009, 25(13): 7759-7765.
[16] ZANGLE T. A., MANI A. and SANTIAGO J. G. On the propagation of concentration polarization from microchannel-nanochannel interfaces. Part II: Numerical and experimental study[J]. Langmuir, 2009, 25(6): 3909-3916.
10.1016/S1001-6058(13)60363-7
* Project supported by the Chinese Academy of Sciences Research and Development Program of China (Grant No. KJCX2-YW-H18), the National Natural Science Foundation of China (Grant No. 10872203) and the National Key Basic Research Development Program of China(973 Program, Grant No. 2007CB714501).
Biography: KONG Gao-pan (1982-), Male, Master
Corresponding auther: SILBER-LI Zhan-hua,
E-mail: lili@imech.ac.cn

- 水动力学研究与进展 B辑的其它文章
- Hydrodynamic modeling of cochlea and numerical simulation for cochlear traveling wave with consideration of fluid-structure interaction*
- Orientation of the fiber suspending in the flow through a tube containing a sphere*
- Numerical analysis of vortex core phenomenon during draining from cylinder tank for various initial swirling speeds and various tank and drain port sizes*
- Radiation and diffraction analysis of a cylindrical body with a moon pool*
- Heat transfer characteristics in micro-fin tube equipped with double twisted tapes: Effect of twisted tape and micro-fin tube arrangements*
- Stochastic simulation of fluid flow in porous media by the complex variable expression method*