
Experimental Study on Mechanical Properties of Low Carbon Steel with Ultrasonic Vibration Tensile
2013-09-17 12:10CHENGXueliZHAOMingliCHENLihong
机床与液压 2013年12期
CHENG Xueli,ZHAO Mingli,CHEN Lihong
1 Department of Mechanical Engineering,Henan Mechanical and Electrical Engineering College,Xinxiang 453000,China;
2.School of Mechanical and Power Engineering,Henan Polytechnic University,Jiaozuo 454000,China;
3.North Automatic Control Technology Institute,Taiyuan 030006,China
The tensile test is firstly used to determine the mechanical properties of metal materials,and is the most widely used testing method.Due to the simple,intuitive,easy process and representation,it is widely adopted in many fields of metallurgy,machining,construction and scientific research,and it becomes one of the most common method to determine the physical properties of metal materials[1].The performance of metal material under the external force,such as elasticity,plasticity,strength and toughness are called the mechanical properties[2].Currently,the tensile test on low carbon steel under the normal conditions have been comprehensively conducted,and the mechanical properties are very clear.However,the mechanical properties in the ultrasonic vibration stretch are very bare.It is well known that the ultrasonic vibration machining have many advantages,such as reducing the cutting force,decreasing the cutting temperature,improving tool life and machined surface quality.However,it is not clear that how the ultrasonic vibration influence on the tensile test.In order to clarify the difference between the ultrasonic vibration stretching and conventional stretching on the mechanical properties of low carbon steel,the tensile tests are conducted,respectively in this paper.It is expected to play a guiding role on the research of the low carbon steel.
1.Test methods and conditions
Firstly,the scribing machine is used to carve a peripheral line every 5 mm within the l0gauge,and to divide l0into 10 divisions to observe the change of gauge.Then,the dynamometer pointer is adjusted to“zero”point,and make follow-pointers overlap with it,and set the drawing device.After that,the test machine is properly checked and load it slowly and evenly to observe the experimental phenomena.When the dynamometer pointer does not move or back-wards,it indicates that the material is beginning to yield,and then the yield load P,is recorded.If keep loading the specimen to fracture,the maximum load Pbcould be read out.Finally,the specimen is removed and the relationship of P-ΔL(force-displacement)is plotted aligned with the two sections of the fracture specimen by using the vernier caliper to measure length l1,the fracture(necking)diameter d1,and calculating the fracture cross sectional area A1[3].Tensile test was conducted on a group of four workpieces and the most reasonable curve will be chosen as the tensile curve from four tensile curves in this condition.
Test frequency are:20,20.845,21.7 kHz,and the test power are:80,70,60 and 50 W.In order to clearly observe the change,the lateral(ΔL direction)will be enlarged by 20 times.The test equipments and conditions are shown in Tab.1,and the ultrasonic vibration tensile test site and set are as shown in Fig.1 and Fig.2.

Tab.1 Experiment conditions

Fig.1 Ultrasonic tension experiment site

Fig.2 Experiment debugging site
2.The mechanical properties with Ultrasonic Vibration Tensile
2.1.Test data acquisition
The Low carbon steel tensile diagram could be automatically plotted by the testing machine.Automatic drawing device was shown in Fig.3,and the tensile curves are shown in Fig.4.
It should be noted that the tension specimen deformation ΔL is mainly the elongation of the workpiece.In addition,due to the consideration of the elastic deformation of the machine itself,the sliding test piece in a chuck and other factors.When the specimen sustains the force,the sliding of the holding portion within the chuck will become big and then it will disappear.

Fig.3 Automatic drawing device

Fig.4 The curve of tension
If we use ΔL of P - ΔL curve dwarfed by material testing machine drawing device to calculate E,it will produce a certain deviation.In order to accurately measure E,it is necessary to accurately measure the deformation of the specimen within the gauge,thus we adopt the extensometer and use the incre-mental method to divide the final load into equal parts,and load progressively to measure the deformation of the specimen[4].The measuring data are shown in Tab.2 and Tab.3,and the rest of the test data are not presented in this paper.

Tab.2 The tensile data when P equals 80 W and f equals 0 kHz

Tab.3 The tensile data when P equals 80 W and f equals 20.845 kHz(resonance vibration)
Conduct one-dimensional interpolation for the above test data(including not listed in the text)and obtain an interpolation curves,which is shown in Fig.5.From this figure,when the power P is 80 W,in resonance case,the curve is at the bottom,the yielding is not obvious.We find that the testing machine hands is just for instant detention,tensile curve is similar with that of copper and other soft metal,which is consistent with those in Fig.4.
In order to reduce article space,in the resonance case,the tensile test experimental data obtained by changing the ultrasonic power is not presented in this paper and the one-dimensional interpolation curve is shown in Fig.6.From Fig.6,we can see that the change of power will affect vibration stretching,the smaller power of the vibration,the worse of softening effect.
2.2.The material plasticity and determination
2.2.1.The determination of elongation δ
Set the model length l0,fracture it and butted two sections of the specimen together tightly,measure the fractured model length l1,so the elongation δ could be obtained as follows[5]:

Fig.5 The interpolation curve of experimental data in diffierent frequency when P equals 80 W

Fig.6 The interpolation curve of experimental data in different power when f equals 20.845 kHz
2.2.2.Determination of Sectional shrinkage ψ
The cross-section shrinkage is the relative shrinkage value of cross-section specimens after fracturing.The evaluation equation could be expressed:

where,A1is the smallest cross-sectional area of fractured specimen(mm2);A0is the original cross-sectional area of specimen(mm2).
The specimen model length can not affect the value of ψ,but the original specimen diameter does affect the value of ψ slightly[6].
When the measurements of the elongation or shrinkage of the workpiece are conducted in a certain range of power and frequency,it is necessary to carry out measurement on a set of(four)workpieces and remove the results of workpiece with obvious defects.And then take the average value of the rest as the test result,the measured results are shown in Tab.4 and Tab.5.
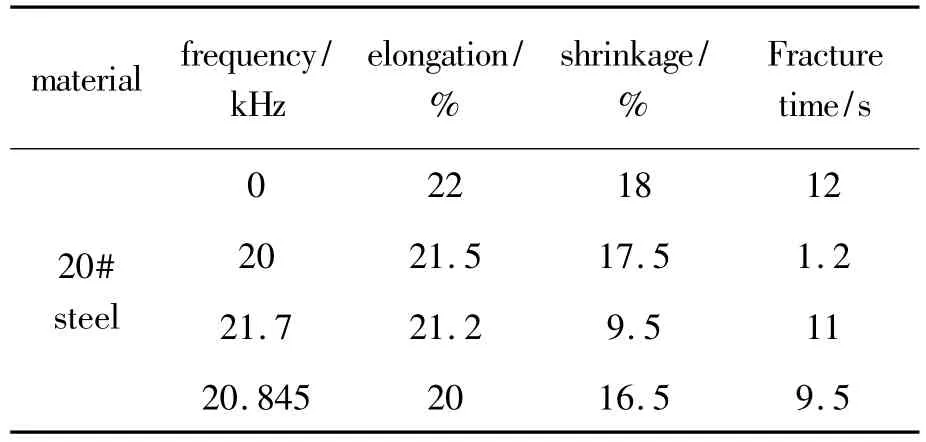
Tab.4 The tensile data in diffierent frequency when P equals 80 W

Tab.5 The tensile data in diffierent power when f equals 20.845 kHz(resonance vibration)
As can be seen from the test results of Table.4 and Table.5,the elongation and shrinkage are decreased with the decrease of power and the relationship between these two parameters is monotonic even the declined trend is not very obvious.In terms of frequency,at the resonance point,the decrease becomes very obvious and it is slightly deviated from the resonance point,the effect is greatly reduced.The closer to the resonance point,the lower values of the elongation and shrinkage.On both sides of the resonance point,it is not symmetrical(i.e.,20 and 21.7 are symmetrical about 20.845),but from the results of the experiment,the degree of reduction is asymmetry,the high frequency has large degree of reduction,but the differences is not particularly obvious.
2.3.The determination of the elasticity modulus E
The elasticity modulus E is generally measured by the tensile test within the proportional limit.Since the materials obey Hooke’s law,the relationship between the load and the deformation could be expressed as follows[7]:

If the load P and specimen size are known,the elasticity modulus E could be derived as long as the specimen elongation is obtained[7].

When find out the loading program in the level increment,select the early load in the 10%of the full scale of the disk or slightly larger than this value,it should be at least five levels loading.Since the data of measuring the elasticity modulus is from the elastic stage and trace plastic deformation stage,the cross-sectional area of the material in this phase can be regarded as constant,the cross-section can be regarded as continuity.The force and displacement data of the elastic phase are converted into stress and strain data,respectively,by divided the workpiece into A0and L0,and the transformed data for the linear fitting,the slope of straight line is the elasticity modulus of the workpiece material in this case.The power is 80 W,the fitting curves of frequency are shown in Fig.7.The resonant frequency of 20.845 kHz is selected and the fitting curves of power are shown in Fig.8.
2.4.The strength of the material and its determination
Strength is the resistance against plastic deformation and fracture resistance of objects under the external force.The common indicators are the yield strength (yield limit)σsand tensile strength(strength limit)σbwhich will decide the material mechanics parameters in the normal use.
According to the experimental data,divide the force P by the area to get stress,σsand σbcurve with the frequency and power,respectively,as shown in Fig.9(a)and(b).
Due to the resonance power 80 W,20#steel has no obvious yield phenomenon to reach the yield limit σ0.2.From the view of the reduction degree,the strength indicators σs、σband the elastic modulus E are similar to the plastic performance indicators,but the degree of reduction is much lower than the that of the plastic performance indicators.

Fig.7 The fitting curve when P equals 80 W and f equals 0,20.845 kHz and 20 kHz(E equals 202.54、186.82 MPa and 194.88 MPa separatly)

Fig.8 The fitting curve when f equals 20.845 kHz and P equals 50 W、60 W and 70 W(E equals198.64 MPa,193.53 and 197.12 MPa separatly)
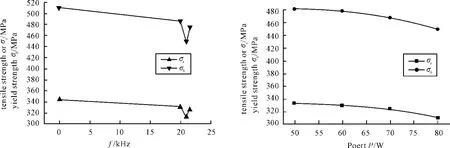
Fig.9 The curve of yielding strength σs、tensile strength σbfollowing frequency and power
3.Conclusions
In this paper,the ultrasonic vibration tensile test of the Low Carbon steel was conducted,the test method is developed in certain test conditions and the test data is recorded.One-dimensional interpolation curve of the test data is obtained and the following conclusions could be drawn:
The mechanical properties of low carbon steel with ultrasonic and without ultrasonic stretch are quite different. In ultrasonic tensile, material strength index σs,σband elastic modulus E are all decreased,which shows the softening phenomenon.The material yield phenomenon disappears in the resonance of the high-power.The elongation and shrinkage are decreased,and the deformation force of fracture is reduced as well,which is consistent with the conclusions in the literature[8].
The ultrasonic frequency and power will affect the material softening degree.Around the resonance frequency,the material softening phenomenon becomes very obvious.Once the frequency deviates from the resonance point,the softening effect will be reduced.The softening of high frequency value is much better in deviating from the resonance point.For a certain frequency,the smaller of the vibration power,the worse of the softening effect.
[1] WANG Yanyun,WANG Qin,CHEN Lirong.Test Research on Tensile speed effect on the mechanical performance of low steel and cast iron[J].Agriculture and technology,2012,30(6):118 -121.
[2] TAN Xiaofeng.Discussion to metal material pulling test stress-strain diagram[J].Goods and quality,2010(6):2-3.
[3] QIN Jun.Study on mechanical property of 20#steel under ultrasonic vibration simple tension[D].Henan Polytechnic University:Mater.Master’s thesis,2007:69-72.
[4] GU Chunqi.Based on virtual test car structure bonding technology research[D].Shanghai:Tongji University Chinese-German College,2008.
[5] YANG Shaochong.Study on mechanics performance of Glass fibre laminated plate[D].Hebei:Hebei University,2009.
[6] SUN Maocai.Metal mechanical properties[M].Harbin:Harbin industrial university press,2003:43 -45.
[7] ZHOU Tuanfeng, ZHANG Guirong, WANG Xinzhi.Measurement of modulus of elasticity and Poissons’ratio of galvano foils by speckle pattern interferometry[J].Oral cavity jaw face prosthetics magazine,2010(4):247-250.
[8] WANG Gang,CHEN Junying,CHENG Jin.Design and manufacturing of ultrasonic installation for tensile test[J].Harbin Institute of Technology,2000,3(32):81-84.

- 机床与液压的其它文章
- Wavelet Analysis Fault Information and Realization in Virtual Instrument
- Design of Experimental System for Measurement of Cam Profile
- Finite Element Analysis for a New Friction-based Limited-slip Differential Housing
- Precision Measurement of Series Motor Housing Based on CMM
- Synchronous Motion Servo-control of Biaxial Cross Coupling Based on Intelligence Fusion Strategy
- Simulation and Optimization Analysis of Circuit Breaker Operating Mechanism