
SPH-BASED NUMERICAL ANALYSIS FOR GRANULAR MATERIAL MODEL OF SAND AND REGOLITH
2013-12-02 01:39MaChao马超WuTieying吴铁鹰
关键词:马超
Ma Chao(马超),Wu Tieying(吴铁鹰)
(1.Shanghai Aircraft Design and Research Institute,Shanghai,201210,P.R.China;2.College of Energy and Power Engineering,Nanjing University of Aeronautics and Astronautics,Nanjing,210016,P.R.China)
Nomenclature
RO Mass density
W Kernel function
BULK Initial Bulk modulus
G Initial Shear modulus
μSStatic friction coefficient
μDDynamic friction coefficient
VsimSimulated penetrating velocity
VepExperiment penetrating velocity
YforceForce to push penetrator
1 METHODOLOGY
This project is conducted under the combination of theoretically analysis method,experimental method and numerical simulation method.
For the initial geometrical shape of drilling tools,main tasks include observing and analyzing the shape and the mechanism of the teeth of wood wasp;as for the sand model and the lunar regolith part,related study mainly focuses on experimental and numerical simulation.
1.1 Comparison of FEM and SPH
During drilling process,there are many com-plex phenomena such as the nonlinear deformations inside soil,the interaction between soil and drilling device,the discretization process of soil material,and so on.However,the classical finite element method(FEM)can not represent all the properties,thus an accurate resolution can not be obtained[1].Therefore,smooth particle hydrodynamics(SPH)method is introduced into the drilling research project.As presented in Table 1and Figs.1-2,FEM and SPH methods are compared in detail and the biggest advantage of SPH is the ability of modeling various material properties.
The simulation shows that both methods canpush the penetrator into the material at the beginning,but after a certain depth,FEM fails with an abnormal termination,while SPH can penetrate into the material to any depth.This phenomenon confirms the preferred choice of SPH.
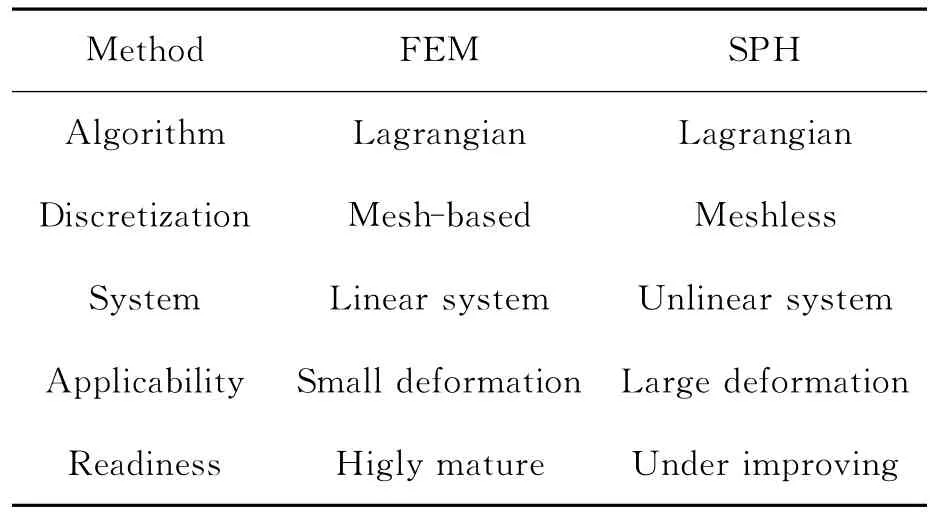
Table 1 Comparison between FEM and SPH
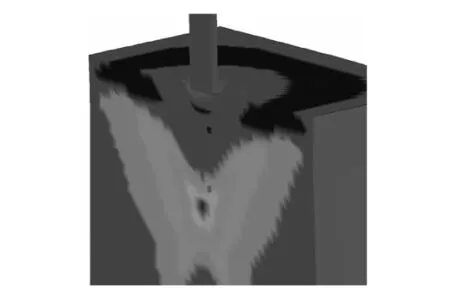
Fig.1 FEM penetration simulation
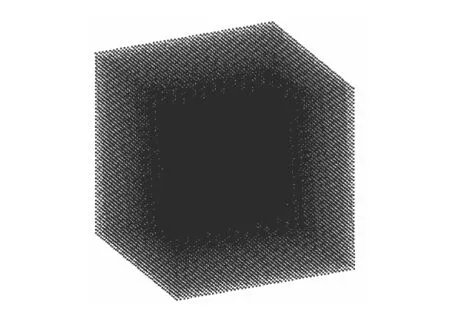
Fig.2 SPH penetration simulation
1.2 SPH in LS-DYNA
LS-DYNA is an advanced general-purpose multi-physics simulation software package developed by the Livermore Software Technology Corporation(LSTC).SPH is a new feature of LSDYNA and has a standard procedure and approach to access the integration and discretization of the conservation equations(mass,momentum,energy).The two most important characteristics of SPH are the definition of kernel function and the evaluation of smoothing length.
In LS-DYNA,the smoothing kernel is defined with the introduction of an auxiliary functionθ.The preferred choice made by SPH community is the cubic B-spline function[2]

where Cis the constant of normalization which depends on the geometry and the dimension of the discretization zone.We then have enough elements to define the smoothing kernel W
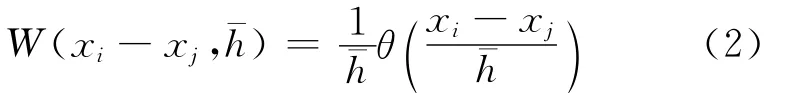
Fig.3shows that in the smoothing domainΩ as the circle.The closer the distance between arbitrary particle j and central particle i is,the bigger the influence between the two is.The influence level is represented by W .
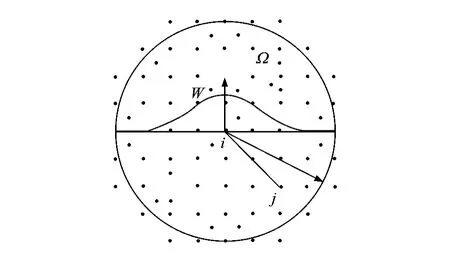
Fig.3 Smoothing domain and kernel W
1.3 Biology-Inspired mechanism
Another characteristic of the methodology is the biology-inspired mechanism.Contemporarily,scientists are willing to find inspiration from the nature,and more and more biology-inspired technologies are put into daily life.
As shown in Fig.4,the drilling tube is simplified as a pair of teeth,which moves up and down alternatively to cut the wood cell wall,during which the material is transferred outside the middle gap.However,this is only one form of illustration,which does not essentially represent the drilling mechanism of wood wasp[3].
2 SAND TEST AND SIMULATION
2.1 Sand test
Sand test is performed under a traction and a compression testing machine with a series of dif-ferent penetrating heads,in order to fulfill the following objectives:
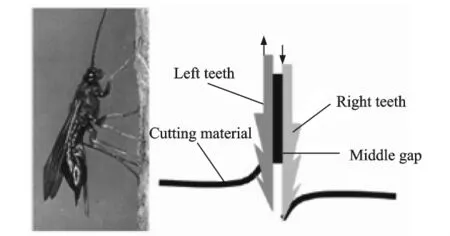
Fig.4 Wood wasp and simplified drill
(1)Find a relation between compression force and the displacement of the penetrator into the sand;
(2)Find a relation between tension force and the retraction displacement of the penetrator out of the sand;
(3)Illustrate the velocity effect on force during penetration for both real tests and simulation.
Fig.5illustrates the drill penetrator and the sand.After the test ends,the influence domain can be observed in the form of circle.
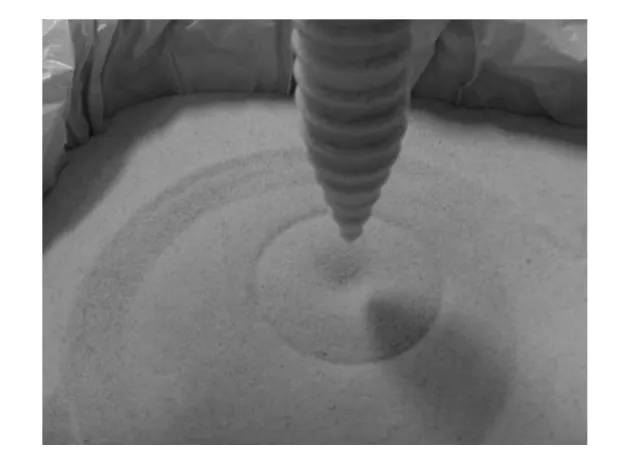
Fig.5 Drill penetrator and sand test
2.2 Numerical simulation process
Simulation begins with a 2-D model to give a rapid response to model settlements,followed by apreliminary evaluation of all the material models in LS-DYNA.After fixing the basic settlement,a 3-D model is created and improved by analyzing the influencing parameters including particle interval,penetrate velocity,contact frictional coefficients,etc.The ideal goal is to attain a material model independent from basic settlements,thus main work can be focused on the material model evolution.However,in reality,those hypotheses are rarely satisfied,and there is always a compromise taking account of all aspects of effects to reach a final sustainable and acceptable model.The overview of the penetrating model is shown in Fig.6.The material model is defined by the SPH particle properties.
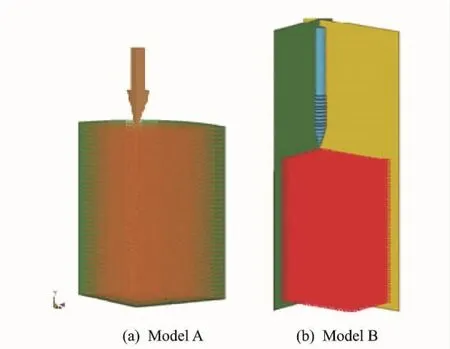
Fig.6 Overview of penetrating model
In Fig.6,model B is the corresponding simulation of the sand test shown in Fig.5and model A is related to a different penetrator and sand shape.Both models use the same material model while the difference is the calculating domain and the penetrator shape.
2.3 Influence of numerical parameter
2.3.1 Particle interval influence
Particle interval is the distance between the two adjacent particles,used to reflect the particle density.
Table 2shows that the decrease of the particle size causes a rapid increase of the size of input file,while the memory to perform the calculation increases a lot and the time of execution become unaffordable.Fig.7indicates that the penetrating force has a similar trend:first increases gradually and rapidly until reaches a certain depth then turns flat and begins to oscillate with a small aptitude.As a whole,the maximum penetrating force decreases gradually when particle interval becomes smaller.Theoreti-cally,there should be a critical value of the particle interval so that when the interval is smaller than this value,the calculation becomes independent from its size.However,a compromise has to be made to choose the particle interval as 4mm which is the most refined size in affordable time scale.The influence of the interval can be balanced by multiplying a correction ratio depending on particle interval.
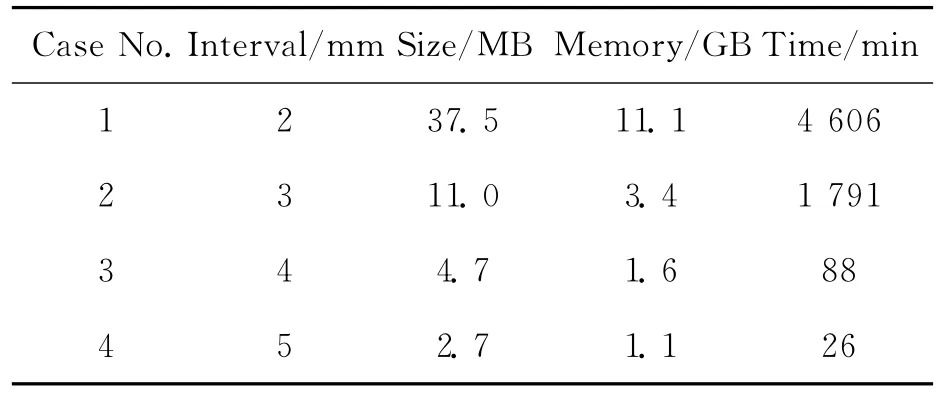
Table 2 Particle interval study
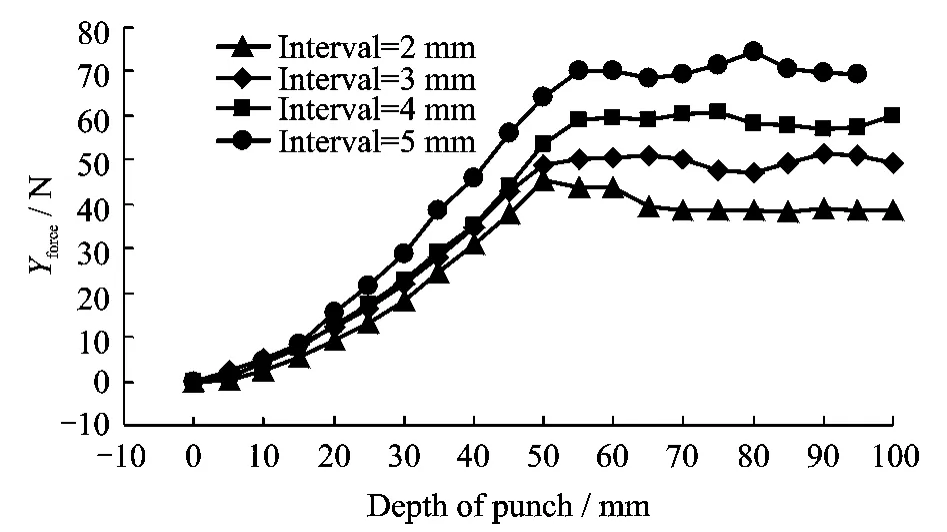
Fig.7 Particle interval trial
2.3.2 Penetrating velocity influence
Penetrating velocity is the velocity of the penetrator during the penetrating process.In the experiment,three different velocities are applied.Table 3reveals that calculation can last for nearly sixty hours if the simulated penetrating velocity Vsimis too small.In order to shorten the executing time to an acceptable level,an approximation decision has to be made and the velocities used in the experiment and the simulation are set as follows
Vep=i×0.001 67 i=1,5,10
0.001 67m/s=10mm/min
Vsim=j×Vepj∈[10,100]
Vsimis set as ten times or a hundred times of Vep.The objective is to reduce the computation time to an accepted level.To analyze this effect,three cases of keyword files are created and analyzed.All settlements are exactly the same while the only different parameter is the penetrating velocity.
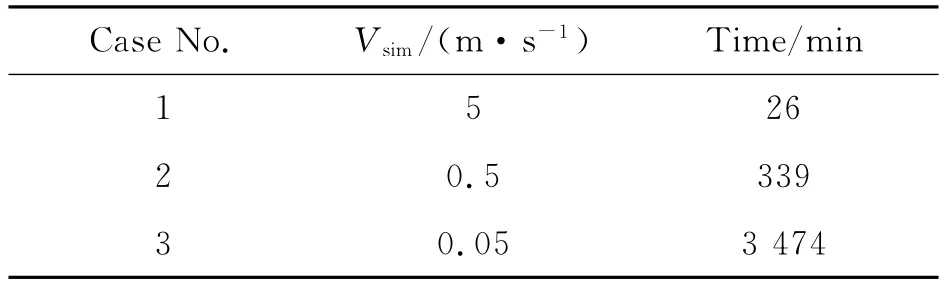
Table 3 Penetrating velocity study
According to the calculation result expressed in Fig.8,the three curves maintain a consistent shape or trend:When the punching velocity is high,the reacted punching force is high.However,compared with Vsimchanged from 0.5to 5m/s,when Vsimincreases from 0.05to 0.5m/s,the force variation became relatively small.This indicates that the penetrating velocity should be small enough,so does the variation.As the maximumVsimis 0.167m/s,the effect between 0.0167m/s and 0.167m/s is more or less acceptable,given the limitation of computation capacity.
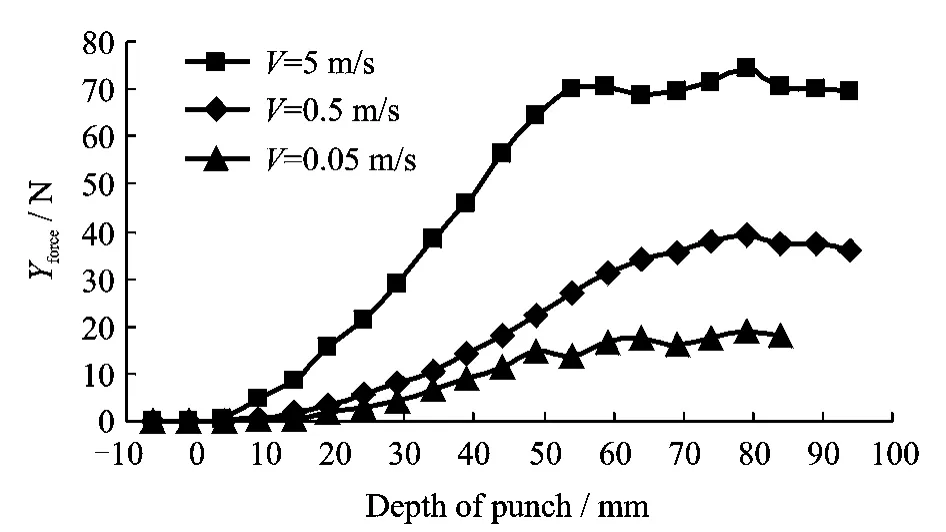
Fig.8 Penetrating velocity trial
2.3.3 Contact friction influence
There are two different types of friction coefficients:one is the dynamic friction coefficient;the other is the static friction coefficient.Generally speaking,the static one should be higher than the dynamic one.This is the reason why we set the dynamic coefficient 90%of the static coefficient,as shown in Table 4.
According to Fig.9,when friction coefficients are zero,the maximum force of punch isaround 40N;when the coefficients increase from 0.10to 1.00,the increased punch force corresponding to friction effect is propotional to the friction coefficents.
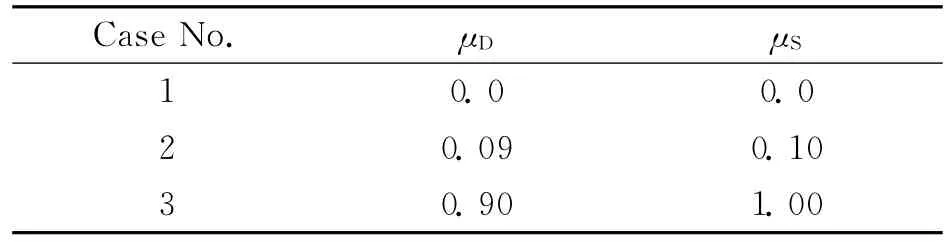
Table 4 Contact friction study
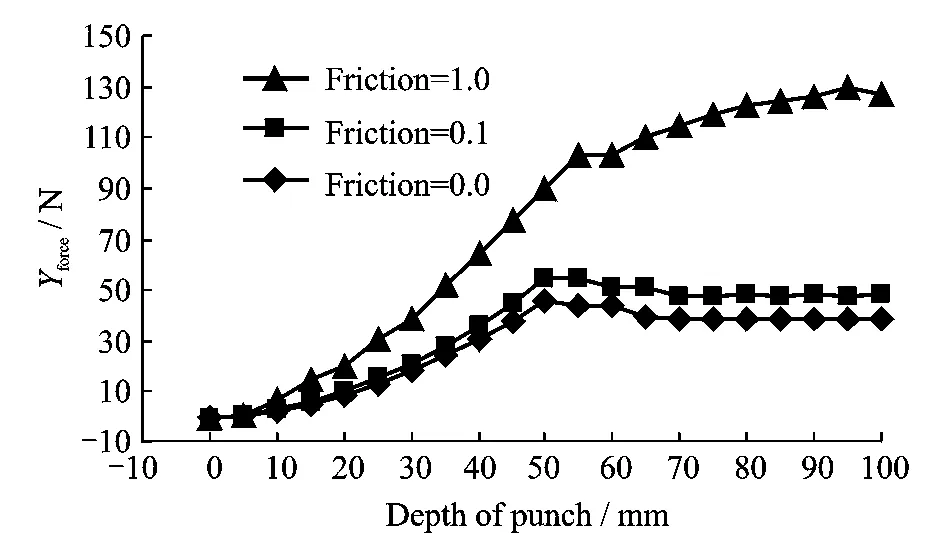
Fig.9 Contact friction trial
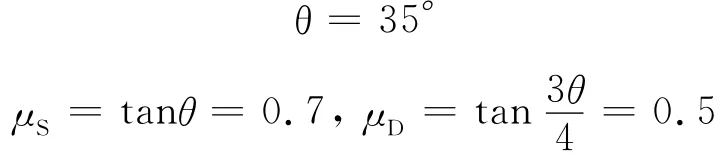
From the above analysis,it is concluded that the influence of contact friction is quite important.So the real contact friction coefficients in the punch experiment should be measured and input into the keyword file for numerical simulation.As in the experiment,the material is steel and sand and the approximate friction angleθis 35°,while the empirical shear stress-slip relation proposed by Janosi and Hanamoto is used to estimate the interface friction angle applying a correction of penetration process method[4].The final friction coefficients used in numerical calculation is:
Friction angle of sand
2.3.4 Final sand model settlement
As analyzed before,the sand model is presented in Table 5.
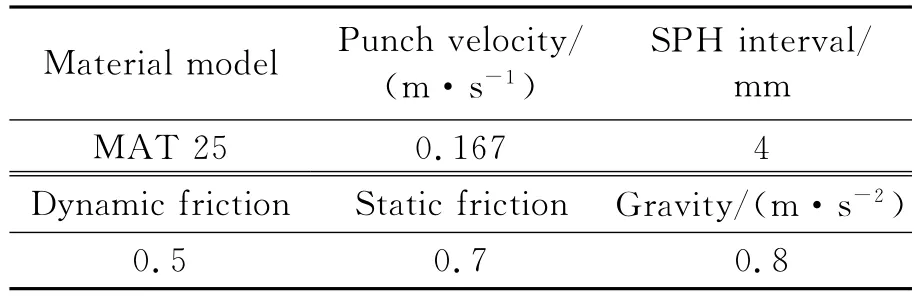
Table 5 Sand penetrating model settlement
3 NUMERICAL MODEL ANALYSIS
3.1 Sand model validation
MAT 25[5],the number 25material model,also named MAT-GEOLOGIC-CAP-MODEL,is an inviscid two invariant geologic cap model and used for geomechanical problems.
The definitions of all MAT 25parameters,which are the variables shown in Table 6,can be referred to LS-DYNA manual.Detailed explanation is not described here and all units can be deduced according to the basic units as mm,ms,N.Table 6gives the settlements of MAT 25.Every parameter is analyzed and fixed after tuning the cap surface corresponding to the experiments curves as follows.
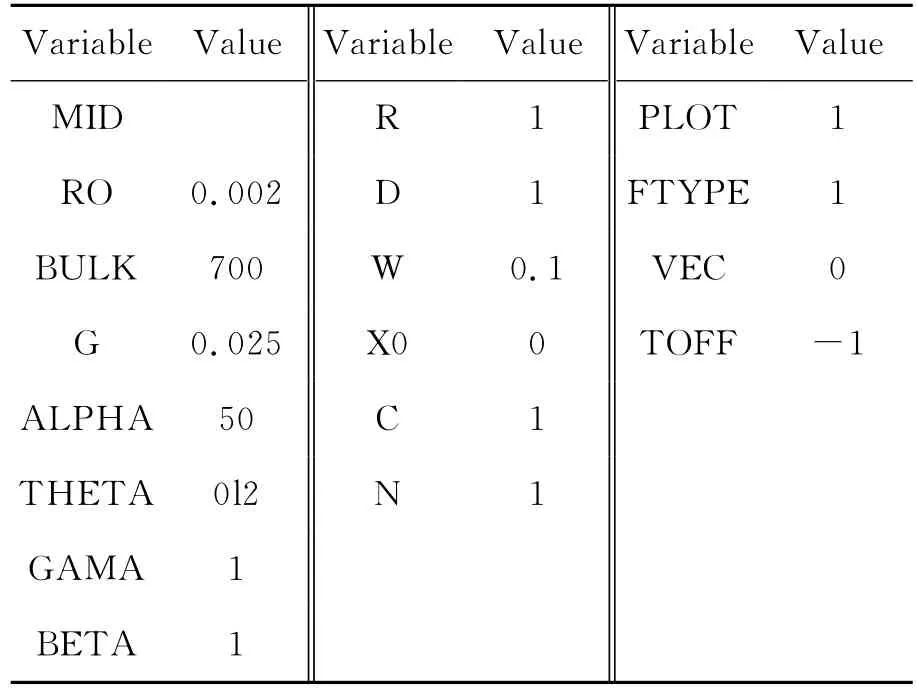
Table 6 Sand material model parameter
3.2 Comparison between test and simulation
The validation of the simulation is fully explained under a series of experimental resistance curves corresponding to different penetrating heads.
3.2.1 Flat punch∅50mm
Flat punch∅50mm is a steel cylinder with a 50mm diameter and two flat ends.According to Fig.10,the comparison can be analyzed in two parts.The sand test is conducted twice to verify the experiment repeatability and produce curve A and B.At the beginning of penetration,the two experiment curves show a fast increase while the simulation curve increases relatively slowly.In the middle part of the curve,experiment curve A and Bhave a discrepancy before 30mm,because the first penetration make the sand a little looser.Generally,the simulation results and the experimental results have a satisfied coincidence,which gives a sound support for the sand model settlements.
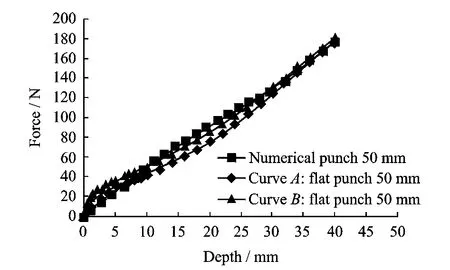
Fig.10 Flat penetratorø50mm result
3.2.2 Drill punch
The shape of drill punch is illustrated in Fig.5and model B in Fig.6.This drill punch has the same teeth as the simplified drill dose[6],but it is a whole part while the simplified drill has a pair of separate teeth with a middle gap.In Fig.11,the square line is the simulation result,while the others are the test curves with different penetrating depth.
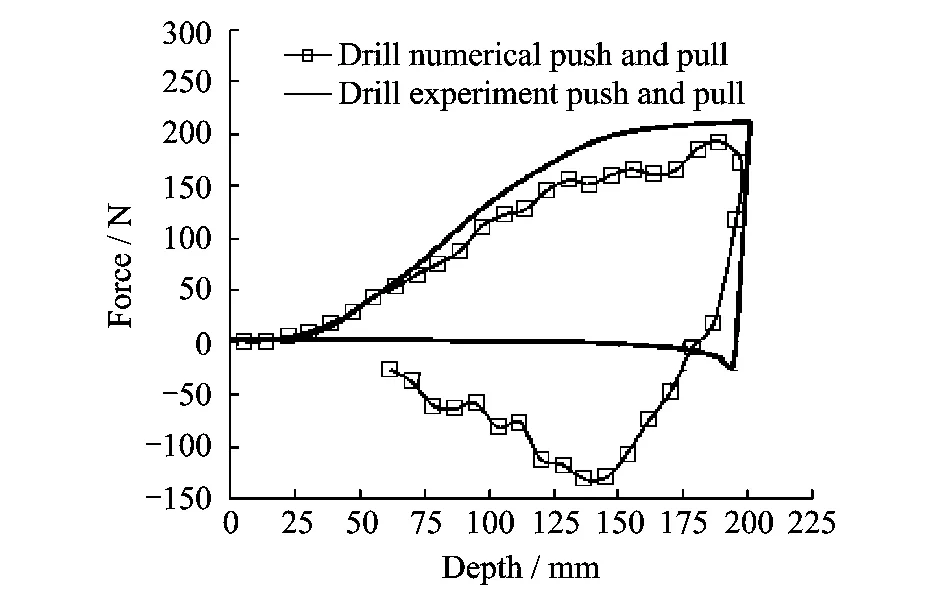
Fig.11 Drilling penetrator results
The comparison can be divided into two phases.First phase is pushing process.In this phase,the numerical result fits very well with the experimental one.The second phase is the pulling phase.The numerical calculated force has the same magnitude in both pulling and pushing phases.The experiment data shows that the traction force is much lower than compression.This is a big problem for us because a bigger traction resistance is an objective of the designed geometry of penetrator.
This phenomenon can be explained as the sand used in experiment is very dry and loss[7],and the shear resistance is too small,if we replace the sand material by general soil,the experiment result can be totally different.
3.2.3 Dual-reciprocating drilling device
Fig.12shows the overview of the dual reciprocating drilling process.This picture illustrates that SPH method is capable to simulate the drilling process.Although the result is not accurate enough to support the dual-reciprocating drilling(DRD)optimization,the potential is very high and attractive.
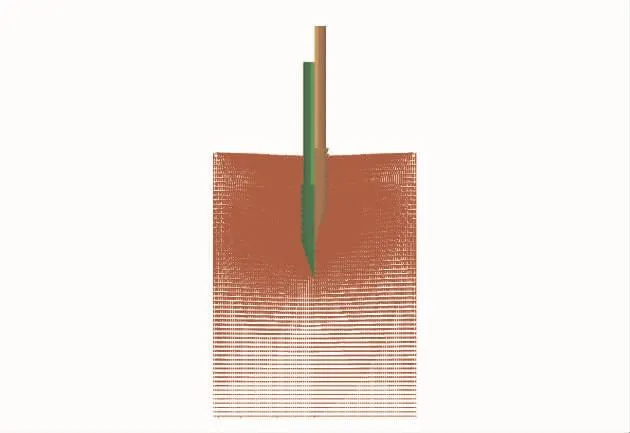
Fig.12 Overview of dual-reciprocating drill
4 CONCLUSIONS
The following main conclusions can be drawn from the results presented in this paper.
(1)SPH method is verified to be suitable for simulating drilling process.After a certain penetration depth,the force stops increasing,turns flat and begins to fluctuate with small aptitude.
(2)The penetrating force decreases when particle interval decreases.Small interval means abundant particles to integrate,leading to more accurate computation.
(3)The penetrating velocity has a great influence on calculation results,especially the reacted penetrating force.High velocity indicates big reacted force.In order to ease the drilling resist-ance,penetrating velocity should be designedto be slow enough and considered to be a key parameter.
(4)The gravity effect on the contact force is small enough to be ignored.Although the gravity acceleration is a distinct factor between the moon and the earth,the drilling process is not apparently gravity dependent.
(5)G has a direct influence on the penetrating resistance,when increase the shear modulus,the penetrating force has a linear augment.
(6)Although the shear resistance has the principal influence on the penetrating force,the contact friction also plays an important role and should also be optimized.
(7)The sand model given in this article is basically verified by considering the match between the numerical data and the experimental results with the flat punch and the drill punch.However,further study and modifications are needed.
(8)Compared with sand,a typical set of penetrating force curves over a wide range of lunar terrain reveals a variant resistance behavior on lunar surface[8],thus the regolith model is strongly material location dependent.
[1] Fedaravicˇius A,¯Saulys P,Grisˇkevicˇius P.Research of mine imitator interaction with deformable surface[J].Mechanika Kaunas Technologija,2009,72(3):21.
[2] Lacome J L.Smooth particle hydrodynamics:a new feature in LS-DYNA [J].Some Recent Improvement and Application on SPH,2007,204(5):127-129.
[3] Karafiath L L,Nowatzki E A.Soil mechanics for offroad vehicle engineering[J].Journal of Terramechanics,2004,41(1):41-68.
[4] Abdullah A M.Shearing rate effect on interfacial friction between sand and steel[D].Riyadh:Department of Civil Engineering,King Saud University.
[5] LSTC.LY-DYNA keyword user′s manual volume II[M].Version 971.USA:Livermore Software Technology Corporation(LSTC),2007:115-120.
[6] Liu G R,Liu M B.Smoothed particle hydro dynamcis:a meshfree particle method[M].Singapore:World Scientific Press,2003:26-27.
[7] Susila E,Hryciw R D.Large displacement FEM modelling of the cone penetration test(CPT)in normally consolidated sand[J].International Journal for Numerical and Analytical Methods in Geomechanics,2003,27(7):585-602.
[8] Grant H H,David T,Bevan M.Lunar Source book[M].Cambridge,UK:Cambridge University Press,1991:511.
猜你喜欢
Chinese Physics B(2022年8期)2022-08-31
Chinese Physics B(2022年1期)2022-01-23
小天使·三年级语数英综合(2021年6期)2021-08-09
电影评介(2021年24期)2021-05-01
分忧(2020年6期)2020-06-11
飞天(2019年9期)2019-10-30
课堂内外(初中版)(2017年6期)2017-07-08
做人与处世(2016年19期)2016-12-03
连环画报(2015年5期)2015-11-12
民间故事选刊·下(2009年9期)2009-03-15
 Transactions of Nanjing University of Aeronautics and Astronautics2013年1期
- Transactions of Nanjing University of Aeronautics and Astronautics的其它文章
- AIRCRAFT CONCEPT EVALUATION AND EFFECTIVENESS-BASED DECISION-MAKING
- EXPERIMENTAL INVESTIGATION ON R134AAIRBORNE VAPOR-COMPRESSION REFRIGERATION SYSTEM
- PREDICTION OF SURFACE ROUGHNESS FOR END MILLING TITANIUM ALLOY USING MODIFIED PARTICLE SWARM OPTIMIZATION LS-SVM
- SOFT IMAGE SEGMENTATION BASED ON CENTER-FREE FUZZY CLUSTERING
- SPATIAL REGULARIZATION OF CANONICAL CORRELATION ANALYSIS FOR LOW-RESOLUTION FACE RECOGNITION
- NOVEL HIGH-SPEED FPGA-BASED FFT PROCESSOR