基于均匀设计与支持向量回归的拮抗辣椒链格孢菌解淀粉芽孢杆菌发酵条件优化
2013-12-23 05:51蔡文韬夏延斌易有金任佐华袁泽民王立峰
食品科学 2013年13期
蔡文韬,夏 菠,*,夏延斌,易有金,任佐华,袁泽民,王立峰
(1.湖南农业大学食品科技学院,湖南 长沙 410128;2.湖南农业大学生物安全科技学院,湖南 长沙 410128)
Alternaria alternate is one of the most economically concerned diseases of chilli worldwide. It is estimated that losses of chilli due to black rot infection is 50% in China, where is the world’s largest producer of chilli. A. alternata can spread very quickly in chilli crops. It is difficult to control, and often results in substantial economic losses[1]. This disease appears as ripe fruit-rot and die-back. Ripe fruit-rot is more obvious since it causes severe damage to mature fruits in the field as well as during transit and storage. Demand for chillies worldwide is increasing every year and good quality chillies, i.e., absence of diseased appearance or fungal toxins, are prerequisites for import and export. However, control of this disease on chilli fruits still relies mainly on the use of chemical fungicides, but the long-term use of chemicals may lead to environmental pollution and increase pathogenic drug resistance[2]. Furthermore, vegetables with chemical residues can be harmful to human health[3-4]. Consequently, biological methods to control A. alternate present viable options to control losses to the chilli industry.
In recent years, significant progress has been made by using biocontrol methods to combat soil-borne plant diseases, especially through the application of antagonist microorganisms[5-6]. Despite lack of reports in the literature, research of endophytic bacteria that asymptomatically reside within the inner parts of plants has recently been intensified, mainly due to the bacteria’s diverse antibacterial active compounds, which are potential for biocontrol of plant diseases[7-9]. However, the production of antibacterial active compounds from microorganisms differs qualitatively and quantitatively depending on the strains and species of microorganisms used as well as on their nutritional and cultural conditions[10-11]. Furthermore, the maintenance of high fermentation efficiency and metabolic ingredient levels are required to produce as much amounts as possible and minimize capital and energy costs. The substrate is the main cost component for industrial production. Hence, it is necessary to optimize endophytic bacteria fermentation conditions to improve the production of antimicrobial metabolites.
The conventional “response surface methodology (RSM)” used for optimizing a multivariable system is obviously better than the previous “one-factor at a time” technique in experimental efficiency and comprehensive analysis[12], but RSM has low approximation accuracy when the real limit state function nonlinearity is high or the sample size is small[13]. Recently, many statistical experimental design methods have been employed in the optimization conditions. Uniform design is a multi-factor optimization experimental design method, which was created by famous Chinese mathematicians Fang et al.[14]. Through this design method, the test points can be fully “dispersed uniformly” within the experimental range and each point is of better representativeness. Hence, the number of test points can be reduced greatly and also the factor level can be adjusted properly, preventing high-grade level and lowgrade level from meeting. Thus, it is a powerful tool to select optimization conditions when seeking the best experimental conditions and the best proportion[15-16], etc.
The traditional methods for further analysis, such as multiple linear regression (MLR), stepwise linear regression (SLR), partial least-squares regression (PLR), quadratic polynomial regression (QPR), partial least-squares-quadric polynomial regression (PLS-QPR), and artificial neural network (ANN), are based on the empirical risk minimization and they require sufficiently large or infinite sample set. However, the formulation optimization belongs to typical small sample set. Thus, serious drawbacks exist in the generalization of UD under the premise of small sample set[17-18]. Recently, a regression version of support vector machines (SVMs) has emerged as a powerful technique to solve this problem. SVM has the advantages of strong generalization ability, non-linear characteristics, avoiding over-fitting and dimension disaster[19-20], etc. SVR as a version of SVMs for regression, is one of the most promising learning algorithms for classification with poor parameter settings. SVR has been successfully used to model and optimize biochemical and biotechnological processes including gene expression data[21]and predict protein accessible surface areas[22]. However, SVR has a drawback that limits the use of SVR that there are many free parameters which need to be defined by the users. Hence, to choose a good parameter setting is important and critical for a good generalization performance of the SVR model. To address this problem, The combination of UD and SVR was presented as a suitable method to identify the effect of individual variables and for efficiently designing optimal conditions for a multivariable nonlinear small-sample system[23-24]. The objective of the present study was to optimize fermentation conditions of Bacillus amyloliquefaciens strain L and provide a scientific basis for industrialization.
1 Materials and Methods
1.1 Microorganisms and culture media
Strain L was isolated from bell peppers grown at the National R&D Center for Vegetable Processing, Hunan Agricultural University (Hunan, China). According to the characteristics of morphology, physiology and the comparison of 16S rDNA sequence, strain L was identified as Bacillus amyloliquefaciens. A. alternata was pathogenic and it was provided by the Department of Pathology, Plants, Hunan Agricultural University (Hunan, China).
The seed culture liquid medium was consisted of 5 g beef extract, 10 g peptone, and 5 g NaCl in 1 L of distilled water at pH 7.2. The fermentation liquid culture medium contained 5 g beef extract, 5 g peptone, 5 g NaCl, and 20 g starch in 1 L of double distilled water at pH 7.2. The potato dextrose agar (PDA) contained 200 g potato, 20 g dextrose, and 10 g agar in 1 L of double distilled water.
1.2 Culture conditions
For the seed culture, activated strain L cells were grown in 100 mL of seed liquid culture medium (in a 250 mL shake flask) on a rotary shaker for 24 h at 28 ℃ and 180 r/min and transferred for 1% fermentation to 100 mL of fermentation liquid culture medium (in a 250 mL flask) and then placed on a rotary shaker for 48 h at 28 ℃ and 180 r/min in the dark. To optimize the fermentation conditions, the experiment was strictly carried out as depicted in Fig.1. Then, all of the test fermentation broths were centrifuged at 10000 r/min for 10 min and filtered using a 0.22 μm bacterial filter, the supernatants of the test samples were used to evaluate the antimicrobial activity (generally, 28 ℃ at 180 r/min for 48 h; bacterial content 5×10⁶CFU/mL, as a reference). A. alternata, as the target microbe, was maintained on PDA medium at 4 ℃.
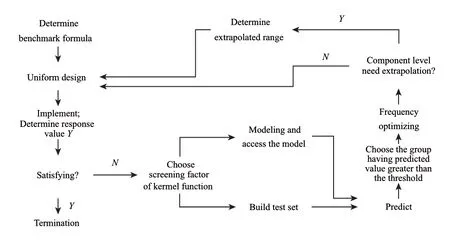
Fig.1 Flow chart of culture medium optimization based on UD-SVR
1.3 Experimental design and optimization
1.3.1 Screening for carbon, nitrogen, and microelement sources in media for production of antimicrobial components To investigate the effects of carbon and nitrogen sources on antimicrobial products of strain L, various single and complex carbon (soluble starch, lactose, maltose, sucrose, glucose, and trehalose) or nitrogen (NH4NO3, (NH4)2SO4, beef extract, NH4Cl, peptone, and yeast extract) sources were used to replace the carbon and nitrogen sources in the fermentation liquid culture medium, while all other components were kept constant. In the selection of proper microelements, all of the microelements (NaCl, ZnCl, KH2PO4, FeSO4, MnSO4and CaCl2) in the fermentation liquid culture medium were replaced by one microelement at a certain concentration.
1.3.2 The establishment of the benchmark program
Based on previous experiments and the related research of Bacillus amyloliquefaciens fermentation optimization, soluble starch 0.5%―2%, glucose 0.5%―2%, yeast extract 0.4%―1.4%, CaCl20.1%―0.7%, and KH2PO40.1%―0.7%, temperature 28―32 ℃, time 36―60 h, inoculating quantity 1%―3%, pH 6―8 for the UD experiment. Considering the importance of factors influence on the experiment result, 9 level factors , the Y value (inhibitory activity) as an index, the basic program as the benchmark, and the upper and lower default limits of each factor and step size are shown in Table 1.
1.3.3 Optimization method
The optimization process involves 4 major steps: 1) performing the first uniformly designed experiments using data processing system (DPS, version 9.50) and the benchmark program, 2) selecting the optimal kernel function and nonlinear variables, 3) estimating the coefficient in a mathematical model and predicting the response and checking the adequacy of the model, and 4) performing a second series of uniformly designed experiments and optimizing the recipe based on frequency count or single factor effect analysis[25]. Fig.1 depicts a UD-SVR formulation optimization chart.
1.4 Data calculation and analysis
The UD-SVR data was analyzed using library for support vector machines (LIBSVM) version 2.8 software[26](originated from http://www.csie.ntu.edu.tw/~cjlin/libsvm/index.html. ). It was adopted to implement support vector regression model in this work. LIBSVM2.8 contains 4 conventional programs: svmscale used for normalization of the original data, svmtrain for training, svmpredict for prediction, gridregression.py for searching optimal parameters of kernel function automatically(c,g,p.(c∈[-1, 6], g∈[-8, 0], p∈[-8, -1], steps are 1)). The use of the programs and the definition and settings of the parameters can be found in references[27-28].
1.5 Analytical techniques
The antibacterial assay was carried out using the oxford cup method in 20 cm-diameter Petri dishes[29]. First,pathogenic fungi were placed in a 6 mm diameter lump at the center of 9 cm diameter PDA plate and incubated in the dark at 28 ℃ for 48 h. Then, the Oxford Cups were placed 2.5 cm from the edge of the pathogenic bacteria colony while adding 100 μL of 10-fold diluted fermentation broth and cultured at 28 ℃ for 4 d. Unsterilized water was used as a control. The diameter of the inhibition zone produced by the antagonistic bacteria colony was determined[30]. The diameter of antibacteria was calibrated when the pathogenic fungal colony extended to the edge of the Oxford Cup and the inhibition ratio was calculated using the following equation:
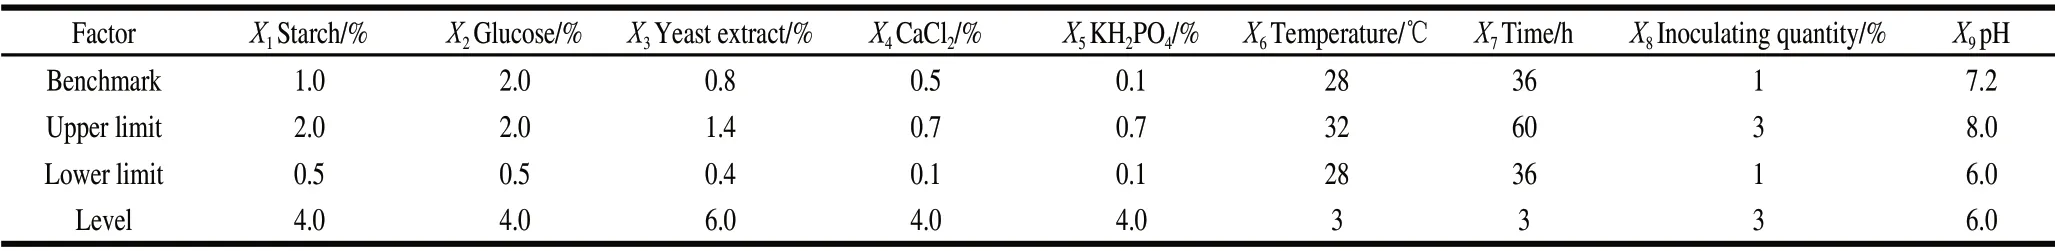
Table 1 Lower and upper levels of nine variables for uniform design
Where: Dcwas copied growth diameter; Ddwas compared growth diameter.
2 Results and Analysis
2.1 Screening the components in the alternative culture medium for fermentation of strain L
The results indicated that the carbon sources obviously affected the synthesis of antimicrobial substances by strain L. Among the various carbon sources tested, strain L produced larger growth inhibitory zones in the presence of soluble starch (15.45 mm diameter), glucose (13.28 mm) and sucrose (10.29 mm) than in the presence of lactose (9.34 mm), maltose (9.51 mm) and trehalose (1.43 mm).
The results of the nitrogen sources showed that strain L. could utilize different forms, both organic and inorganic. Yeast extract favored production of compounds with antimicrobial activity (9.45 mm diameter of inhibition zones), but was not significantly different from the beef extract (7.25 mm). Conversely, little antimicrobial activity was found in media containing NH4NO3, NH4Cl and (NH4)2SO4. Thus, considering the price of raw materials and the antimicrobial activity produced, glucose, soluble starch and yeast extract were used as carbon and nitrogen sources for further experiments.
Microelements were necessary for microbial growth and synthesis of secondary metabolites, is important part of enzymatic activity for improving the organism’s metabolic ability. The antimicrobial activity produced by strain L was enhanced in the presence of CaCl2(14.31 mm), KH2PO4(17.43 mm), and NaCl(12.38 mm), but little antimicrobial activity was found in the medium with ZnCl2(8.25 mm), FeSO4(5.76 mm), MnSO4(2.27 mm), Therefore, CaCl2and KH2PO4were chosen as the microelements for further experimentation (Fig.2).
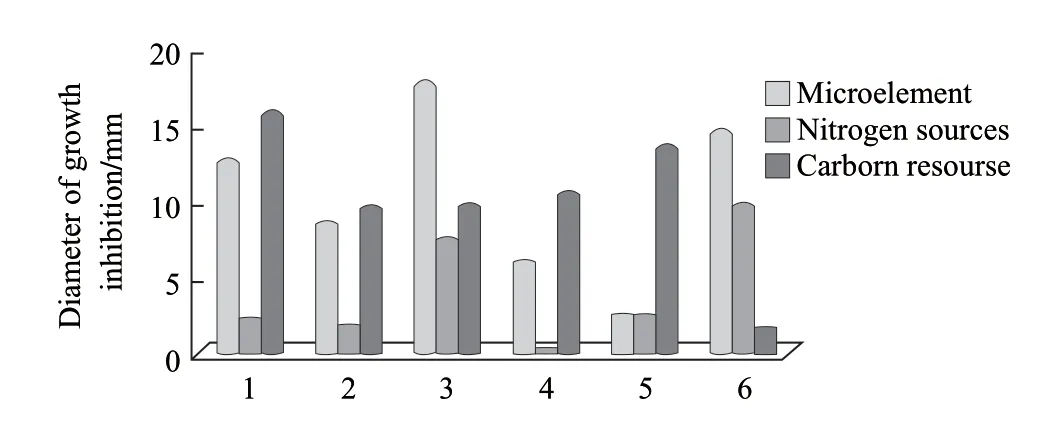
Fig.2 Effect of different carbon, nitrogen and microelement sources on antagonistic activity of strain L
2.2 Optimization of fermentation
2.2.1 First round of uniform design
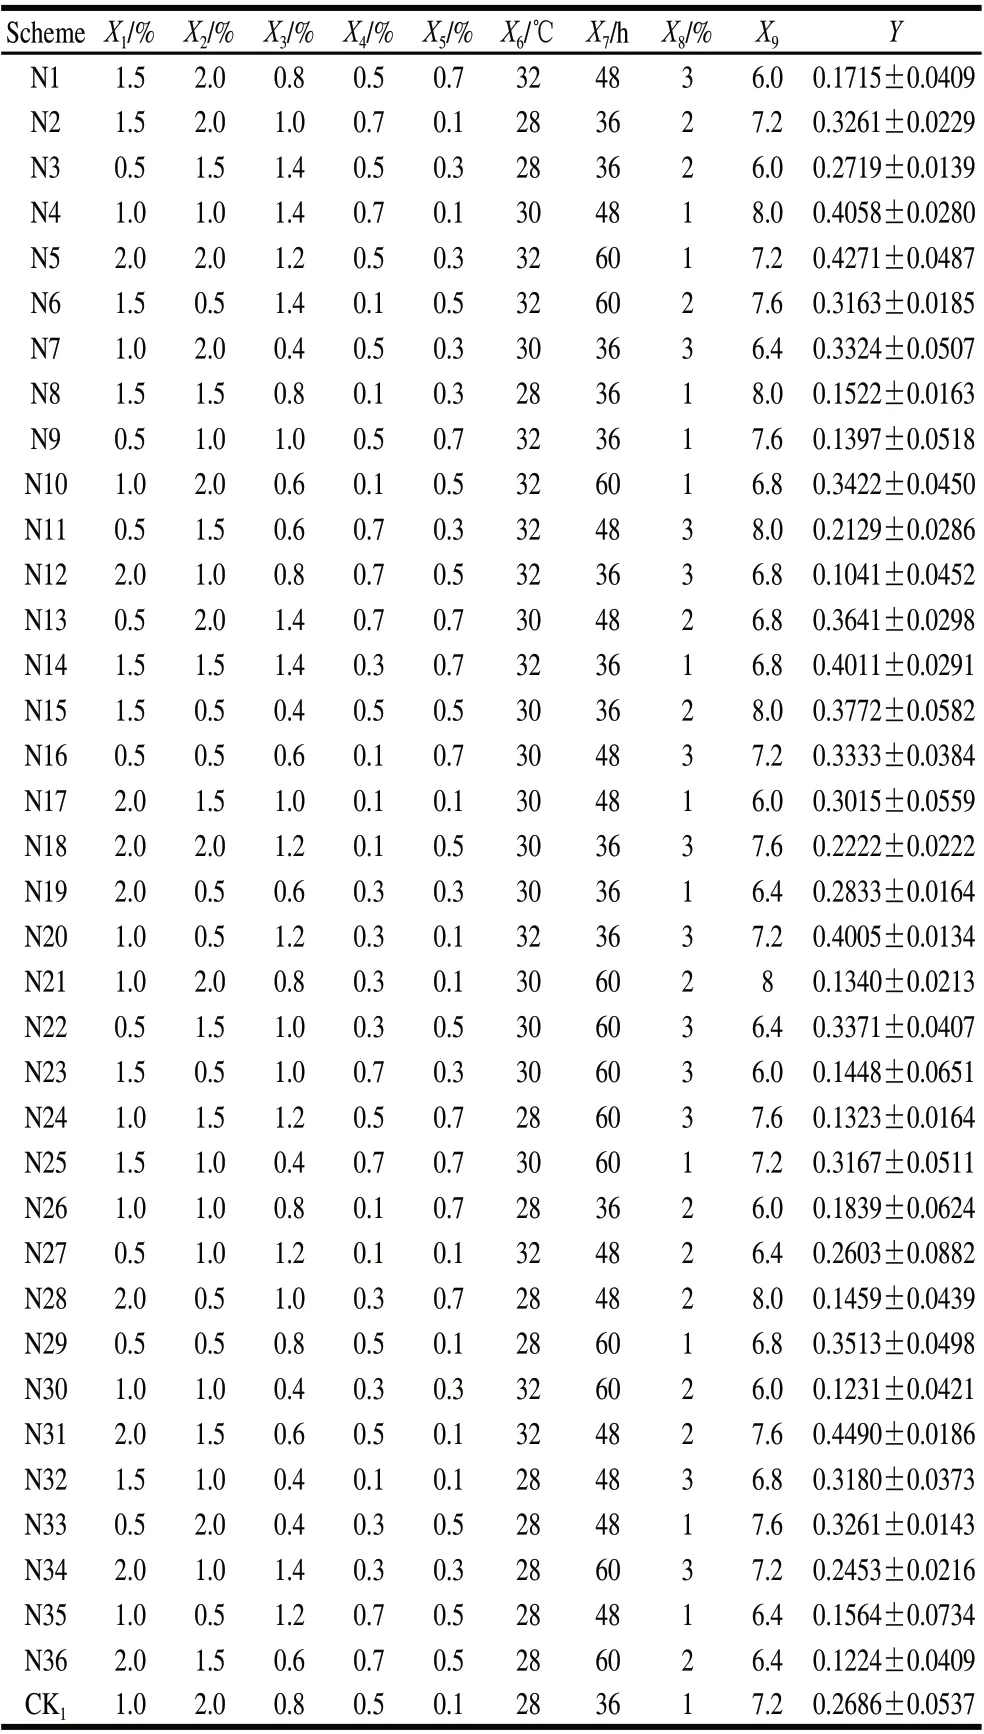
Table 2 Results of the first round of uniform design
Based on Table 1, a total of 36 combinations were chosen in random order according to DPS software configuration for 9 factors. The observed values (Y) were also shown in Table 2. The experimental results showed that the average value of antibacterial activity was 26.84%, the highest value was 44.90% and the lowest value was 13.23%. Most of the results were superior to the benchmark formulation of the single factor 26.86% (CK1), which indicated that there were interactions among these 9 factors. Subsequently, the next round of optimization design was performed.
2.2.2 Optimization of kernel function and nonlinear screen of variables
The common kernel functions include liner kernel function (t=0), polynomial kernel function(t=1), radial basis function (RBF)(t=2) and sigmoid kernel function(t=3). One drawback of SVR was that the selection of kernel function was empirical and short of transcendental theoretical direction. To overcome this drawback, the analysis applied an algorithm and program to automatic select, the optimal kernel function four common kernel functions were cross-validated in turn according to leave-one-out method (LOO), then the optimal kernel function was fixed subsequently with the minimum mean squared error (MSE). Meanwhile, a nonlinear variables selection method was also utilized. Through multi-round last-elimination, the indistinctive variables for improving prediction precision were successively swept from SVR model, which contains all variables, according to minimum MSE and LOO method, and the rest variables were called reserved variables. The other drawback of SVR was poor interpretability. However, the next steps that the reserved variables were compulsorily screened with the multiround last-elimination method and the relative importance order of each reserved variable to prediction precision was given could endow SVR partial interpretability.
According to minimum MSE and LOO, the optimal kernel function was RBF (t=2). By screening nonlinear factors and multi-round last-elimination, X2(glucose), X4(CaCl2), X5(KH2PO4), X6(time), X8(inoculation amount) and X9(pH) were designated as the retention factors while swept X1(starch), X3(yeast extract) and X7(time), and sorted the relative importance according to the impact on predictive accuracy of antibacterial activity Y as X9>X4>X2>X8>X6>X5(0.01 level)(Table 3). The values of X1, X3and X7were fixed to 0.5%, 0.4% and 36 h, respectively, according to analysis of single factor effect after the first round UD.
2.2.3 Model assessment
After the first-round UD, a SVR model was obtained containing 6 input variables (X2, X4, X5, X6, X8, X9), its generalization ability could be evaluated through dual LOO method by the next steps: beginning with RBF (t=2) and 6 reserved variables, one sample was taken out as independent training sample from 36 samples every time, and Gridregression.py (automatically search for the optimal parameters) through LOO method from the rest 35 of 36 samples, then the independent training sample was Svmpredicted after Svmtrained to those 35 samples with optimal parameters c, g, p. The MSE of the predicted results through dual LOO was 0.007555, moreover, the first 5 samples with the highest observed value have an approximate predicted values (Not all data shown). The SVR models mainly focus on predicting precision on those high observed values. If a regression model has good prediction precision for the whole samples but poor for the samples of high yields, it is not reliable for practical application. Hence, through the assessment with dual LOO prediction, the SVR model with RBF (t=2) as the optimal kernel function and X2, X4, X5, X6, X8, X9as reserved variable was reliable and the model was credible[31-35].
2.2.4 Prediction and frequency statistics
The 2736 full combinations samples from X2(4 levels), X4(4 levels), X5(4 levels), X6(3 levels), X8(3 levels), andX9(6 levels) were predicted by the SVR model, which constructed on the basis that RBF (t=2) as the optimal kernel function; glucose (X2), CaCl2(X4), KH2PO4(X5) temperature (X6), inoculating quantity (X8), pH (X9) as reserved variables; 36 samples in Table 2 as the training samples. The highest value of the optimal combinations in 36 samples was 0.4490. Hence, the 61 full combinations samples with predicted inhibition ratio values Y>0.4490 in the 2736 samples were chosen to statistic frequency (j) of certain levels of each factor. The statistic frequency (j) were shown in Table 4. Among 2736 training samples, the optimal combination was X2=2, X4=0.7, X5=0.3, X6=30, X8=1, and X9=6.8, and the corresponding optimal predicted value was 0.52111. Considering the optimal combinations and results shown in Table 4, X2and X4had the highest frequency at the highest level which means the range should be extrapolated respectively; while X9with the two levels 6.8 and 7.2, both had high frequency. So the range could be further determined from 6.8 to 7.2.
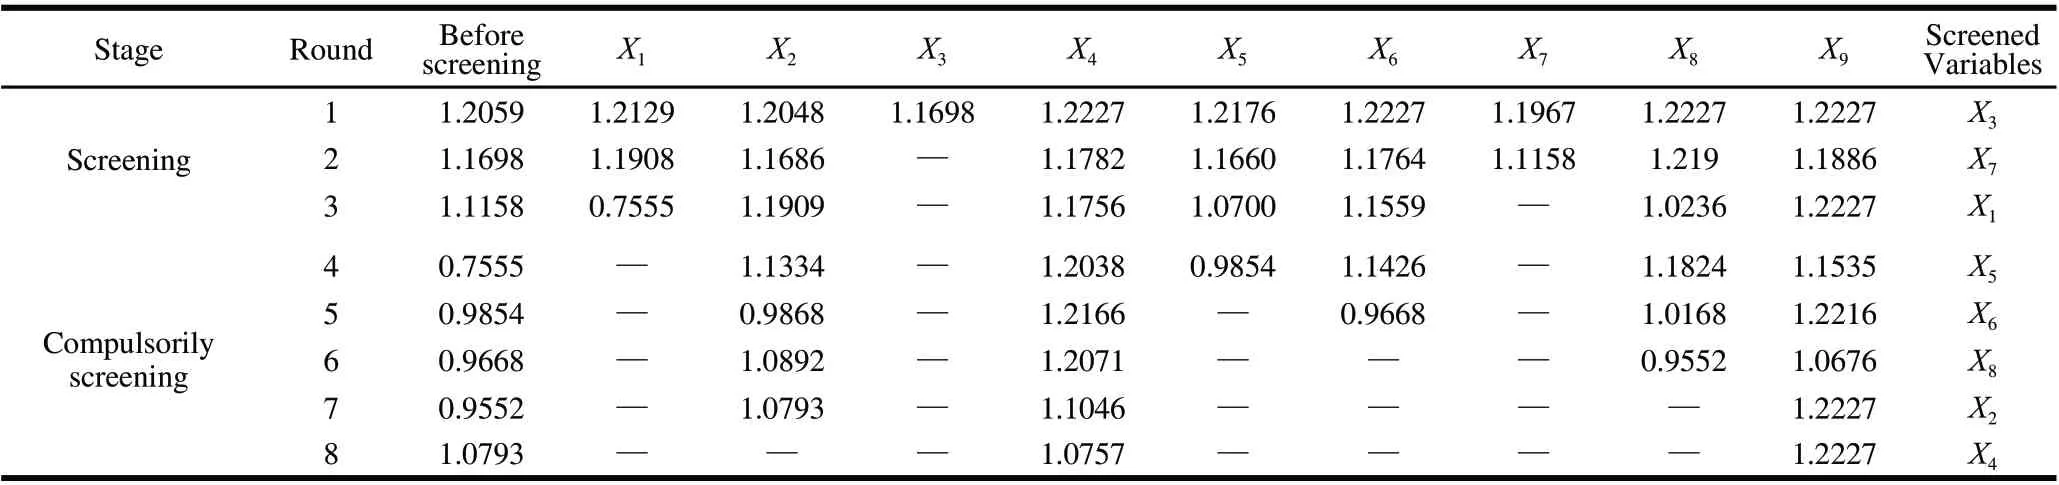
Table 3 Screening of important variables (×100)
X6had higher frequency at the level of 30; X6was fixed at 30 ℃ for convenience. X8had little impact on strain growth, and the predictive inhibition activity reached its maximum when X8was at a minimum value. Based on the nutritional requirements, the consumption of oxygen, and the accumulation of secondary metabolites, X8was set to 1%. And X5had no significant difference among all levels.
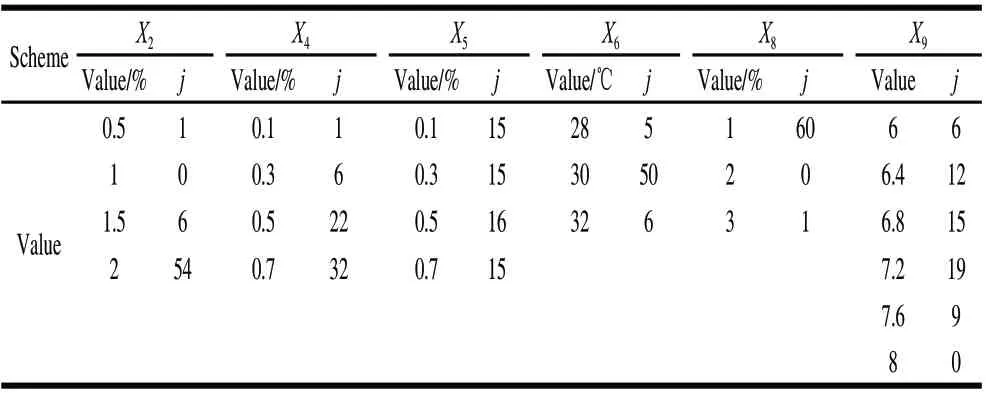
Table 4 Factor frequency statistics for 61 samples with predictive inhibition activity>0.4490
2.2.5 Second round of uniform design
Through the first-round UD and the single-factor effect, 3 variables X1(starch), X3(yeast extract) and X7(time) had been fixed (X1, X3, X7were fixed to 0.5%, 0.4%, 36h). through the statistic frequency and experiment condition, X6and X8were fixed at 30 ℃ and 1%, respectively. The other 4 variables should be further studied.
The upper limits of X2, X4, X5and X9were increased to 3, 1.1, 0.5, and 7.2, respectively, while the lower limits of X5and X9were increased to 0.1 and 6.8, respectively. In the second round of experiments, which were designed according to 4 factors and 3 levels of the uniform design table, combined the optimal formulation of the full combinations, the optimal combination of single factor effect and the optimal combination of frequency optimal, the total combinations were 15. The results are shown in Table 5.
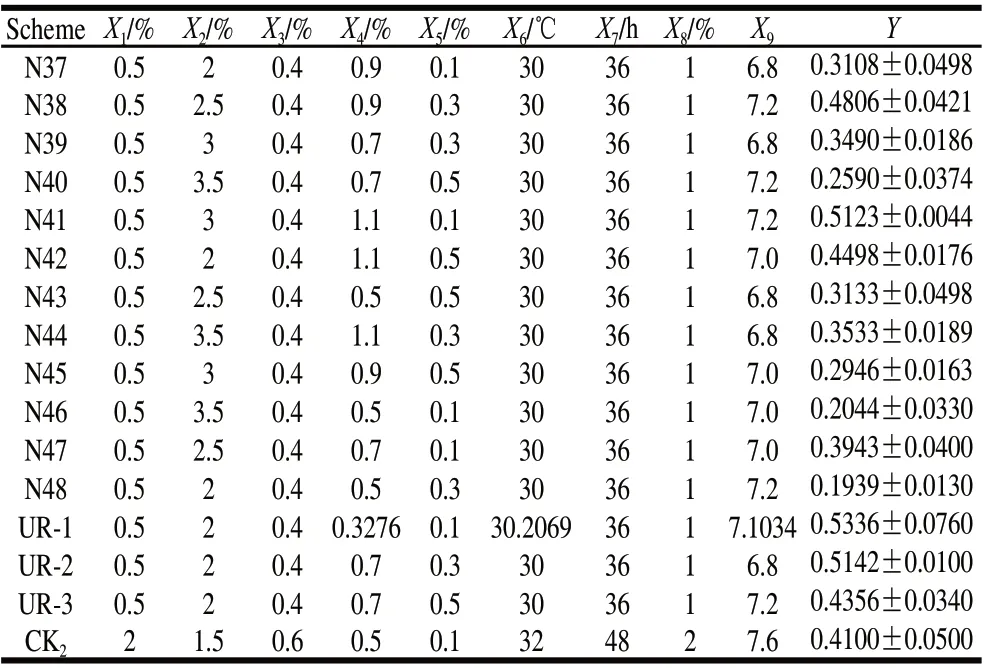
Table 5 Results of the second round of uniform design
The observed values in the second round UD were shown in Table 5. The average value was 0.3828, 11.44% higher than the first round. The highest value of 36 combinations in the first-round uniform design was 0.4490. There were 4 measured values (N38, N41, N47 and N42) higher than the peak value of the first round uniform design. And the predicted maximum 0.5045 (predicted results not shown) and the detected maximum 0.5123 coincide. Conclusively, the success rate of whole prediction could be considered high. In this round of analysis, the importance of reserved variables (X2, X4, X5, X9) was verified from the Table 5. Based on the optimal combination of the second-round uniform design and the optimal formulation single factor effect (UR1), the model deemed that X2, X5and X9could be recognized as 2%, 0.1%, 7.0 respectively, the glucose value extrapolated from 2%, KH2PO4of 0.1%―0.5% and pH 6.8―7.2 were verified through factor optimization with frequency statistics. X4was the only significant variable factor. Therefore, it was meaningless to carry out the whole combinatorial prediction with 1 factor and 3 levels. Through the single factor effect analysis, it was determined that X4was 1.1 in the optimal formula which means the range should be extrapolated respectively. Therefore, we proceeded to a third round of UD as shown in Table 6.
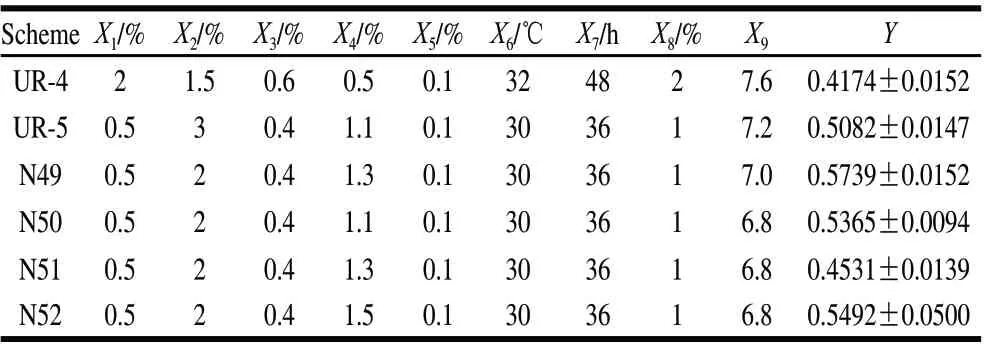
Table 6 Results of the thrid round of uniform design
In the third round of UD directed by SVR, there were two measured values higher than the optimal values in second round UD, combined with the optimal of third round UD and the optimal formulation of single factor effect in Table 6, X4was recognized as 1.3%, the optimal group was N49 having 0.5% starch, 2% glucose, 0.4% yeast extract, 1.3% CaCl2, 0.1% KH2PO4, at 30 ℃, for 36 h, with an inoculation amount of 1% at pH 7.0. And the measured inhibition activity was 0.5739, 20.53% higher than the benchmark formulation of the single factor (Fig.3).

Fig.3 Antagonistic activity of fermentation supernatants of strain L from non-optimized and optimized culture media against A. alternate
3 Conclusion
The different conditions for the antagonistic bacteria strain L showed that all these variables affect the production of antibacterial active compounds, among the effect of 6 variables (pH, glucose, CaCl2, KH2PO4, inoculation amount) was more remarkable than the content of yeast and starch, temperature, time. Through 3 rounds of UD and total 48 schemes, the best fermentation formula and conditions for the antagonistic bacteria strain L were determined to starch 0.5%, glucose 2%, yeast 0.4%, CaCl21.3%, KH2PO40.1%, 30 ℃, 36 h, inoculation amount of 1% and pH 7.0. The inhibitory activity reached 0.5739 of 10-fold diluted fermented liquid, 20.53% higher than the benchmark formulation of the single factor. The optimized medium composition consisted of common materials in industrial production, and the culture conditions in the industrial production was simple to achieve, which provides a theoretical basis for the amplification test of the strain L fermenter and a foundation for further industrial development. In the present study, we simplified the fermentation process, reduced the cost of fermentation, enhanced the antibacterial effect, and confirmed the potential for development of biological pesticides using Bacillus sp.. For optimization of fermentation conditions, UD-SVR was demonstrated to be effective and reliable in finding the optimal culture parameters for the production of antimicrobial compounds by strain L. UD-SVR prediction is highly precise, interpretable, optimal and efficient, which provides a new effective method to solve the multi-level and multi-factor formulas to optimize experimental design and analysis, but its universality still requires further research.
[1] TRONCOSO R, ESPINOZA C, TIZNADO M E. Analysis of the isothiocyanates present in cabbage leaves extract and their potential application to control Alternaria rot in bell chillis[J]. Food Research International, 2005, 38(6): 701-708.
[2] MARI M, GUIZZARDI M. The postharvest phase: emerging technologies for the control of fungal diseases[J]. Phytoparasitica, 1998, 26(1): 59-66.
[3] GRIFFITHS E. Iatrogenic plant diseases[J]. Annual Review of Phytopathology, 1981, 19: 69-82.
[4] LENNOX C L, SPOTTS R A, CERVANTES L A. Populations of Botrytis cinerea and Penicillium spp. on pear fruit, and in orchards and packinghouses, and their relationship to postharvest decay[J]. Plant Disease, 2003, 87: 639-644.
[5] FATMA F A M, MORTADA S M N. Antifungal activity of endophytic fungi isolated from Egyptian henbane (Hyoscyamus muticusl)[J]. Pak J Bot, 2010, 42: 2883-2894.
[6] KRAUSS U, HIDALGO E, BATEMAN R, et al. Improving the formulation and timing of application of endophytic biocontrol and chemical agents against frosty pod rot (Moniliophthora roreri) in cocoa (Theobroma cacao)[J]. Biological Control, 2010, 54: 230-240.
[7] WU J, ZHU F, XU J. Optimization on the extraction of polysaccharides from fructus corni using uniform design[J]. Procedia Engineering, 2011, 24: 484-489.
[8] SCHULTHESS T C, BUTLER W H. Consequences of spin-flop coupling in exchange biases films[J]. Physical Review Letters, 1998, 81: 4516-4519.
[9] ARNOLD A E, MAYNARD Z, GILBERT G S, et al. Are tropical fungal endophytes hyperdiverse?[J]. Ecologyl Letters, 2000, 3(4): 267-274.
[10] LAM K S, MATTEI J, FORENZA S. Carbon catabolite regulation of rebeccamycin production in Saccharothrix aerocolonigenes[J]. Journal of Industrial Microbiology, 1989, 4(2): 105-108.
[11] INGARAO G, LORENZO R D. A new progressive design methodology for complex sheet metal stamping operations: coupling spatially differentiated restraining forces approach and multi-objective optimization[J]. Computers and Structures, 2010, 88(9/10): 625-638.
[12] RATNAM B V V, RAO M N, RAO M D, et al. Optimization of fermentation conditions for the production of ethanol from sago starch using response surface methodology[J]. Word Journal of Microbiology Biotechnology, 2003, 19(5): 523-526.
[13] BOURGUND U, BUCHER C G. A fast and efficient response surface approach for structural reliability problems[J]. Structural Safety, 1990, 7(1): 57-66.
[14] FANG K T, LIN D K J, WINKER P, et al. Uniform design: theory and application[J]. American Statistical Association, 2000, 42(3): 237-248.
[15] XIA L, GONG Z, WANG S F. Study on photocatalytic degradation of organic compounds wastewater with the method of uniform experimental design[J]. Chemistry and Bioengineering, 2005, 2: 13-20.
[16] HUANG C M, LEE Y J, LIN D K J, et al. Model selection for support vector machines via uniform design[J]. Computational Statistics and Data Analysis, 2007, 52(1): 335-346.
[17] ROSIPAL R, TREJO L J. Kernel partial least squares regression in reproducing kernel hilbert space[J]. the Journal of Machine: Learning Research, 2002, 1(2/3): 97-123.
[18] CHAKRABORTY K, MEHROTRA K, MOHAN C K, et al. Forecasting the behavior of multivariate time series using neural networks[J]. Neural Networks, 1992, 5(6): 961-970.
[19] LIANG Y C, SUN Y F. An improved method of support vector machine and its applications to financial time series forecasting[J]. Progress in Natural Science, 2003, 13(9): 696-700.
[20] DENG N Y, TIAN Y J. Support vector machine-a new method in data mining[M]. Beijing: Science Press, 2004: 177-162; 224-272.
[21] WANG Xian, LI Ao, JIANG Zhaohui, et al. Missing value estimation for DNA microarray gene expression data by support vector regression imputation and orthogonal coding scheme[J]. BMC Bioinformatics, 2006, 7:32, doi: 10. 1186/1471-2105-7-32.
[22] YUAN Z H, HUANG B X. Prediction of protein accessible surface areas by support vector regression[J]. Proteins: Structure, Function, and Bioinformatics, 2004, 57(3): 558-564.
[23] MA G L, CHENG Y Y. Predicting Caco-2 permeability using support vector machine and chemistry development kit[J]. J Pharm Pharm Sci, 2006, 9: 210-221.
[24] LISBOA P J, TAKTAK A F G. The use of artificial neural networks in decision support in cancer: a systematic review[J]. Neural networks, 2006, 19(4): 408-415.
[25] WANG L F, TAN X S, BAI L Y, et al. Establishing an interpretability system for support vector regression and its application in QSAR of organophosphorus insecticide[J]. Asian J Chem, 2012, 24: 1575-1578.
[26] CHANG C C, LIN C J. LIBSVM: a library for support vector machines[J]. ACM Transactions on Intelligent Systems and Technology, 2011, 2(3): 27-31.
[27] MENG J C. Support vector regression model for measuring the permittivity of asphalt concrete[J]. Microwave and Wireless Components Letters, 2007, 17(12): 819-821.
[28] WU Q, LIU W Y, YANG Y H. Electric power system transient stability on-line prediction based on least squares support vector machine[J]. Proceedings of the CSEE, 2007, 27: 40-43.
[29] CHO K M, HONG S Y, LEE S M, et al. Endophytic bacterial communities in ginseng and their antifungal activity against pathogens[J]. Microbial Ecology, 2007, 54(2): 341-351.
[30] HULTMARK D, STEINER H, RASMUSON T, et al. Insect immunity purification and properties of 3 inducible bactericidal proteins from hemolymph of immunized pupae of hyalophora-cecropia[J]. European Journal of Biochemistry, 1980, 106(1): 157-161.
[31] CHERKASSKY V, MA Y. Practical selection of SVM parameters and noise estimation for SVM regression[J]. Neural Network, 2004, 17(1): 113-126.
[32] MOMMA M, BENNETT K P. A pattern search method for model selection of support vector regression[M]//KUMAR V, MANNILA H, MOTWANI R. Proceedings of the Second Siam International Conference on Data Mining, SIAM, Philadelphia, USA, 2002.
[33] CHERKASSKY V, MA Y Q. Comparison of model selection for regression[J]. Neural Computation, 2003, 15(7): 1691-1714.
[34] CHAPELLE O, VAPNIK V, BENGIO Y. Model selection for small sample regression[J]. Machine Learning, 2002, 48(1/3): 9-23.
[35] ZHAO W, CHEN C H, LIU Q, et al. Optimization of medium for thermostable α-amylase fermentation using Minitab[J]. Journal of Central South University: Science and Technology, 2010, 41(5): 1653-1657.
猜你喜欢
粮油食品科技(2022年6期)2022-11-25
乳业科学与技术(2021年6期)2021-12-17
甘肃教育(2021年10期)2021-11-02
今日农业(2021年13期)2021-08-14
东北农业大学学报(2020年3期)2020-05-14
塑料助剂(2019年3期)2019-07-24
生物技术通报(2019年2期)2019-03-15
四川农业大学学报(2018年5期)2018-11-09
天然产物研究与开发(2018年7期)2018-08-21
西藏大学学报(自然科学版)(2015年1期)2015-12-29