
Assessment of tumor response to chemotherapy in patients with breast cancer using18F-FLT: a meta-analysis
2014-03-21 02:55ShengMingDengWeiZhangBinZhangYiWeiWu
Sheng-Ming Deng, Wei Zhang, Bin Zhang,3, Yi-Wei Wu
1Department of Nuclear Medicine, The First Affliated Hospital of Soochow University, Suzhou 215000, China;2School of Radiation Medicine and Protection, Medical College of Soochow University, Suzhou 215000, China;3Key Laboratory of Nuclear Medicine, Ministry of Health, Jiangsu Key Laboratory of Molecular Nuclear Medicine, Jiangsu Institute of Nuclear Medicine, Wuxi 214000, China
Correspondence to: Bin Zhang. Department of Nuclear Medicine, The First Affliated Hospital of Soochow University, Suzhou 215000, China. Email: zbnuclmd@126.com.
Assessment of tumor response to chemotherapy in patients with breast cancer using18F-FLT: a meta-analysis
Sheng-Ming Deng1,2,3, Wei Zhang1, Bin Zhang1,3, Yi-Wei Wu1
1Department of Nuclear Medicine, The First Affliated Hospital of Soochow University, Suzhou 215000, China;2School of Radiation Medicine and Protection, Medical College of Soochow University, Suzhou 215000, China;3Key Laboratory of Nuclear Medicine, Ministry of Health, Jiangsu Key Laboratory of Molecular Nuclear Medicine, Jiangsu Institute of Nuclear Medicine, Wuxi 214000, China
Correspondence to: Bin Zhang. Department of Nuclear Medicine, The First Affliated Hospital of Soochow University, Suzhou 215000, China. Email: zbnuclmd@126.com.
Purpose:To determine the diagnostic performance of 3'-deoxy-3'-18F-fuorothymidine positron emission tomography/computed tomography (FLT PET/CT) and FLT PET for evaluating response to chemotherapy in patients with breast cancer.
Methods:Databases such as PubMed (MEDLINE included) and excerpta medica database (EMBASE), were searched for relevant original articles. The included studies were assessed for methodological quality with quality assessment of diagnosis accuracy studies (QUADAS) score tool. Histopathological analysis and/or clinical and/or radiological follow-up for at least 6 months were used as the reference standard. The data were extracted by two reviewers independently to analyze the sensitivity, specifcity, summary receiver operating characteristic (SROC) curve, area under the curve (AUC), and heterogeneity.
Results:The present study analyzed a total of 4 selected articles. The pool sensitivity was 0.773 [95% confdence interval (CI): 0.594-0.900]. The pooled specifcity was 0.685 (95% CI: 0.479-0.849) on basis of FEM. The pooled LR+, LR-, and DOR were 2.874 (1.492-5.538), 0.293 (0.146-0.589), and 14.891 (3.238-68.475), respectively. The AUC was 0.8636 (±0.0655), and the Q* index was 0.7942 (±0.0636).
Conclusions:Our results indicate that18F-FLT PET/CT or PET is useful to predict chemotherapy response in breast cancer with reasonable sensitivity, specificity and DOR. However, future larger scale clinical trials will be needed to assess the regimen of18F-FLT PET/CT or PET in monitoring the response to chemotherapy in breast cancer patients.
Breast cancer;18F-FLT PET; chemotherapy; meta-analysis
View this article at:http://dx.doi.org/10.3978/j.issn.1000-9604.2014.08.17
Introduction
Breast cancer is a leading cause of cancer death in women in the world, accounting for 23% of the total cancer cases and 14% of the cancer deaths (1). Chemotherapy is a widely accepted treatment for breast cancer. However, many patients will still be incurable despite the significant advances in treatment. There is a need to develop imaging methodologies that can enable early and objective assessment of response to chemotherapy. Currently, treatment responses are assessed on the basis of measurement of tumor size before and after treatment with serial conventional radiography, such as chest X-ray, computed tomography (CT) or magnetic resonance imaging (MRI) (2). However, response monitoring by conventional methods is recommended after 2-3 cycles of chemotherapy. Patients with breast cancer receiving chemotherapy cannot beneft from conventional radiography, since ineffective treatment could not be timely detected and replaced.
A potential novel way of response monitoring is by molecular imaging positron emission tomography (PET) imaging with 3'-deoxy-3'-18F-fluorothymidine (18F-FLTPET).18F-FLT is a pyrimidine nucleoside that is a substrate for the cytoplasmic enzyme, thymidine kinase 1 (TK1). TK1 phosphorylates18F-FLT into a highly charged product which is trapped and can be imaged using PET (3). Recently, some studies evaluated the ability of this tracer to monitor response in breast cancer. However, the numbers of cases in studies were insufficient. Thus, we perform a meta-analysis to review the update relevant literature, and assess the diagnostic role of18F-FLT PET for evaluating response to chemotherapy in patients with breast cancer.
Materials and methods
Literature search
A systematic literature search was performed to fnd articles that evaluate the response of breast cancer to chemotherapy. Two investigators (BZ and SMD) independently searched the PubMed (MEDLINE included) database, EMBASE to identify relevant studies published from January 1, 1993 to October 1, 2013. It was performed with no language restrictions and limited to human studies. The key words used were (“positron emission tomography” OR “PET” OR“positron emission tomography/computed tomography”OR “PET/CT” OR “PET-CT” OR “positron emission tomography-computed tomography” OR “thymidine” OR“fluorothymidine” OR “deoxy-thymidine” OR “deoxy-lthymidine” OR “18F-fluorodeoxy-L-thymidine” OR “3’-deoxy-3’- fluorothymidine” OR “fluorodeoxythymidine”OR “FLT” OR “18F-FLT” OR “18FLT”) AND (“breast cancer” OR “breast carcinoma” OR “breast neoplasm” OR“breast neoplasia” ) AND (“prediction” OR “response”OR “response monitoring” OR “chemotherapy” OR“neoadjuvant”) AND (“sensitivity” OR “specificity” OR“false negative” OR “false positive” OR “accuracy”). The list of articles was supplemented with extensive cross checking of the reference lists of all retrieved articles.
Study identi fi cation and selection
The inclusion criteria were as follows:
(I) The study investigated the performance of FLT PET/ CT or PET for evaluating chemotherapy in patients with proven breast cancer;
(II) Histopathological analysis and/or clinical and/or radiological follow-up for at least 6 months were used as the reference standard;
(III) The reported primary data were suffcient to calculate the totals of true and false positives and negatives;
(IV) The study included more than nine lesions or patients with histological breast cancer;
(V) When data or subsets of data were presented in more than one article, the one with most details was chosen.
Studies were excluded based on the following criteria:
(I) Animal studies, case report, abstracts, reviews, letters, editorials, comments, in vitro studies, studies without raw data;
(II) PET/CT or PET examination used other radiotracers. Discrepancies in judgment were resolved after discussion.
Data extraction and quality assessment
Data collected from the individual studies included: authors, year of publication, sample size, age, study design, initial clinical stage, timing for PET scans, cutoff values, defnition of positive PETs, number of responders and nonresponders, characteristics of PET/CT or PET imaging, interpretation of the reference standard, and clinical and/ or radiological follow-up. The numbers of true and false positives and negatives were also recorded.
The quality assessment of diagnosis accuracy studies (QUADAS) tool was selected to assess the methodological quality of the studies (4,5). QUADAS consists of 14 questions for assessing different categories of bias in a study. If the answer is “yes” then score “1”, and if the answer is“no” or “unclear” then score “0”. Two observers (BZ and SMD) independently assessed the methodological quality. A consensus was reached to resolve any differences between the two reviewers.
Statistical analysis
Two reviewers constructed 2×2 contingency tables for each study independently. For studies with zeroes in 1 or more cells, 0.5 was added to all four cells of the 2×2 table. Data on the sensitivity, specifcity, positive likelihood ratio (LR+), negative likelihood ratio (LR-), diagnostic odds ratio (DOR), and 95% confdence intervals (CI) were calculated according to the numbers from the original publications. The summary receiver operating characteristic (SROC) curves and Q* index (Q* index is defned by the point where sensitivity and specifcity are equal) were also obtained.

Figure 1 Flow diagram for selection of studies.
The presence of heterogeneity among different studies was analyzed by chi-square test and quantifed by calculating the I2statistic with the equation: I2= (Q-df)/Q. Statistical heterogeneity was defined as an I2statistic value of more than 50% (6). According to the heterogeneity, a fxed effects model (FEM) was adopted to calculate the diagnostic indexes if homogeneity existed among different effect sizes, and a random effects model was adopted if heterogeneity existed.
All analyses were executed using, Microsoft Excel 2003 (Microsoft, Seattle, WA, USA), and Meta-Disc (version 1.4) software package (7). Meta-Disc is a freeware for performing a systematic review of diagnosis and screening tests, produced by Javier Zamora, free available at http:// www.hrc.es/investigacion/metadisc_en.htm, Madrid, Spain.
Results
Search strategy and study selection
A total of 4,428 abstracts were identifed by computer search and extensive cross-checking of reference lists. Twelve articles were considered as candidates after the perusal of titles and abstracts. After reading the full texts of the remaining 12 articles, 8 were excluded due to different reasons. Finally, four articles were identifed as eligible, all of which were obtained with full-texts. The flow diagram for the selection of the studies is presented in Figure 1.
Methodological quality assessment
On basis of the results of the “QUADAS” quality assessment, all studies met at least 11 of the 14 standards. However, no study met all the 14 questions (Table 1). The main weakness was the execution of reference standard was not described in suffcient detail. Actually, a “clinical and/or radiological follow-up” was introduced as reference standard for all the four studies instead of “histopathological analysis”. Another weakness was blind interpretation of PET or reference standard results. In 2 of the 4 included studies, the time period between reference standard and PET was not short enough for using “follow-up” as standard criteria.
The characteristics of the studies
Characteristics of the four eligible studies included in the meta-analysis are outlined in Table 2. All were in English. There were total 46 patients in the selected studies with ages ranging 18-80 years. The sample size of the studies ranged from 6 to 18. In two studies, several patients had more than one tumor site; therefore, a total of 54 tumors were assessed in the meta-analysis.
There were three studies on PET and 1 on PET/CT. All studies performed a sequential PET or PET/CT both before and after the chemotherapy. All articles assessed treatment of same chemotherapy except one study also using endocrine therapy. In 1 study, an increase in tumor18F-FLT uptake was selected as the cutoff criterion for response to chemotherapy after 1 hour of initiation of chemotherapy. The other 3 studies relied on reduction of18F-FLT uptake as PET or PET/CT criteria for therapy response.
Data analysis
Across all four included studies evaluating18F-FLT PET/ CT or PET, we used a FEM to calculate pooled sensitivity, specifcity, LR+, LR–, and DOR on the basis of statistical non-heterogeneity (Figures 2-6). The sensitivity of18F-FLT PET/CT or PET to assess chemotherapy response in breast cancer ranged from 56.3% to 92.9%. The pool sensitivity was 77.3%. The specificity ranged from 45.8% to 91.7%. The pooled specifcity was 68.5%. The detailed sensitivity, specificity, LR+, LR–, and DOR with 95% of CI for individual studies are presented in Table 3.
The SROC curves with Q* index are shown in Figure 7. Of all four studies, the AUC (± standard error) was 0.8636 (±0.0655), the Q* index was 0.7942 (±0.0636).
Discussion


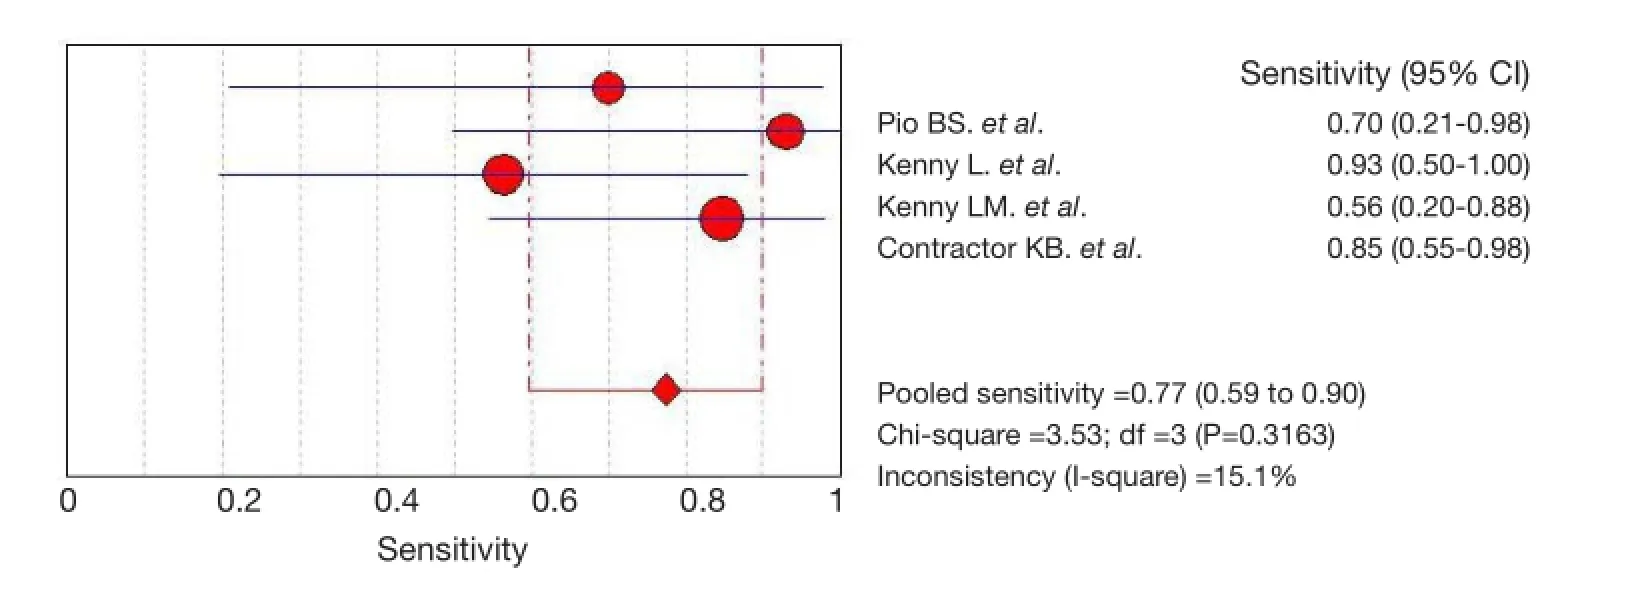
Figure 2 Pooled and individual studies estimating the sensitivity of18F-FLT PET or PET/CT in monitoring response to chemotherapy in breast cancer. Studies are identifed by the name of frst author to the right of the graph. PET, positron emission tomography; CT, computed tomography.

Figure 4 Pooled and individual studies estimating the LR+ of18F-FLT PET or PET/CT in monitoring response to chemotherapy in breast cancer. Studies are identifed by the name of frst author to the right of the graph. PET, positron emission tomography; CT, computed tomography.

Figure 5 Pooled and individual studies estimating the LR- of18F-FLT PET or PET/CT in monitoring response to chemotherapy in breast cancer. Studies are identifed by the name of frst author to the right of the graph. PET, positron emission tomography; CT, computed tomography.

Figure 6 Pooled and individual studies estimating the DOR of18F-FLT PET or PET/CT in monitoring response to chemotherapy in breast cancer. Studies are identifed by the name of frst author to the right of the graph. PET, positron emission tomography; CT, computed tomography.
Recently, whole-body imaging with fluorine-18 fluorodeoxyglucose positron emission tomography (FDGPET) has gained widespread acceptance for assessing tumor response to chemotherapy in patients with breast cancer (12-14). However, it has been demonstrated that inflammatory tissues can accumulate18F-FDG and that chemotherapy-induced inflammation can lead to misinterpretation of results.18F-FLT has been used to demonstrate proliferative activity in various tumors. Most researchers have demonstrated that18F-FLT is more specific than18F-FDG for malignant tumors and is not susceptible to uptake due to inflammatory changes (15). Moreover,18F-FLT PET images showed high tumor-tobackground contrast. In a meta-analysis, 19 studies with total 786 breast cancer patients who received neoadjuvant treatment were included (16). In 15 studies18F-FDG PET scan was performed before and at different moments during chemotherapy. The pooled analysis showed that18F-FDG PET with a sensitivity of 84% and a DOR of 11.9 have a beneficial value to assess response of chemotherapy. However, the specifcity (66%) is relatively low. Our statistical results confirmed that18F-FLT PET/ CT or PET has an important role in assessing response to chemotherapy in breast cancer, with relatively lower pooled sensitivity (77.3%), higher pooled specificity (68.5%) and DOR (14.891).
There were also drawbacks of18F-FLT. Firstly,18F-FLT PET or PET/CT had low sensitivity for the detection of regional lymph node metastases, which may be related to the lower uptake of18F-FLT compared with18F-FDG. Thus18F-FLT scans showed more false-negative findings compared with18F-FDG scans. Secondly, there was no standard regimen of18F-FLT PET or PET/CT for assessing response to chemotherapy in breast cancer. The optimal moment of scanning, the quantifcation method and cutoff value of PET are issues. Most studies demonstrated that a decrease in18F-FLT uptake after treatment of malignant tumors (8,9,11,17). SUV reduction rate wasrecommended as PET or PET/CT criterion. However, the increase in18F-FLT uptake after treatment was also reported (10,18,19). In one included study, a repeat18F-FLT PET was performed to assess the response and an increase in tumor18F-FLT uptake was selected as the criterion of PET. Since no statistical heterogeneity was identifed in this study, we did not performed subgroup analyses.

Table 3 True and false positives and negatives associated with the sensitivity, specifcity, accuracy, and diagnostic odds ratios for the metaanalysis of chemotherapy assessment
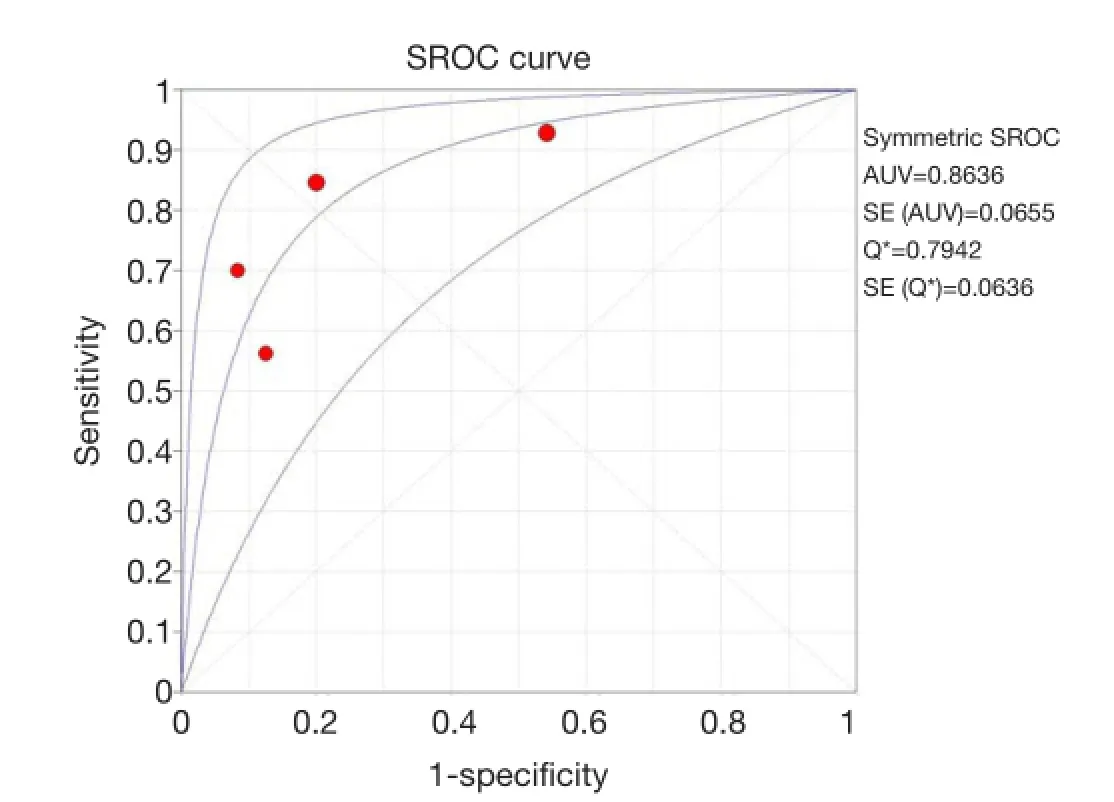
Figure 7 The SROC curve for18F-FLT PET or PET/CT. Solid circle represents each study in the meta-analysis. The size of the circle indicates the study size. SROC, summary receiver operating characteristic. PET, positron emission tomography; CT, computed tomography.
There are some limitations with the present study. Firstly, the number of studies is small. It may lead to imprecise and inconclusive results. Secondly, there was verification bias or workup bias, because not all patients were subjected to the same reference test. The most valid reference test for response of chemotherapy is histopathology. But not all patients and lesions were biopsied consistently. Therefore, the present study used histopathological analysis and/or close clinical and/or radiological follow-up for at least 6 months as reference standard. Other potential limitations include publication bias, selector bias.
Conclusions
To our knowledge, this is the first report using metaanalysis to assess the overall diagnostic role of18F-FLT PET or PET/CT for evaluating response to chemotherapy in patients with breast cancer. As examined by the QUADAS tool, methodological quality of reports was relatively high. Despite some limitations, meta-analysis demonstrated a benefcial value of18F-FLT PET or PET/CT to monitor the response to chemotherapy in breast cancer, with reasonable sensitivity, specifcity and DOR. Studies with larger scale are warranted to further assess the regimen of18F-FLT PET.
Acknowledgements
This study was supported by the Open Program of Key Laboratory of Nuclear Medicine, Ministry of Health and Jiangsu Key Laboratory of Molecular Nuclear Medicine (KF201305 and KF201306), Science and Technology Development Program of Suzhou (SYSD2013076).
Disclosure: The authors declare no confict of interest.
1. Jemal A, Bray F, Center MM, et al. Global cancer statistics. CA Cancer J Clin 2011;61:69-90.
2. Cardoso F, Harbeck N, Fallowfeld L, et al. Locally recurrent or metastatic breast cancer: ESMO Clinical Practice Guidelines for diagnosis, treatment and followup. Ann Oncol 2012;23 Suppl 7:vii11-9.
3. Rasey JS, Grierson JR, Wiens LW, et al. Validation of FLT uptake as a measure of thymidine kinase-1 activity in A549 carcinoma cells. J Nucl Med 2002;43:1210-7.
4. Whiting P, Rutjes AW, Reitsma JB, et al. The development of QUADAS: a tool for the quality assessment of studies of diagnostic accuracy included in systematic reviews. BMC Med Res Methodol 2003;3:25.
5. Whiting PF, Weswood ME, Rutjes AW, et al. Evaluation of QUADAS, a tool for the quality assessment of diagnostic accuracy studies. BMC Med Res Methodol 2006;6:9.
6. Higgins JP, Thompson SG, Deeks JJ, et al. Measuring inconsistency in meta-analyses. BMJ 2003;327:557-60.
7. Zamora J, Abraira V, Muriel A, et al. Meta-DiSc: a software for meta-analysis of test accuracy data. BMC Med Res Methodol 2006;6:31.
8. Pio BS, Park CK, Pietras R, et al. Usefulness of 3'-[F-18]fuoro-3'-deoxythymidine with positron emission tomography in predicting breast cancer response to therapy. Mol Imaging Biol 2006;8:36-42.
9. Kenny L, Coombes RC, Vigushin DM, et al. Imaging early changes in proliferation at 1 week post chemotherapy: a pilot study in breast cancer patients with 3'-deoxy-3'-[18F] fuorothymidine positron emission tomography. Eur J Nucl Med Mol Imaging 2007;34:1339-47.
10. Kenny LM, Contractor KB, Stebbing J, et al. Altered tissue 3'-deoxy-3'-[18F]fuorothymidine pharmacokinetics in human breast cancer following capecitabine treatment detected by positron emission tomography. Clin Cancer Res 2009;15:6649-57.
11. Contractor KB, Kenny LM, Stebbing J, et al. [18F]-3'Deoxy-3'-fuorothymidine positron emission tomography and breast cancer response to docetaxel. Clin Cancer Res 2011;17:7664-72.
12. Park JS, Moon WK, Lyou CY, et al. The assessment of breast cancer response to neoadjuvant chemotherapy: comparison of magnetic resonance imaging and18F-fuorodeoxyglucose positron emission tomography. Acta Radiol 2011;52:21-8.
13. Dose-Schwarz J, Tiling R, Avril-Sassen S, et al. Assessment of residual tumour by FDG-PET: conventional imaging and clinical examination following primary chemotherapy of large and locally advanced breast cancer. Br J Cancer 2010;102:35-41.
14. Schneider-Kolsky ME, Hart S, Fox J, et al. The role of chemotherapeutic drugs in the evaluation of breast tumour response to chemotherapy using serial FDG-PET. Breast Cancer Res 2010;12:R37.
15. Lee TS, Ahn SH, Moon BS, et al. Comparison of 18F-FDG, 18F-FET and 18F-FLT for differentiation between tumor and infammation in rats. Nucl Med Biol 2009;36:681-6.
16. Wang Y, Zhang C, Liu J, et al. Is18F-FDG PET accurate to predict neoadjuvant therapy response in breast cancer? A meta-analysis. Breast Cancer Res Treat 2012;131:357-69.
17. Wieder HA, Geinitz H, Rosenberg R, et al. PET imaging with [18F]3'-deoxy-3'-fuorothymidine for prediction of response to neoadjuvant treatment in patients with rectal cancer. Eur J Nucl Med Mol Imaging 2007;34:878-83.
18. Direcks WG, Berndsen SC, Proost N, et al. [18F]FDG and [18F]FLT uptake in human breast cancer cells in relation to the effects of chemotherapy: an in vitro study. Br J Cancer 2008;99:481-7.
19. Lee SJ, Kim SY, Chung JH, et al. Induction of thymidine kinase 1 after 5-fuorouracil as a mechanism for 3'-deoxy-3'-[18F]fuorothymidine fare. Biochem Pharmacol 2010;80:1528-36.
Cite this article as:Deng SM, Zhang W, Zhang B, Wu YW. Assessment of tumor response to chemotherapy in patients with breast cancer using18F-FLT: a meta-analysis. Chin J Cancer Res 2014;26(5):517-524. doi: 10.3978/j.issn.1000-9604.2014.08.17
10.3978/j.issn.1000-9604.2014.08.17
Submitted Jun 16, 2014. Accepted for publication Aug 05, 2014.
 Chinese Journal of Cancer Research2014年5期
- Chinese Journal of Cancer Research的其它文章
- Clinical significance of stanniocalcin expression in tissue and serum of gastric cancer patients
- The safety parameters of the study on intraductal cytotoxic agent delivery to the breast before mastectomy
- Experimental study on enhancement of the metastatic potential of portal vein tumor thrombus-originated hepatocellular carcinoma cells using portal vein serum
- Prognostic prediction in gastric cancer patients without serosal invasion: comparative study between UICC 7thedition and JCGS 13thedition N-classification systems
- Value of18F-FDG PET/CT and MRI in diagnosing primary endometrial small cell carcinoma
- Dermatosis as the initial presentation of gastric cancer: two cases