侧向类随钻测井仪器垂直分辨率分析
2014-04-23 07:03李启明李安宗孔亚娟李传伟周强朱军
测井技术 2014年5期
李启明,李安宗,孔亚娟,李传伟,周强,朱军
(1.美国Oliden技术有限公司,美国 德克萨斯 77478;2.中国石油集团测井有限公司,陕西 西安 710054)
0 Ⅰntroduction
Vertical resolution of a logging tool is a key to resolve thin rock formation layers and locate the positions of their boundaries to properly evaluate the quality of the hydro-carbon bearing formation.This fundamental specification is important to the designer of the logging tools as well as petrophysicists for understanding the logging responses and processing and interpreting the logs to perform the proper formation evaluation.As thick reservoirs are more and more difficult to find,a significant amount of effort has been devoted over the last 20 years to address thin-bed pay through properly designing new logging tools with better vertical resolution and developing focusing and signal processing techniques to increase the vertical resolutions of existing logging tools[1].
Due to the differences inmeasurement physics of different logging tools and for historical reasons,a universally accepted definition of tool vertical resolution in the logging industry does not exist.Schlumberger’s Oilfield Glossary provides three different definitions for the vertical resolution:one from the view point of tool vertical response function which Theys calls quantitative vertical resolution[2-3],another for the ability to detect the existence of a thin bed,and lastly,for the ability to resolve two closely spaced thin beds which Theys calls qualitative vertical resolution[2-3].Each of these three definitions addresses a valid and often independent attribute of a logging tool.
A widely accepted definition for the quantitative vertical resolution is the minimum bedding thicknessfor which the tool can read 90%of the true formation value within the bed,although Theys requires the tool reading to be 100%of the true value[2-3]. The accepted definition for the quantitative vertical resolution is“the minimum distance between two events that the tool can resolve,”meaning two events can be clearly differentiated from each other in the tool readings.
The implicit assumption in all of these definitions is that the tool response is relatively local,i.e.,the formation right in front of the sensors alone determines the tool reading and vertical space of these contribution in the formation is a reflection of the vertical sensitivity of the tool.For most of the logging tools,this is quite true.For example,for induction logging tools,one has a well-defined vertical response function that decays rapidly away from the transmitter and receiver location.For nuclear logging tools such as the neutron porosity and gamma-gamma density measurements,particles from the source get absorbed and are scattered away during the transport and those that enter into the detector are largely the ones that transported through the near borehole formation space between the source and the detector.These considerations make it possible to associate tool readings with the property of the formation around and close to the sensor locations.However,often the tool reading is also affected,to some degree,by formation properties outside and away from the sensor loca-tions of the tool.These less-local effects,typically over a distance much larger than the vertical resolution of a tool,bring in additional complexity in the practical calculation of vertical resolution of a tool.
In thispaper,we will study the vertical resolution of a LWD laterolog tool and show that the definition in terms of the thinnest bed in which the tool reads 90%of the value,if strictly applied,may not actually reflect the capability of the tool in resolving and defining thin beds.Instead we propose an alternative definition that generates a much more robust measure for the tool’s vertical resolution in logging practice.
1 A Laterolog LWD Resistivity Tool
Wireline laterolog resistivity tools have experienced several generations from the earlier industry standard Dual Laterolog tool[4]to the latest array laterolog tools,such as Schlumberger’s High Resolution Laterolog Array (HRLA)tool[5].Compared wtih induction logging tools that may make a measurement in formation resistivity up to 1 000Ω·m,the laterolog tool has a much broader measurement range,enabling formation resistivity values up to tens of thousands of Ohm-m.The laterolog resistivity tool also works well in salty mud and generally has better vertical resolutions.With better processing,modern induction logging tools can cover a wide range of formation and borehole properties.However,the high resistivity formation measurement is still dominated by laterolog tools.
The first true laterolog resistivity LWD tool is the Resistivity-At-the-Bit (RAB ) resistivity tool[6-7]that was later upgraded to Geo Vision Resistivity tool(GVR).The RAB/GVR tool provides both an array laterolog resistivity measurement similar to that of HRLA tool(albeit much shallower in depth of investigation)and more importantly,a fullbore resistivity image with image resolution of 1 in.The tool uses toroids operating at a low frequency to provide an effective voltage excitation across the gap and electrode(Ring shaped and Buttons for measuring current generated from the formation),and some additional processing to focus the current to get better vertical resolutions[6].
In thispaper,we present the response of a LWD tool with a symmetric transmitter and electrode.The electrode is ring-shaped with a specific height and located mid-way between two transmitter toroids.With a symmetric transmitter on both sides of the measuring electrode,shown conceptu-ally in Fig.1,current will be well focused to go perpendicular to the tool body,hence less influenced by the adjacent beds and thus resulting in a better vertical resolution.The distance between the toroids to the center of the ring is chosen to be 30 in.For the purpose of simulation,without losing generality,it is further assumed that the toroid can be approximated with a DC voltage drop of 1 V on the mandrel over a 2 in gap at the same position as the toroid.
LWD tool can be modeled with specialized Finite Elements codes or with commercial packages such as COMSOL.For our study,we opted for COMSOL modeling software.It not only has an accurate solver and a well-developed GUI and allows for easily integrated multi-physics modeling,but also produces reliable results without requiring extensive user tuning. We did,however,go through extensive comparison with results from other independently verified packages before having confidence with COMSOL results.Note that all computations presented in this note are made with the AC/DC module of COMSOL modeling software.
2 Modeling of Bedding Response

Fig.2 Computed logs from a 30 in toroid-electrode spacing for a 10Ω·m resistive bed of different bed thickness in a 1Ω·m formation
For simplicity,we have studied the tool response of the 30 in toroid-electrode spacing LWD tool in a bed with a formation resistivity ofRtand with background resistivity ofRs.The tool is logged at different depths perpendicular to the bed of interest.To comprehend the response of the tool,the bed thickness varies as 1,2,4,10 ft,and 20 ft respectively.Fig.2 shows the apparent resistivity computed for the scenario of a resistivity bed in a conductive formation withRt=10Ω·m andRs=1Ω·m.The electrodes are assumed to be of 6 in height with a gap of 2 in above and below the electrode.This 10∶1 ratio is typically selected for theoretical studies of tool responses.Note that for laterolog tools,it is well known that responses of the tool is proportionally governed only by the ratio of the bedding resistivity which means here that the figures below apply to any case ofRt/Rs=10,after appropriate scaling of the resistivity value.In the model,there is no borehole so the modeling results also assume that borehole effect has been completely corrected in the following discussion.
Fig.3 shows the response of the same tool for the case of a conductive bed ofRt=1Ω·m embed-ded in the resistive formation ofRs=10Ω·m.The tool is perpendicular to a bed with the thickness of 1,2,4,10,and 20 ft.The electrodes are assumed to be of 6 in height with a gap of 2 in above and below the electrode.
The following observations can be made based on the modeling results presented in Fig.2 and Fig.3.
(1)Symmetric tool designs produce symmetric logs in symmetric formation,as expected.
(2)Thereare considerable shoulder effects on both sides of the bed boundary,when the electrode and the toroid are not within the same bed.Features in the resistivity log on both sides of the bed boundary can clearly be identified to be associated with one of the toroids crossing from bed boundary into the center bed.

Fig.3 Computed logs from a 30 in toroid-electrode spacing for a 10Ω·m resistive bed of different bed thickness in a 1Ω·m formation
(3)The transitions in the logare fromRstoRtor vice versa when the electrode crosses the bed boundary are relatively sharp.This is a result of good focusing with the symmetric tool design and a relatively small electrode height of 6 in.
(4)A close look at the reading even at the center of4 ft bed,reveals that the value is still not within 90%ofRt.In fact,the reading does not monotonically approach theRtvalue as the bed thickness increases,even though as for very large bed thickness the tool reading does satisfactorily reachRt.
(5)As for the same bed thickness,the tool response to the resistive formation is better than that to the conductive formation.This is clearly seen if we compare the 4 ft thickness response of Fig.2 with that of the same bed thickness in Fig.3.
The observation(4)is puzzling since with 6 in electrode,we expect that the tool should read true formation properties at 4 ft.Fig.2 and Fig.3 show that they do not.The explanation is that the tool reading at the bed center is in fact affected by the presence of boundaries.When the current source and the measuring electrode are separated by a 30 in distance in thin beds,they are necessarily located in different beds.This influences the responses of the tool to the point that a very accurate reading of the formation resistivity in thin bed is very difficult without performing shoulder bed correction.This is especially as for the case of a conductive bed in a resistive shoulder in which the tool reading at the center of the 4 ft bed is nearly twice the value of the true formation resistivity(Fig.3).If we insist on the definition of a close reading of the apparent resistivity to the true resistivity(90%of its value or even 100%of its value),the vertical resolution of the tool will be much poorer than that expected of a focused laterolog tool.
In order to have a better understanding of the true vertical resolution of this tool,we have modeled the response of the tool at the center of the bed for many different bed thicknesses and various electrode heights(Fig.4 and Fig.5)and see if we can get a trend.On principle,we expect that as the height of the electrode decreases,the vertical resolution of the tool increases.Fig.4 shows the tool reading at the bed center for a resistive bed(Rt=10Ω·m)in a conductive shoulder(Rs=1Ω·m)corresponding to the case of Fig.2,and Fig.5 is for a conductive bed(Rt=1Ω·m)in a resistive shoulder(Rs=10Ω·m)corresponding to the case of Fig.3.
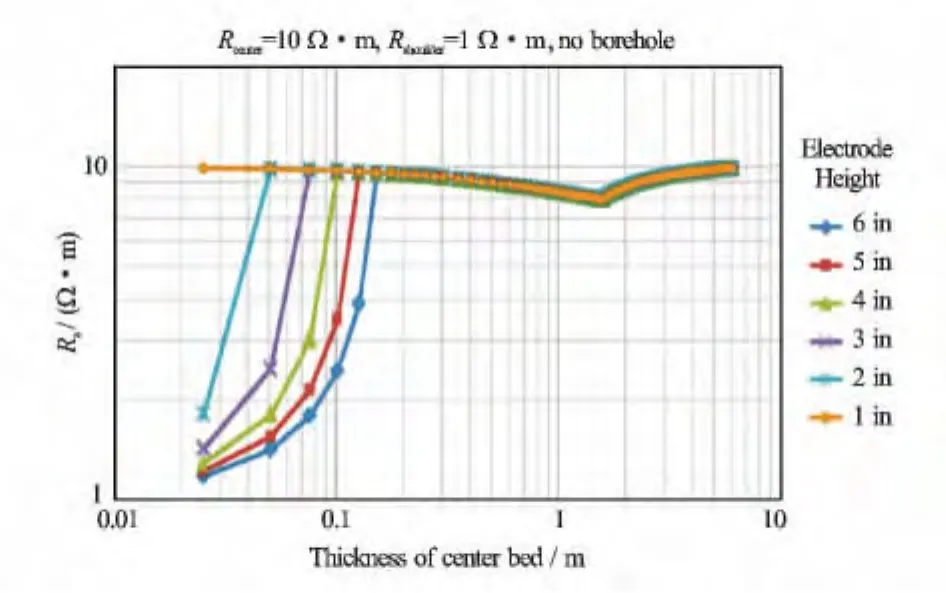
Fig.4 Tool Reading at the center of the bed for different electrode heights.The tool and formation model is the same as used in Fig.2 for a resistive bed in a conductive formation

Fig.5 Tool Reading at the center of the bed for different electrode heights.The tool and formation model is the same as used in Fig.3 for a conductive bed in a resistive formation
Fig.4 and Fig.5 are quite informative to our understanding of the behaviors that we see in Fig.2 and Fig 3.The behavior of the center reading of the tool can be separated into two regions as the thickness of the beds are changed.For the bed thickness much larger than the height of the electrode,the center bed reading is nearly independent of the electrode height,and is only approaching the true formation resistivity slowly at bed thickness much larger than the distance between the toroid and the measuring electrode.This part of the response is controlled by the distance of the toroid to the electrode and is NOT a true reflection of the vertical resolution of the tool.However,as the bed thickness decreases,the tool response changes almost abruptly when the bed thickness becomes less than the height of the electrode and the center bed reading begins to quickly approach the formation resistivity of the shoulder.This part of the response is expected based on measurement physics:as the bed begins to become thinner than the electrode height,the electrode is exposed to the shoulder bed formation.
A simple explanation follows.To a good first order approximation and for a bed thinner than the height of the electrode,the total current measured by the electrode can be estimated as the sum of two contributions:one from the thin formation of interest with bed resistivityRtwith weightHt/Heand one from the shoulder bed with resistivityRsand weight(He-Ht)/He,whereHeis the electrode height andHtthe bed thickness.Part of the measuring current is from the formation bed with resistivityRtand the rest comes from the shoulder bed.Hence the apparent resistivity can be approximated as 1/Ra=(1-He/Ht)/Rs+(He/Ht)/Rt=1/Rs+(He/Ht)*(1/Rt-1/Rs),which forHt<Hegoes inversely as 1/Htfor smallHt,as shown in Fig.3 and Fig.4.
The interpretation of Fig.4 and Fig.5 is that there are two different factors contributing to the reading of the tool:the tool has a short and sharp response that is determined by the size of the measuring electrode and a tailed smooth response(almost like the envelop of the curves for different electrode heights)that is more controlled by the spacing between the voltage source and measuring electrode,similar to the role of the transmitter and receiver spacing of an induction tool.Both of these two features contribute to the measurement physics and only the first feature is closely linked to the vertical resolution.However,this means that any attempt to make a precise mathematical definition of the vertical resolution is difficult because the long tail feature of the response can distort the true reading of the formation,thus making defining the precise bed thickness for which a precise measurement of the true formation resistivity is expected less meaningful and circumstance dependent.
We therefore proposean adaptive working definition that for laterolog tools,the vertical resolution can be taken as the bed thickness at the deflection point,in the plot of bed center apparent resistivity against bed thickness where the apparent resistivity begins rapidly deviating from a background envelope of tool response as the bed thickness decreases.With such a definition the vertical resolution of our focused tool is the effective width of the electrode,which is the electrode height plus the gap size,8 in in total,for the tool shown in Fig.1.
3 Conclusions
(1)Using commercial software COMSOL,we have studied the responses of a focused LWD resistivity tool in thin beds in an attempt to define the vertical resolution of the tool.The vertical resolution is good and even for bed as thin as 1 ft,the reading at the center of the bed is within 90%of the actual value.
(2)In the center of resistive bed,the tool reading goes down as the bed-thickness increases initially;the reading starts to increase and then reaches the correct true value as the thickness further increases.
(3)There is a long“tail”away from the bed interface in all cases.The vertical special extension of the“tail”is mainly related to the voltage source to electrode spacing.Due to the contribution from this long“tail”,evaluating the vertical resolution based on some widely-used definitions is found to be unsatisfactory.
(4)We propose the practical working definition that reflects more of the role of the current in front of the measuring electrode.Using such a definition,the vertical resolution of the focused electrode LWD resistivity tool is shown to be approximately the effective size of the measuring electrode.
[1] Tittman J.Vertical Resolution of Well Logs:Recent Developments[J].Oilfield Review,1991,3(3).
[2] Theys P.Log Data Acquisition and Quality Control[M].2nd ed.French:Techniq Editions,1999.
[3] Serra O.The Well Logging Handbook[M].French:Techniq Editions,2008.
[4] Suau J,Grimaldi P,Poupon A,Souhaute P.The Dual Laterolog-Rxo Tool[C]∥ SPE4018,SPE Annual Technical Conference,San Antonio,TX,USA,1972.
[5] Smits J W,Dubourg I,Luling M G,Minerbo G N,et al.Improved Resistivity Interpretation Utilizing a New Array Laterolog Tool and Associated Inversion Processing[C]∥SPE49328,SPE Annual Technical Conference,San Antonio,TX,USA,1998.
[6] Bonner Steve,Bagersh A,Clark Brian,Dajee G,Dennison M,Hall J S,et al.A New Generation of Electrode Resistivity Measurements for Formation Evaluation While Drilling[C]∥ Trans of the SPWLA 35th Annual Logging Symposium,Tulsa,OK,USA,June 19-22,1994,Paper OO.
[7] Stan Gianzero,Roland Chemali,Yih-yih Lin,et al.A New Resistivity Tool for Measurement While Drilling[C]∥ Trans of the SPWLA 26th Annual Logging Symposium,Dallas,TX,USA,June 17-20,1985,Paper A.
猜你喜欢
职工法律天地·上半月(2020年8期)2020-09-21
微型小说选刊(2019年5期)2019-09-10
做人与处世(2018年22期)2018-12-21
现代装饰(2018年2期)2018-05-22
上海故事(2018年12期)2018-01-07
喜剧世界(2017年12期)2017-12-06
爱你(2017年26期)2017-11-15
杂文选刊(2017年3期)2017-03-20
中国工程咨询(2017年8期)2017-01-31
——走出萧条
国外社会科学前沿(2016年7期)2016-12-24