
Experimental investigations of transient pressure variations in a high head model Francis turbine during start-up and shutdown*
2014-06-01 12:30TRIVEDIChirag
水动力学研究与进展 B辑 2014年2期
TRIVEDI Chirag
Division of Fluid and Experimental Mechanics, Department of Engineering Sciences and Mathematics, Luleå University of Technology, Sweden
Department of Mechanical and Industrial Engineering, Indian Institute of Technology, Roorkee, India, E-mail: chirag.trivedi@ltu.se
CERVANTES Michel J.
Division of Fluid and Experimental Mechanics, Department of Engineering Sciences and Mathematics, Luleå University of Technology, Sweden
GANDHI B. K.
Department of Mechanical and Industrial Engineering, Indian Institute of Technology, Roorkee, India
OLE DAHLHAUG G.
Water Power Laboratory, Department of Energy and Process Engineering, Norwegian University of Science and Technology, Norway
Experimental investigations of transient pressure variations in a high head model Francis turbine during start-up and shutdown*
TRIVEDI Chirag
Division of Fluid and Experimental Mechanics, Department of Engineering Sciences and Mathematics, Luleå University of Technology, Sweden
Department of Mechanical and Industrial Engineering, Indian Institute of Technology, Roorkee, India, E-mail: chirag.trivedi@ltu.se
CERVANTES Michel J.
Division of Fluid and Experimental Mechanics, Department of Engineering Sciences and Mathematics, Luleå University of Technology, Sweden
GANDHI B. K.
Department of Mechanical and Industrial Engineering, Indian Institute of Technology, Roorkee, India
OLE DAHLHAUG G.
Water Power Laboratory, Department of Energy and Process Engineering, Norwegian University of Science and Technology, Norway
(Received June 15, 2013, Revised August 5, 2013)
Penetration of the power generated using wind and solar energy to electrical grid network causing several incidents of the grid tripping, power outage, and frequency drooping. This has increased restart (star-stop) cycles of the hydroelectric turbines significantly since grid connected hydroelectric turbines are widely used to manage critical conditions of the grid. Each cycle induces significant stresses due to unsteady pressure loading on the runner blades. The presented work investigates the pressure loading to a high head (HP=377 m, DP=1.78 m) Francis turbine during start-stop. The measurements were carried out on a scaled model turbine (HM=12.5 m, DM=0.349 m). Total four operating points were considered. At each operating point, three schemes of guide vanes opening and three schemes of guide vanes closing were investigated. The results show that total head variation is up to 9% during start-stop of the turbine. On the runner blade, the maximum pressure amplitudes are about 14 kPa and 16 kPa from the instantaneous mean value of 121 kPa during rapid start-up and shutdown, respectively, which are about 1.5 times larger than that of the slow start-up and shutdown. Moreover, the maximum pressure fluctuations are given at the blade trailing edge.
Francis turbine, pressure fluctuations, start-up, shutdown, transient
Introduction
Current trend of electricity demand and penetration of wind and/or solar power to the grid network above manageable limit has raised some significant concerns about stable operation of the power grids in the recent years[1]. Typically, hydroelectric generators are primarily used to maintain the power quality of the connected grid, to meet the demand factor, for cold start using available form of reactive power, and to avoid frequency drooping and/or cascade splitting of other base load power generators. Thus, hydro-turbines are frequently used to manage the critical conditions of the connected grid, which increased the startstop cycles of the hydroelectric turbines significantly.
A survey[2]states that two decades ago more than 90% of the hydro units were operated at the best efficiency point and had modest start-stop cycles, about 100 per year in North America. In the recent years the cyc les re ached to al most 500 pe r ye ar. Turb ines used forbaseloaddutymayhave1-5cyclesperyearwhereas pump-turbine may experience up to 2 500 cycles per year. A peak load hydro-turbine may have up to 50 000 cycles during a service period of 20 years[3].
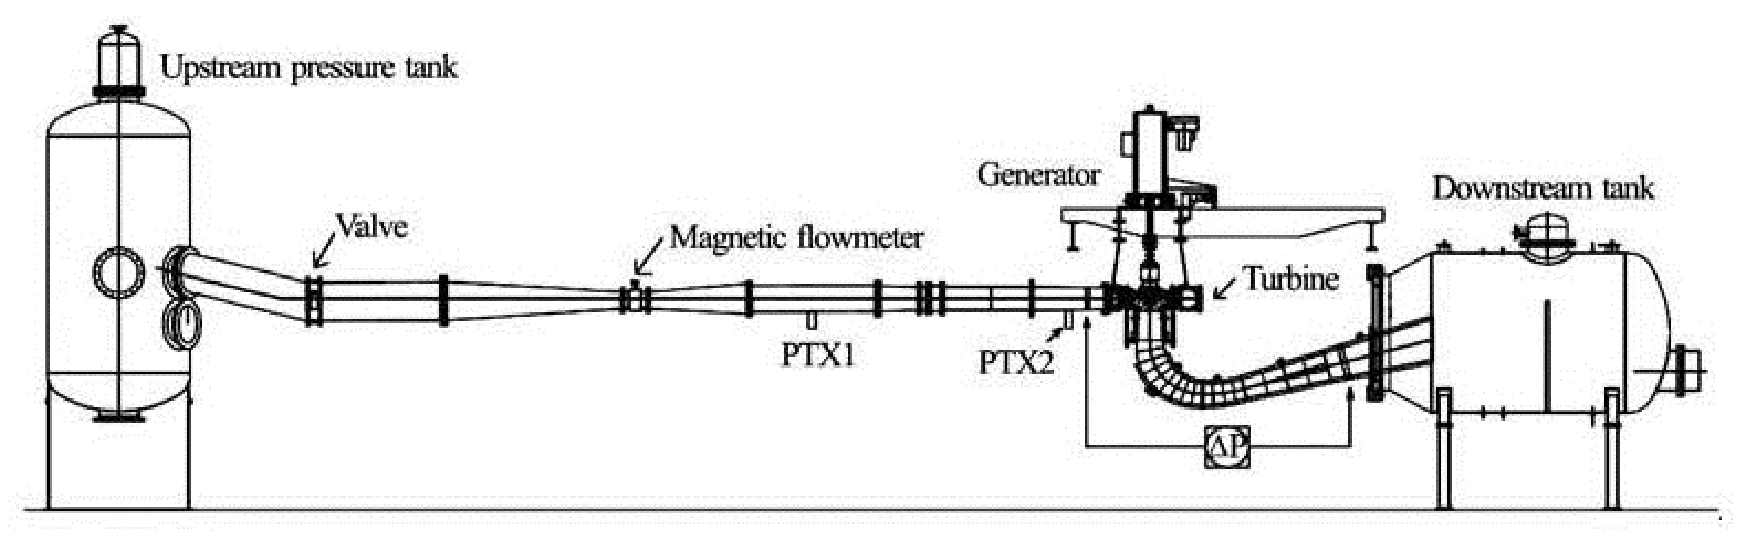
Fig.1 Model Francis turbine test rig installed at the water power laboratory, NTNU, Norway. It is a scaled down (1:5.1) model of prototype. Differential pressure (Δp) indicates an average pressure measurement across the turbine, pressure transmitters PTX1 and PTX2 are located ≈4.87 m and ≈0.87 m from the turbine inlet casing, respectively
The output power from a hydroelectric turbine is normally managed by regulating the water flowing to the runner through guide vanes. The movement and position of guide vanes are controlled by a coupled governing servo-mechanism according to the electricity requirement. An inappropriate opening/closing of the guide vanes during start and stop induces unsteady pressure loading on the blade surfaces. Turbine startup and shutdown procedures are generally predefined at the time of commissioning and adopted later on. There may be a number of schemes to operate guide vanes of the turbine and each impact differently to the runner service life. With the increase in start and stop cycles, wear of the runner increases. Scheme of the guide vanes opening/closing, derived at the time of turbine commissioning, may not be optimum after few years of operation and may induce more wear to the runner.
An unscheduled start-stop cycle significantly affects the service life and refurbishment period which increases direct/indirect costs of the plant operation. At each cycle, a turbine experiences wear which reduces operating life of the components. Sometimes hydro-turbine’s operating instrument fails during start-up or shutdown hence costs more[4-6].
A review of literature showed that transient operating conditions such as load variation, start-stop cycles and load rejections, resulted in combination of low-cycle fatigue and high-cycle fatigue loading on the blades which may induce cracks[1,6,7]. Gagnon et al.[8]studied the impact of pressure loading on a Francis runner blade using two different schemes of the guide vanes opening/closing. They pointed out that the crack propagation rate due to fatigue loading on the blades for the startup scheme-1 was increased with rapid opening/closing of the guide vanes.
Increased start-stop cycles due to grid connected intermittent power and variable demand of electricity have raised concerns about operating stability and wear of a hydraulic turbine. Moreover, the angular movement and operating scheme of guide vanes significantly influence the pressure distribution over the blade surfaces. The experimental measurements and investigations on the Francis turbines, carried out so far, were under steady state operating conditions[6,7,9-11]. Limited measurements have been carried out to investigate the consequences of incompetent operating scheme and the pressure variation on the blade surfaces corresponds to the guide vanes angular movement during start-up and shutdown. The present work focuses on the measurements on a model Francis turbine during start-up and shutdown. The aim of the study is to investigate transient variation of the pressure in the turbine considering different durations of the guide vanes opening/closing at the time of start-up and shutdown. All the measurements were performed considering present trend of electricity generation and its consequences on operation of a Francis turbine.
1. Material and methods
1.1 Experimental set-up and instrumentations
Transient pressure measurements during start-up and shutdown were carried out on a model Francis turbine (HM=12.5 m, PM=30 kW, DM=0.349 m). An open loop water circuit was considered to get realistic conditions without significant variation of the effective head available to the turbine inlet similar to a prototype. Constant water level in the overhead tank was maintained during measurements. The outlet of the draft tube was connected to the downstream tank of constant water level similar to tailrace condition of a power plant as shown in Fig.1. The corresponding prototype turbines (HP=377 m, PP=110×4 MW, and DP=1.779 m) operate at the Tokke Power Plant, Norway. Both the model and the prototype are inte-grated with 14 stay vanes inside the spiral casing, 28 guide vanes, a runner with 15 splitters and 15 full length blades, and an elbow-type draft tube.
The experimental measurements, calibrations and computations were performed using the procedures and guidelines available in the IEC standards[3]. Data from the instruments and pressure sensors were acquired to the computer through a program developed in LabVIEW. There were two acquisition systems, one to record the data for the efficiency hill diagram including differential average pressure (Δp), runner speed (N), torque (T) and guide vanes position ()α sampled at 1.4 Hz, and another to acquire the pressure signals of the mounted sensors, sampled at 2 083 Hz.
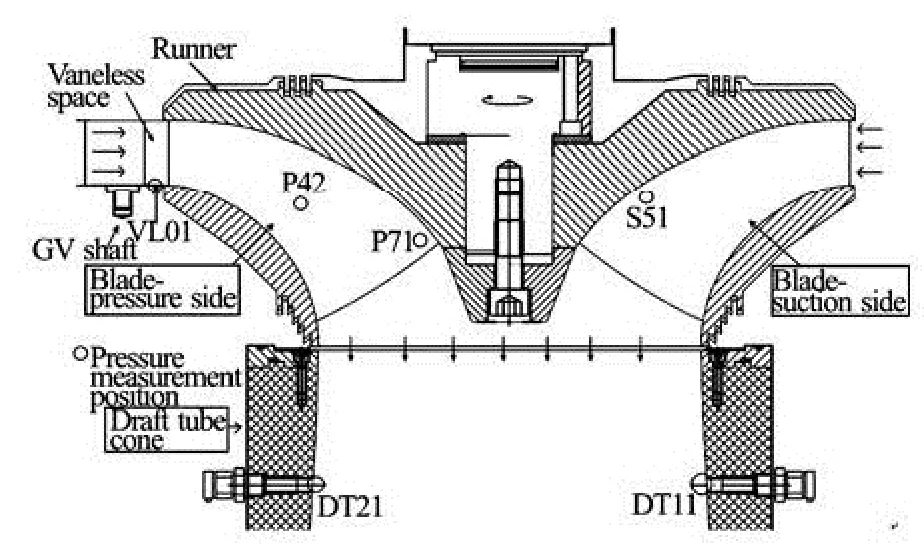
Fig.2 Locations of the pressure sensors in the stationary domains (VL01, DT21, DT11) and the rotating domains (P42, P71, S51) of the model Francis turbine runner
Figure 2 shows the locations of the pressure sensors mounted in the model turbine, namely vaneless space (VL01), pressure side of the blade (P42) and trailing edge (P71), middle of suction side (S51) of the blade, and the draft tube cone (DT11 and DT21). Wireless data transmission system was used to transmit the pressure-time data captured by the sensors P42, P71 and S51 to the stationary receiver.
Steady state measurements were carried out to evaluate the turbine performance under steady operating conditions before the measurements of the start and stop[3]. The efficiency hill diagram, covering the entire range of the model turbine operation, was prepared using the steady state measurement data. The maximum hydraulic efficiency of 93.4% was computed at the BEP (Best Efficiency Point, HED=0.18 and qED=0.15). The random and systematic errors as well as related uncertainties during the measurements were computed using the guidelines available in the IEC standards[3]. The estimated maximum uncertainty is ±0.16% for the hydraulic efficiency at the BEP.
1.2 Measurement program and range of parameters
Transient measurements during start-up and shutdown were carried out considering the entire range of the prototype operation. Four operating points were selected for the measurements: two at low discharge (26% and 58% load), one at the BEP (75% load), and one at high discharge (100% load). The turbine load of 26% of the maximum load observed at 29% angular position of the guide vanes is referred as the generator synchronization conditions.
Six schemes of the guide vanes movement per operating point were performed including three schemes for the start-up and three schemes for the shutdown. Selected operating points for the start-up and shutdown schemes are presented in Table 1.The guide vane position 0% indicates that the guide vanes are closed, 29% indicates that theo4 angular opening of guide vanes at which the generator synchronization to the load takes place during start-up or decouple from the load during shutdown, and 100% corresponds to the maximum opening of the guide vanes i.e.,o14 for generating the maximum power output of 30 kW (100% load). The guide vane positions 29% and 50% are relatively opening position of guide vanes for 26% and 58% of the maximum load respectively, and 70% position corresponds to the BEP load, i.e., 75% of maximum load.
The scheme-I was followed considering the available normal timing of guide vanes opening for the model turbine start-up in the laboratory (similar to the prototype) which requires total time of 2.1 s for synchronization. For the scheme-II, the guide vanes were opened faster than the normal time taking only 1.9 s for the synchronization. At each of the start-up scheme, four cases were selected for different operating conditions (see Table 1). Free spin runner acceleration (scheme-III) was performed by operating the guide vanes continuously considering no load to the generator terminal hence no synchronization. Three of above four cases were selected for the scheme-III. The runner/generator speed after synchronization was kept constant (HED=0.18, similar to the synchronous speed of the prototype) for all the cases. All the three schemes of start-up were reversed from the final load conditions to develop the shutdown schemes. Since shutdown of a hydroelectric turbine is more complex than the start-up due to the risk of surging and water hammer; hence timing of the guide vanes closing for the shutdown schemes may be longer[1].
The turbine start-up sequence may be divided into three phases, during phase-I, the guide vanes were operated from 0%-29% to couple the generator at synchronization load (tnls), during phase-II, the guide vanes were further opened up to the selected operating point (tgen), and during phase-III, smooth adjustment of the guide vanes was performed to obtain the required power output (ttorque). The machine shutdown also comprises of three phases, during phase-I, the generator power/load ramped down to theminimum value by closing the guide vanes up to 29% mark (tgen.), during phase-II, the generator was decoupled from the load and the guide vanes were closed further (tnls), and during phase-III, a slow closing of the guide vanes was followed (tgv) and the runner was set to no spin condition.
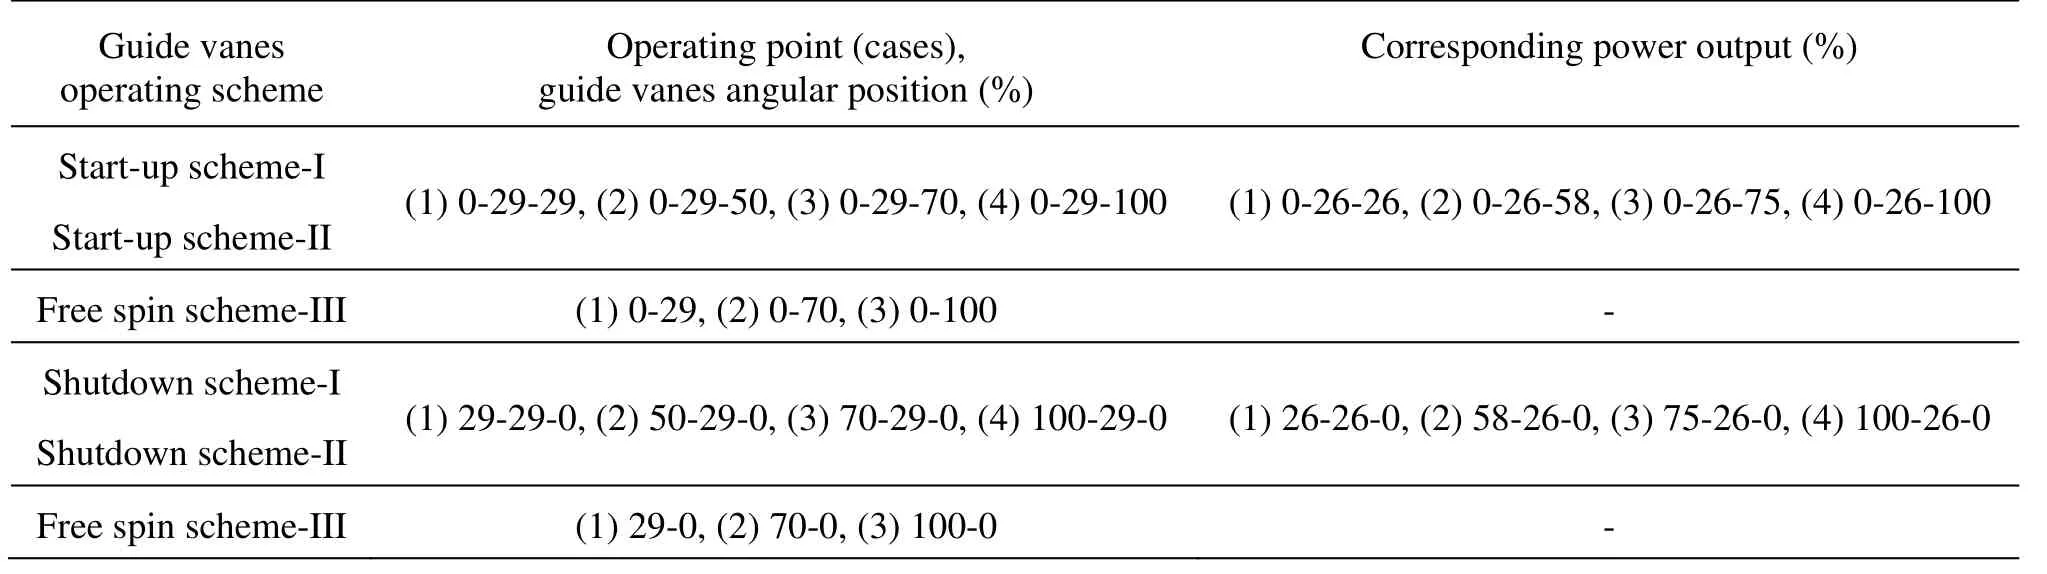
Table 1 Range of parameters and the investigated transient operating conditions by opening/closing the guide vanes of the model Francis turbine during start-up and shutdown
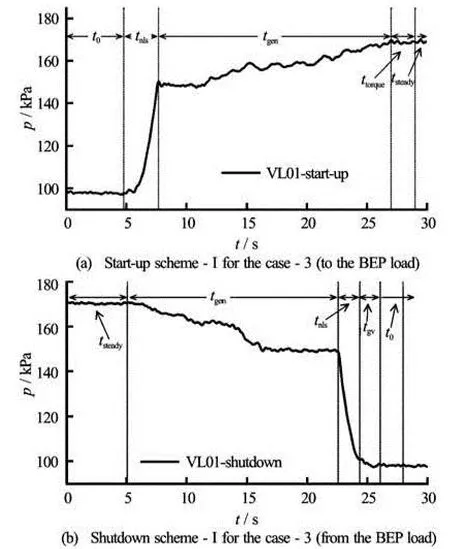
Fig.3 Transient phases of pressure variation in the vaneless space (VL01) during the turbine start-up and shutdown
In the results, operating points are referred as cases for simplicity and to distinguish from the operating conditions. Graphical representation of the phases during start-up case-3 (0-29-70) and shutdown case-3 (70-29-0) is presented in the Figs.3(a) and 3(b), respectively. Pressure variation in the vaneless space location VL01 during both the transient cases is presented in Fig.3(a). In Fig.3(a), t0denotes the runner standstill position up to t=5 s and tsteadythe final (steady state) operating condition of the turbine. Similarly, in Fig.3(b), tsteadydenotes the steady state power generation up to t=5 s, and the turbine starts to ramp down the load from t=5 s to 22 s. At t=22 s, the generator decouples from the load and free spin of the runner begins (tnls) which is followed by a slow closing of the guide vanes (tgv) to completely close condition (t=26 s). t0is the point of no rotation of the runner (no spin).
The flow parameters and pressure-time data are stored into the time domain and linked to the angular positions of the guide vanes. The data of the guide vanes position ()α, torque (T), and power (P) were acquired at a frequency of 1.4 Hz. The head (H), discharge (Q), and pressure (p) data were logged at 2083 Hz. The data of both the frequencies were synchronized together using common signal of the runner speed which was acquired with both the frequencies. Analysis of data shows that a variation of 0 to 0.7 s may exist between signals of these two frequencies from the exact instant of event, since the signals of pressure fluctuations are averaged and interpolated. The optimum window length varies from 0.18 to 1 s[6,12]which is equivalent to 1 to 5 revolutions of the runner.
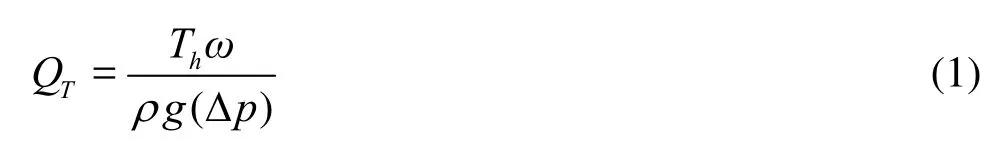
Since the data output frequency of the electromagnetic flow meter was about 1 Hz, the instantaneous transient variations of the flow rate could not be captured although the data were logged at 2 083 Hz. Hence, instantaneous value of the torque (Th), differential pressure (Δp) and angular velocity of the runner ()ω were used to calculate the instantaneous value of the flow rate. After the synchronization (nED= constant), the flow rate is a function of the runner output torque with neglecting the hydraulic efficiency (ηh=1). Hence, transient variation of the flow rate may be estimated by equating input power to the output power as shown in Eq.(1).
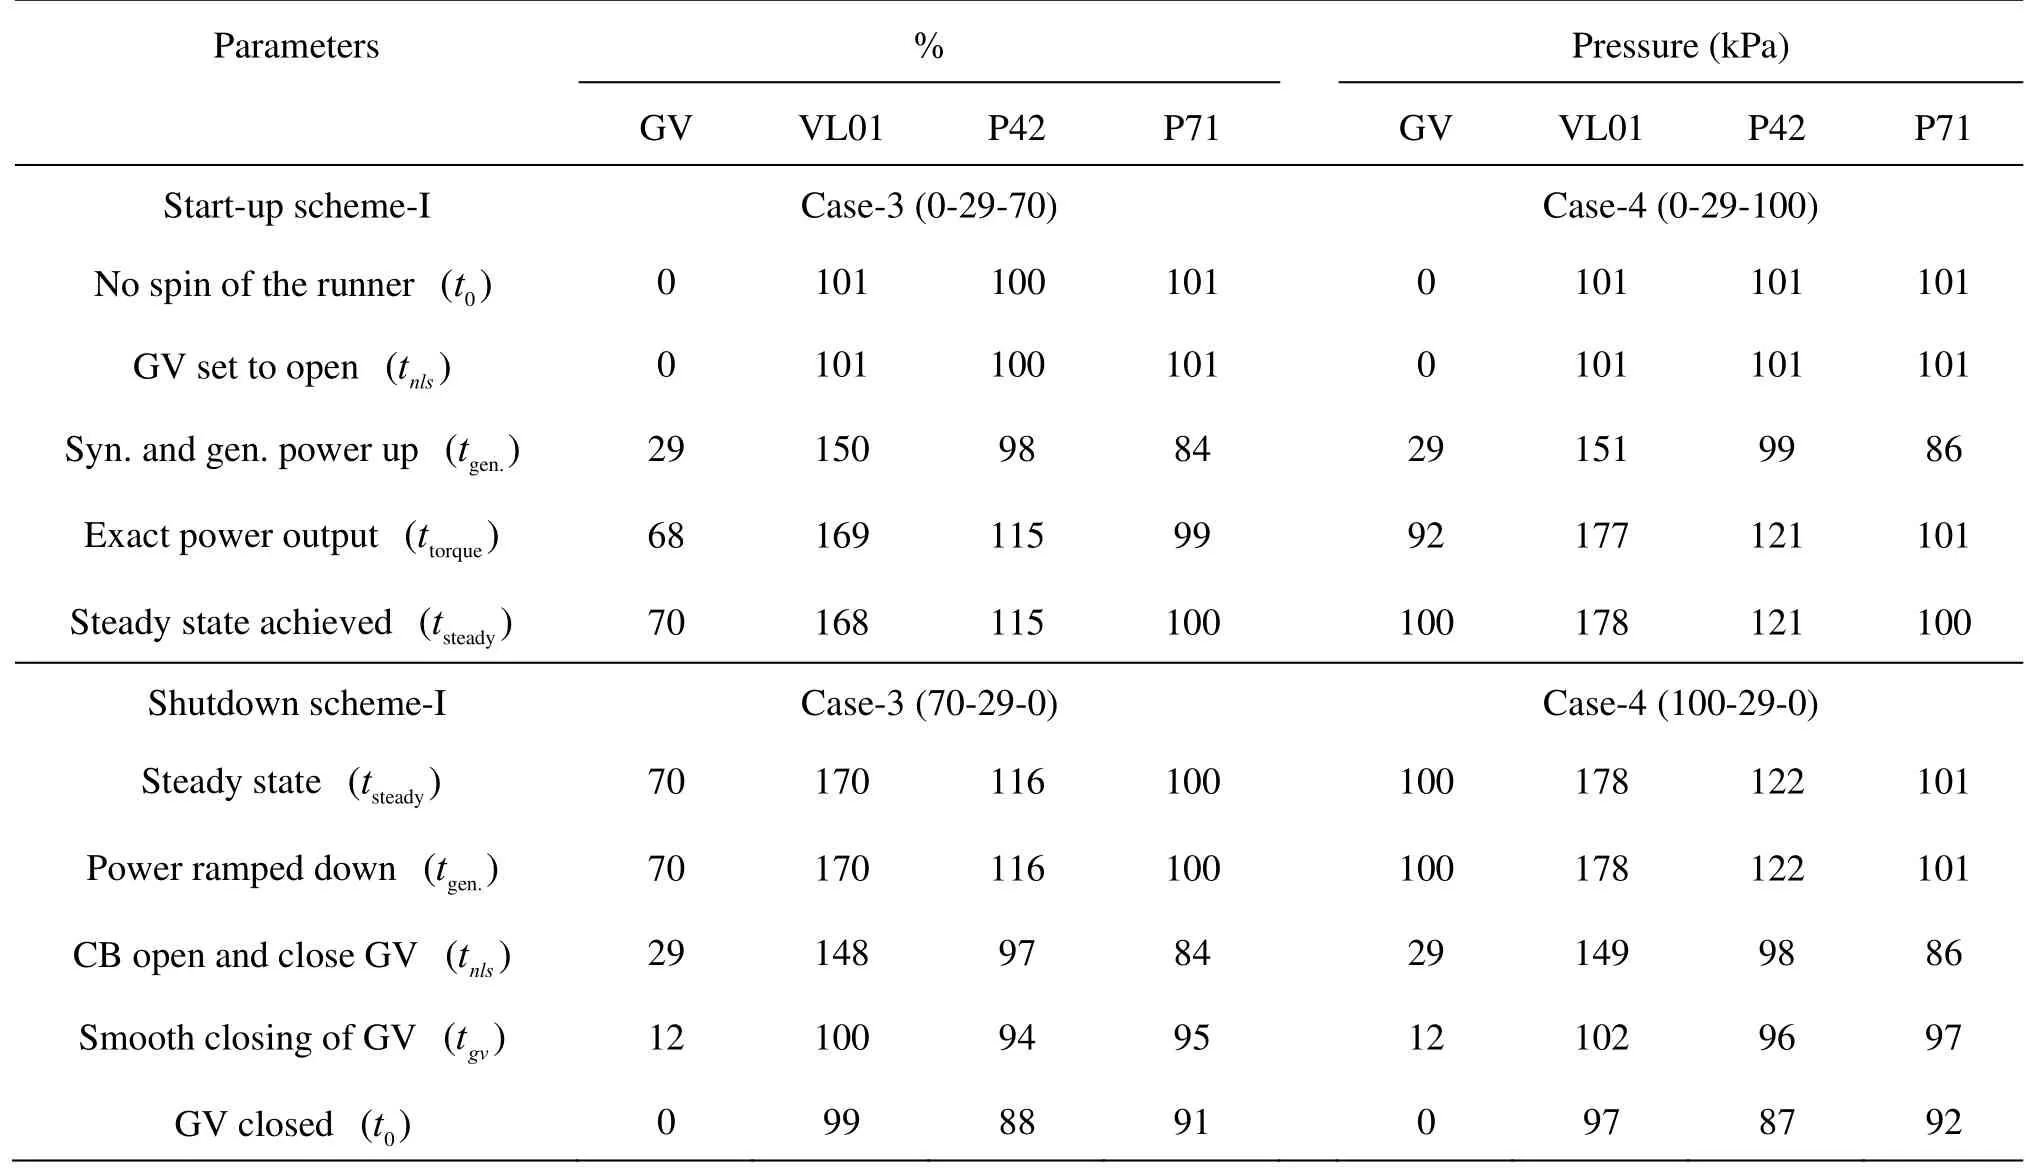
Table 2 Pressure variation in the vaneless space and the runner during start-up to meet the BEP load (case-3) and 100% load (case-4), and the shutdown from the corresponding load
After compiling all the cases, the maximum instantaneous difference between the estimated and the measured values (acquired at 1 Hz) of flow rate was about 3% at the time of guide vanes movement, whereas the difference during the steady state operating condition was less than 1%. The overall difference may be attributed to the leakage flow in the turbine. In the present paper, the flow rate estimated using Eq.(1) was found to be more convenient and is used for further calculations.
2. Results
A total of 22 transient measurements were carried out on the high head model Francis turbine which includes 11 cases of the start-up and 11 cases of the shutdown (see Table 1). Analysis of data shows that the maximum pressure variation occurs at higher discharge rates. Therefore the two outmost cases of start-up and shutdown schemes-I and II, where the guide vanes operated for maximum discharge, are discussed in details.
The pressure values for different phases of two cases, case-3 and case-4, considering scheme-I during start-up and shutdown of the turbine are presented in Table 2. The presented pressure values are averaged over 1 s at the beginning of the corresponding phase. The percentage position of the GV is also presented. For the case-4 of start-up, at initial time t0, the runner was in standstill condition before the start-up therefore all the pressure values are equal to the atmospheric pressure. After opening of the guide vanes (phase-I), the pressure in the vaneless space (VL01) increases by 50 kPa, whereas the pressure on the blade surface (P42 and P71) decreases about 2 kPa-15 kPa. During phase-II (tgen.), the pressure started to rise in the runner with further opening of the guide vanes. At the starting of phase-III (ttorque), the pressure values on the blade surface retrieved and stabilized at the corresponding operating values. Similarly, for case-4 of shutdown, the power ramped down to 26% load (generator’s decoupling load) by closing the guide vanes during phase-I (tgen.). The pressure drops by 29, 24, and 15 kPa at the locations VL01, P42, and P71, respectively, and continues till the guide vanes are closed completely (tnls, tgv). The pressure values just after closure of the guide vanes (t0) are lower than the atmospheric pressure which is stabilized to the atmospheric pressure after sometime. The maximum pressure drop was observed during tnlsphase where the runner spins freely.
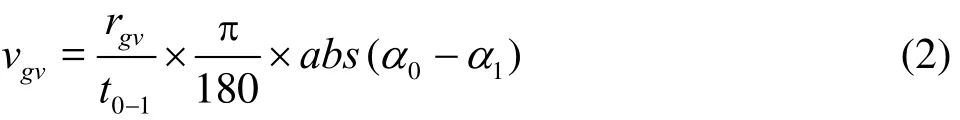
The avera ge speed o f guid e vane angula r movement (vgv) iscomputedusinginstantaneousangularposition of the guide vane trailing edge and the corresponding time. An average speed (vgv) during both the schemes of start-up and shutdown is computed using Eq.(2).
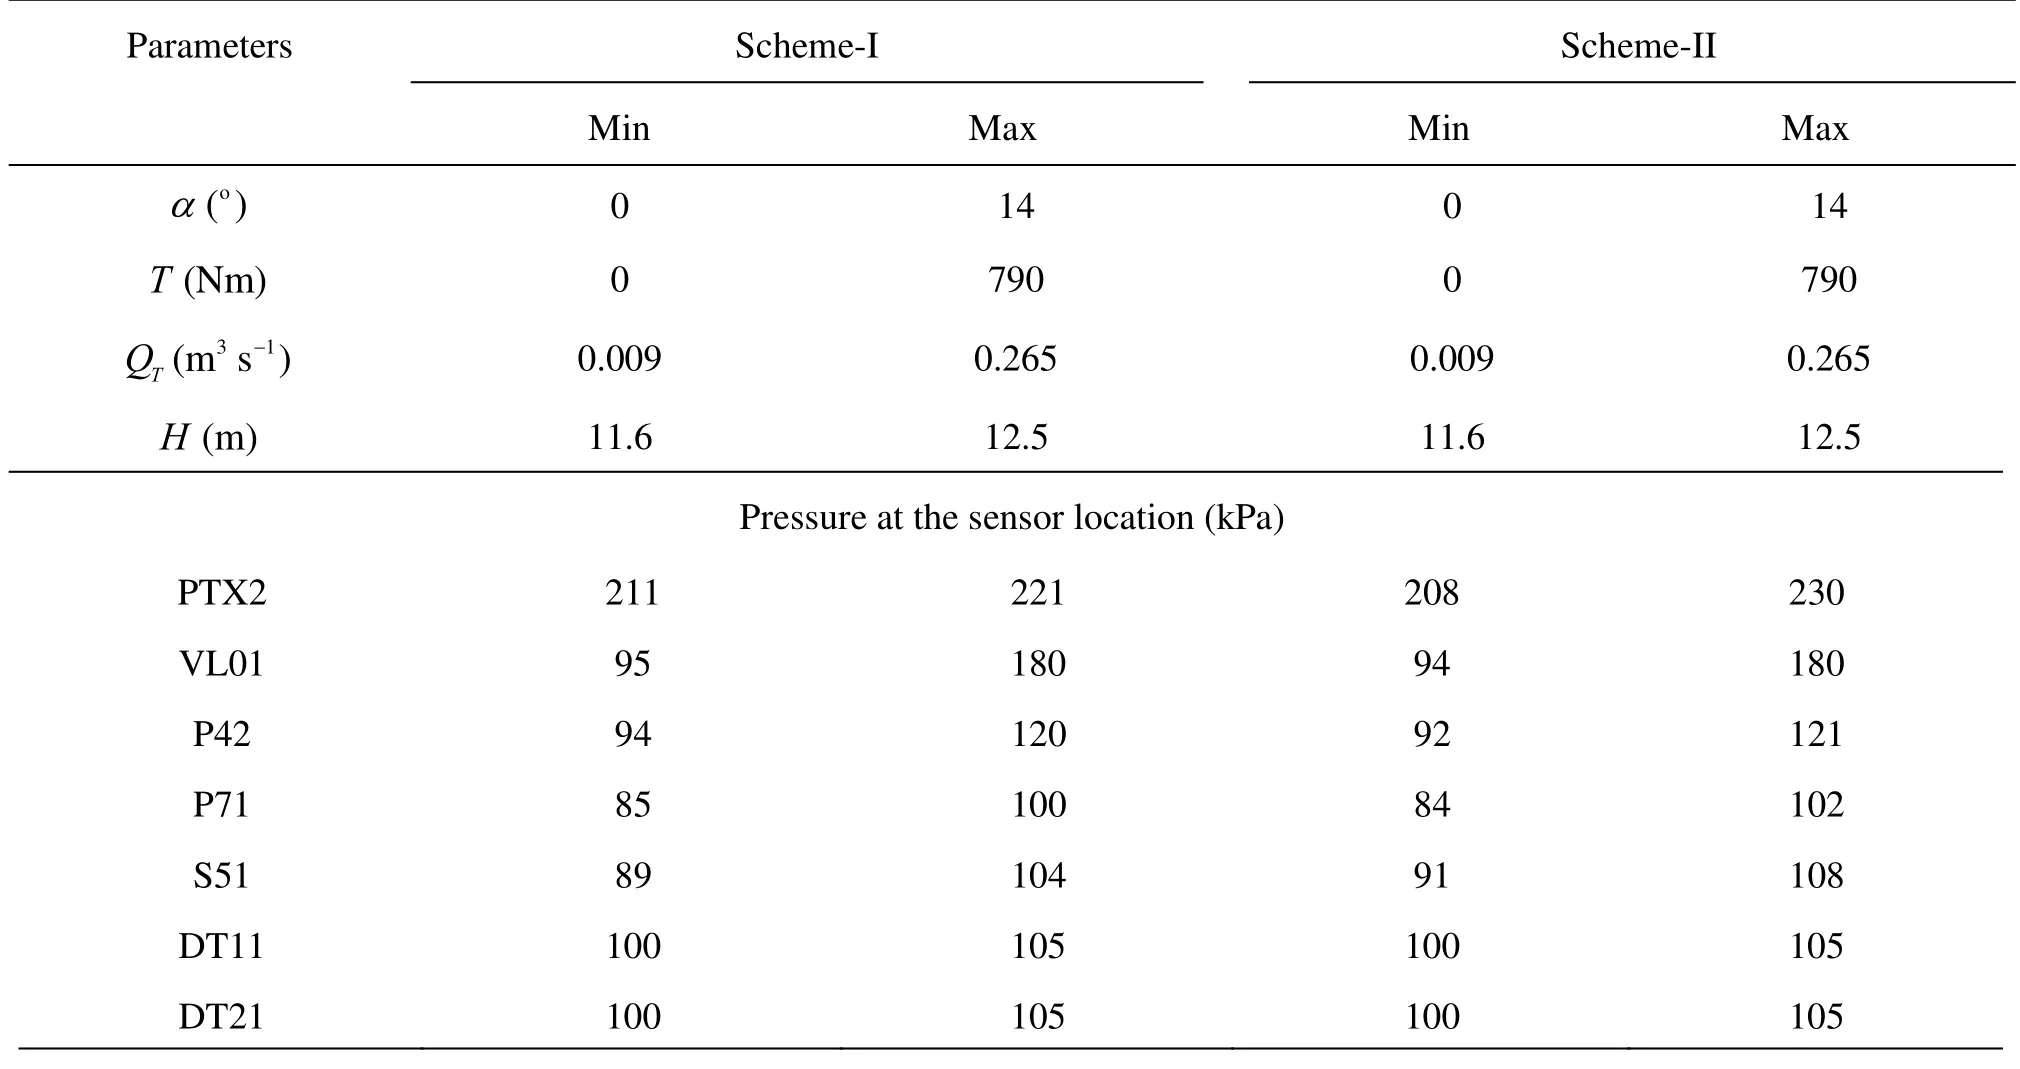
Table 3 The maximum and minimum values of measured variables and guide vanes angular position during the start-up and shutdown schemes of the case-4
The minimum and maximum values of the flow parameters for the case-4 of both the schemes of startup are shown in Table 3. The start-up and shutdown were performed at the same operating point. Therefore, the minimum and maximum values are almost the same for the corresponding start-up and shutdown schemes. The values such as α, QT, H, and pressure (pnorm) have been normalized with the maximum corresponding to 1 and the minimum corresponding to 0 using Eq.(3). Detailed investigations of pressure variation of the case-4 considering both the schemes (I and II) of start-up and shutdown along with the guide vanes angular positions are discussed below.
2.1 Start-up
Two schemes of the guide vanes opening are discussed, under the schemes-I and II, the guide vanes were operated at 0%-100% position in 18 and 14 s, respectively. The guide vanes were operated in two phases, i.e., 0%-29%, synchronization point and 29%-100% to meet 100% load. Figure 4 shows transient variations of the flow parameters of the turbine startup case-4. The guide vanes opening time is set to 1 s for both the schemes, i.e., phase-I of the guide vanes movement starts at t=1 s. Initial opening of the guide vanes from 0 to 29% for the scheme-I and scheme-II was performed in about 2.1 s and 1.9 s, respectively. The synchronous speed was achieved after 29% opening of the guide vanes and the generator synchronization (tsyn.) was followed. The generator was successfully coupled to the synchronous load (26%) then the torque output was increased to meet 100% load by further opening of the guide vanes considering different speeds of the angular movement, i.e., scheme-I and II.
Figure 4(a) shows the transient variation of the flow variables such as net head (H), discharge (QT), torque (T), guide vanes position ()α and pressure values at different locations in the turbine for the scheme-I. The average speeds (vgv) of the guide vanes opening at the trailing edge during the phase-I and -II were about 0.0017 m/s and 0.00082 m/s, respectively.
Followings are the observations from Fig.4(a).
(1) Transient variation of the torque and the discharge follow the trend of the guide vane movement. No significant variation in the head is observed during the phase-I, whereas a sudden drop is observed at the starting of the phase-II (t=8s) which continues until the final position of the guide vanes (t=19s). Sincethe flow rate increases, the inlet pressure for the turbine decreases, which results in a drop of the head across the machine, about 7%.

Fig.4 Variations in flow parameters during the turbine start-up in 18 s (scheme-I) and 14 s (scheme-I) to meet 100% load considering the guide vanes operating case-4
(2) The sensors mounted at the inlet pipeline shows an almost similar pressure drop. The pressure at the location PTX2 drops by 6% from the operating value of 221 kPa. The step movement of the guide vanes during the phase-II causes pressure oscillations at the position. However, in the vaneless space (VL01), pressure increases from 101 kPa to 151 kPa rapidly with opening of the guide vanes from 0%-29%, i.e., generator synchronisation point. The instantaneous pressure fluctuations during the synchronisation (3.1 s-7 s) are about 2.6 kPa ±. The dimensionless fluctuations of 0.2 s length are showed in zoom window. The pressure oscillations are attributed to the wakes developed by the blade passing over the guide vane close to the sensor VL01. After 7 s, the pressure in-creases with the opening of the guide vanes and is stabilized in around 19 s at the operating pressure of about 180 kPa. Transient interaction of the blade and the guide vane in the vaneless space will be discussed later.
(3) Initially the runner has no rotation, pressure at all the locations, namely P42, P71, and S51, is atmospheric pressure. At the beginning of the Phase-I, the pressure increases rapidly, soon after the guide vanes has set to open, and decreases immediately when the blade starts to rotate. The runner starts to spinning (t =1.5s)as the water pressure on the blades is higher than the runner inertia and bearing friction. After few rotations of the runner (t=2s), the pressure drops to operating value and is stabilized. A zoom window shows instantaneous pressure fluctuations of 0.2 s length at the location P42 which are about 6 kPa ± from the average value of 98 kPa. At the trailing edge, pressure variation of about 11 kPa is observed ranging from 84 to 95 kPa during phase-I. On the suction side (S51), the lowest pressure is about 89 kPa. After 7 s, the pressure at all the locations increases as the guide vanes open up. Oscillations in the plotted signals after the final position of the guide vanes are attributed to the runner vibrations of 0.57 Hz[6].
(4) Up to the synchronisation point, slight pressure variation in the draft tube appears. The sensors (DT11 and DT21) mounted in the draft tube cone show pressure oscillations of about 2 kPa after the synchronisation. As the guide vanes open further, the oscillation continued until the final position is achieved. The oscillations decrease and is dampened near = t23 s. The oscillation frequency is coupled with the step movement of the guide vanes similar to the upstream of the turbine.
Figure 4(b) shows the transient variation of the flow quantities and pressure at different locations in the turbine for the start-up scheme-II. The average speeds of the guide vanes opening during the phase-I and -II are about 1.9 and 0.0015 m/s, respectively. At = t2.9 s, the guide vanes hit 29% mark and the synchronisation is set on. The synchronisation is completed at t=8 s which is 1 s longer than the start-up scheme-I. Rapid opening of the guide vanes during phase-I may induce oscillations at the runner speed (about 1%) when reaching close to the synchronous speed. This has increased the time to stabilize the speed and torque output to perform a smooth synchronisation. In a prototype, speed variation above 1% may cause high fluctuations in the power output frequency and may not allow the generator to connect a load of 50 Hz frequency. At t=8 s, the generator was synchronized to the synchronous load followed by phase-II, i.e., opening of the guide vanes. 100% load is achieved at about t=14 s by continuous and speedy opening of the guide vanes with regard to the scheme-I.
Following are the observations from Fig.4(b).
(1) The head continuously drops by 7% from the initial steady state value. The torque and flow rate are increased with the guide vanes opening and stabilized at around t=15 s. The variation of measured quantities namely flow rate, head, and torque, are nearly continuous with no oscillation with respect to scheme-I.
(2) Pressure at the location PTX2 drops swiftly by about 9% during phase-II, whereas at the vaneless space, it varies according to the guide vanes position. Fluctuations of the VL01 signal for 0.2 s during the generator synchronisation are presented in the zoom window. The average of fluctuations over 0.1 s are observed around 1.3 times larger than that found during the scheme-I. Multiple frequencies near to the blade pass frequency in the vaneless space causing modulations of RSI frequency during synchronisation of the scheme-II.
(3) Transient pressure loading of the runner (P42, P71, and S51) shows almost similar variation as scheme-I. A zoom window shows lower and upper limits of the pressure oscillations between 4.2 s to 4.4 s. The fluctuations (P42) of the pressure fluctuations are much larger than the fluctuations observed during the transients of the scheme-I. The fluctuations evaluated for a window length of 0.18 s for the scheme-II are about ±14 kPa from the mean pressure value of 99 kPa at that instant. Time resolved average pressure shows almost equal amplitude for both the schemes, however, the instantaneous fluctuations considering one rotation of the runner show 1.3 times larger fluctuations. At the trailing edge (P71), the oscillations are even more pronounced, which is 1.4 times larger, compared to that of the scheme-I. During phase-I, the average (0.18 s) pressure difference between the pressure side (P42) and the suction side (S51) is about 38%, which is significantly larger compared to the other transient operations of load variations[6].
(4) Pressure measurement in the draft tube during scheme-II shows small fluctuations. The pressure dropped to 100 kPa (t=7 s) and is immediately recovered to 101 kPa (t=8s) during synchronisation. Sudden rise and drop of the pressure is observed after the synchronisation and then dampened. The pressure fluctuations of the oscillations are about 4 kPa around the mean value of 101 kPa, which are almost two times larger than those of the scheme-I. After the final position of the guide vanes, the scheme-I shows pressure difference between the two pressure values (DT11 and DT21) of about 3%, whereas scheme-II shows no difference. The different fluctuations of the pressure at both the locations suggest an asymmetrical flow in the draft tube, indicating that the guide vanes operating scheme may influence the flow field moderately.
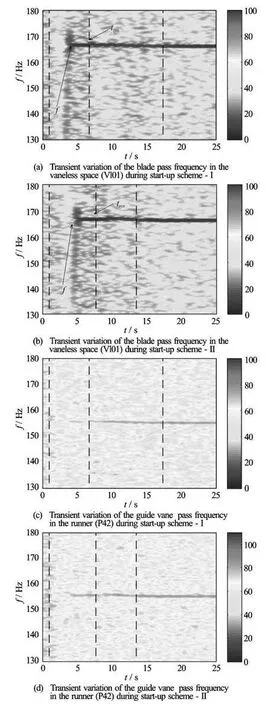
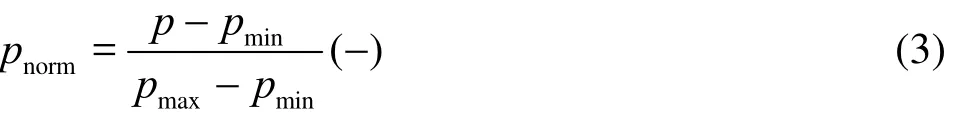
Fig.5 Transient variation of the guide vane passing and the blade pass frequencies during start-up
Figure 5 shows the transient variation of RSI frequencies in the vaneless space and the runner. Up to 1 s, the runner is in standstill condition and the guide vanes are closed. After 1 s, the guide vanes opened and water starts to flow into the runner and free spinning of the runner shows up. The runner speed slowly increases with the opening of the guide vanes. As a blade passes a guide vane, a pressure wake develops, and propagates in the vaneless space and the runner. The frequency of the wave propagation increases with the increase of the runner speed, furthermore, the former indicates the instantaneous speed of the runner since the blade numbers are fixed (30).
Figure 5(a) shows the variation in the blade pass frequency during start-up scheme-I. The speed of the runner monotonically increases and attains the synchronous speed (fn) of 5.54 Hz at t=3.1 s. The frequency of the developed pressure wave, captured by the sensor mounted in the vaneless space (VL01) increases from 0 to 166 Hz during 1 to 3.1 s, and is synchronisation time marked as tsyn. Oscillations in the frequency are observed close to 3.2 s which are caused by the runner speed fluctuations (0.7%) during the synchronisation process. At another frequency of 83 Hz, the first overtone of 166 Hz is observed after = t8 s with a very small amplitudes (<1kPa) which is not visible in the plot. Figure 5(b) shows the variation in the blade pass frequency during start-up scheme-II. The runner attained synchronous speed at t= 2.9 s. The variation in the blade passing frequency at the time of tsynis attributed to the runner speed fluctuations (≈1%). The runner speed is constant after the synchronization, hence the blade passing frequency is 166 Hz for both the start-up schemes.
Figures 5(c)-5(d) shows the transient variations of the guide vane passing frequency in the runner at the location P42. Pressure waves developed due to interactions of the guide vanes and the blades propagating to the blade rows and captured by the sensor located in the runner. The frequency at the time of the runner acceleration is not well captured due to continuous influx of water mass. A frequency of 155 Hz at the location P42 is seen after successful synchronization and constant speed of the runner. Variability in the frequency due to the guide vanes angular movement is clearly seen in both the plots during phase-II opening. Sudden acceleration/deceleration of the flow might have caused a rapid pressure variation in the cyclic way. Continuous variation of the guide vane passing frequency may be attributed to the unsteady pressure variation on the blade surface. Several frequencies with large amplitudes (30 kPa-50 kPa) is also due to the complex flow field in the runner during transients which is not present in the vaneless space, see Figs.5 (a)-5(b).
During the turbine start-up scheme-II, the guide vanes operated with almost double speed than the start-up scheme-I. Total head drop across the machine is similar, ~7%, however, during the scheme-II, the head drops by 9% and retrieves by 3% after the finalpositions of the guide vanes is achieved. During the start-up, the discharge increases with opening of the guide vanes, whereas pressure at the inlet pipeline decreases. The pressure difference across the machine decreases by ~9%, whereas the velocity head increases by ~2%. Generator synchronization during the scheme-II is obtained 1 s later compared to the scheme-I. This is attributed to the runner speed fluctuations above 1% due to the rapid opening of the guide vanes. Pressure upstream of the runner (vaneless space) follows the guide vanes angular movement. The amplitudes during the scheme-II at the time of the generator synchronization are about 1.3 times of that of the scheme-I. In the runner, the amplitudes are about 1.1 to 1.5 times of that of the scheme-I at the corresponding locations. The pressure sensors in the draft tube also shows the variations in the pressure fluctuations during both the schemes which is about 2times larger for scheme-II compared to that of the scheme-I, furthermore, during and after phase-II of the scheme-I, asymmetrical flow field is observed.

Fig.6 Variations in flow parameters during the turbine shutdown in 23 s (scheme-I) and 14 s (scheme-II) from 100% load considering the guide vanes operating case-4, CB open indicates circuit breaker open to decouple the generator from the minimum load
2.2 Shutdown
The transient measurements for shutdown case-4 (100-29-0) is presented in detail for the two schemes namely I and II (see Table 1). The shutdown for schemes-I and II follow the procedure of start-up schemes-I and II (case-4) in reverse order for the closing of the guide vanes which requires total time of 23 s and 14 s, respectively, for complete closure from 100% load. Variations of the flow variables, namely head (H), discharge (QT), torque (T), guide vanes angular movement (α) and pressure (p) at different locations during the shutdown, are presented in Figs.6(a) and 6(b) for the schemes-I and II, respectively.
Following are the observations from Fig.6(a).
(1) The guide vanes closing speeds during phase-I and II were about 0.00056 m/s and 0.00073 m/s, respectively. At t=1 s, the guide vanes start to close gradually and reach the position of minimum load(~26%) at about t=16 s at which the generator is decoupled (CB open) and set the runner to no-loadspin (tnls). The runner rotation stops at t≈23 s, when the guide vanes are closed completely. Flow rate and torque follow the trend of the guide vanes movement, whereas the net head across the turbine continuously increases with the closure of the guide vanes. The head oscillations are associated with the step closing of the guide vanes during phase-I (tgen.). About 2% of head has dropped during phase-II and stabilized at the operating value of 12.4 m at about t=19 s. No further variation is observed similar to the start-up schemes.
(2) Pressure at the location PTX2 rises with oscillations on closing of the guide vanes. The step closing may have developed pressure waves to cause pressure oscillations in the inlet pipe. During phase-II, the amplitude of oscillations are about ±2.5 kPa from the average pressure of 221 kPa. The pressure at the vaneless space (VL01) decreases with the closing of the guide vanes. Sudden drop in the pressure is observed immediately after decoupling of the generator from load at around 18 s. A zoom window inside the plot shows instantaneous pressure variation between 15.5 to 15.7 s when the circuit breaker (CB) is opened and the runner set to no-load-spin. An average pressure oscillation of ±3kPa from the mean value of 150 kPa is found. After decoupling the generator, runner speed is slowed down with further closing of the guide vanes and the pressure in the vaneless space decreases accordingly.
(3) Pressure oscillations in the runner are found larger than that of the vaneless space during shutdown of the generator. Instantaneous pressure fluctuations at the location P42 shows variation from 0.5 to 0.74 during 15.5 to 15.7 s, see zoom window. The averaged peak to peak pressure fluctuations at the time of CB open are about 24 kPa. The fluctuations are about two times higher than that of the generator synchronisation during start-up of the turbine. Moreover, significant pressure variation is observed during 21 to 23 s besides smooth closing of the guide vanes which is almost similar to that observed during start-up of the turbine (tnls).
(4) Pressure at the locations DT11 and DT21 increases with the closure of the guide vanes since the flow rate to the runner and draft tube decreases. At = t15 s, the pressure drops from 105 kPa to 101 kPa as the generator shuts down and free spin of the runner begins. At t=17 s, the pressure rises and decreases monotonically with further closing of the guide vanes. Momentary release of the load from the runner may be affected the pressure at the runner downstream. Similar pressure drop at the time of CB open is also observed at the upstream of the turbine, at location PTX2.
Figure 6(b) shows variation of the flow variables along with the guide vanes angular movement during the turbine shutdown scheme-II. The average speeds of the guide vanes closing during the phase-I and phase-II movement were about 0.0015 m/s and 0.0024 m/s, respectively.
Following are the observations from Fig.6(b).
(1) Discharge (QT) and torque (T) follow the trend of movement of guide vanes. The head variation is similar to the that in shutdown scheme-I besides the oscillations. The pressure in the inlet pipe (PTX2) increases continuously with closing of the guide vanes during phase-I movement and drops to the operating value soon after phase-II movement of the guide vanes, i.e. at t=7 s. Pressure oscillations during and after tnlsare smaller compared to the shutdown scheme-I. Pressure variation at the vaneless space location VL01 corresponds to the trend of the guide vanes movement and the average amplitudes of the pressure oscillations during the generator decoupling time (t= 1.5 s) are observed about 2% larger than that of the shutdown scheme-I. The RSI frequency and the fluctuations are presented in the zoom window. The instantaneous pressure oscillations during tnlsare about 1.3 times larger than that of the scheme-I.
(2) The pressure values on the runner blades at the locations P42, P71, and S51 continuously decrease with the closing of the guide vanes up to t=7 s. The frequency of oscillations is found as 0.57 Hz which may be attributed to the runner vibrations[6]. Instantaneous pressure fluctuations at the location P42 are almost 1.4 times larger than that of the scheme-I. Thefrequencies of the oscillations in the zoom window correspond to the interaction of the runner blade and the guide vanes, which correspond to the runner speed after CB is opened. In the last phase of the guide vanes closing, large pressure peaks are seen similar to the scheme-I at all the measurement locations in the runner. The maximum peak is observed at the trailing edge (P71), which is about 1.3 times larger than that of the scheme-I.
(3) The pressure variations at the runner downstream locations DT11 and DT21 show almost similar pressure variations during phase-I, however a difference of 0.8 kPa is noticed during phase-II. The variation may be attributed to an asymmetrical flow leaving the runner during free spinning, since this is not clearly observed in the shutdown scheme-I.
Figure 7 shows the transient frequency variation at two locations, namely vaneless space (VL01) and runner (P42) with the closing of the guide vanes. Figures 7(a)-7(b) show the transient variations of the frequency developed due to the interaction of the blade and the guide vane at the location VL01. The captured RSI frequency at VL01 is 166 Hz which is constant till CB opens at t=15 s and t=7 s for the schemeI and II, respectively. The generator is shutdown after opening CB, however the mechanical inertia of the runner and the water flowing to the runner causes the runner to spin continuously even after decoupling of the generator. The blade pass frequency in the vaneless space decreases with the decrease of the runner speed. The runner deceleration and no spin condition are observed at t=18 s and 23 s, and t= 10.6 s and 14 s for the scheme-I and II, respectively. Average amplitudes after decoupling the generator during the schemes-I and II are about 41 kPa and 53 kPa, respectively. Rapid closing of the guide vanes in scheme-II could cause large amplitude pressure fluctuations in the vaneless space compared to the turbine shutdown scheme-I.
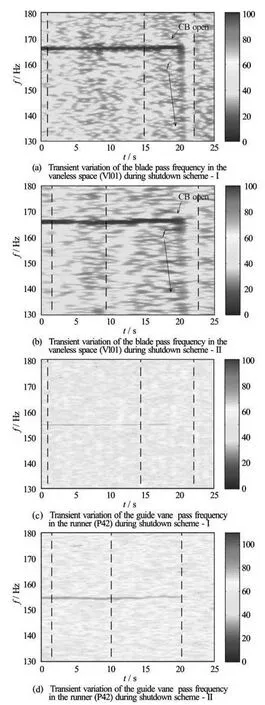
Fig.7 Comparisons of frequency variations during turbine shutdown in 23 s (scheme-I) and 14 s (scheme-II) from 100% load considering the guide vanes operating case 100-29-0
When a guide vane passes a blade, pressure waves are developed and travel to the runner. The spectrograms presented in Figs.7(c)-7(d) show the variations of the guide vane passing frequency at the location P42 corresponding to the angular speed of the runner. Up to the point of CB open, the constant frequency of 154 Hz is seen for both the schemes. The instantaneous variation of the frequency can be seen clearly with respect to time and step movement of the guide vanes. The closing of the guide vanes may have created vortices in the vaneless space. Significant variation of the pressure at the time of opening of CB open may have caused instantaneous flow unsteadiness in the blade rows which is observed as strong aberration of the frequency at t≈16s-18s for the scheme-I and t≈ 7 s-12 s fo r the sche me-II. When the speedslowsdown,thefrequencycompletelydisappears due to no flow to the runner. Several other frequencies of similar amplitudes as the guide vanes passing frequency can be seen in the spectrogram, in-dicating a very complex flow field in the runner.
Significant variations in the flow parameters are observed during both the shutdown schemes as compared to the start-up schemes. The guide vanes closing speed under the shutdown scheme-II is about 3 times of that of the scheme-I. The step closing of the guide vanes in scheme-I induces pressure fluctuations of about 4 kPa in the inlet pipe. Pressure fluctuations in the vaneless space, during scheme-II movement, are about 1 kPa larger than that of the scheme-I. In the runner, pressure oscillations are up to 1.5 times of their corresponding values during start-up schemes, indicating the larger pressure amplitudes on the blade surfaces, similar amplitudes are given in the analysis of the transient frequency variation in the runner, see Figs.7(c)-7(d). The pressure amplitudes during shutdown scheme-II are about 20%-40% larger than that of the scheme-I. This may induce more instabilities and fatigue stresses to the blades during incompetent closing of the guide vanes for the shutdown of the turbine.
3. Conclusions
The transient pressure measurements considering three schemes each for opening and closing of guide vanes for four operating points have been carried out. Experimental investigations of the most representative operating conditions of a high head model Francis turbine have been discussed in detail. Two schemes of the guide vanes opening are presented such as slow/ normal start-up (scheme-I) and rapid start-up (scheme-II). Two schemes of the guide vanes closing are presented such as slow/normal shutdown (scheme-I) and rapid shutdown (scheme-II) of the turbine. During rapid start-up and shutdown the turbine, the guide vanes are opened and closed with almost double speed than the normal speed of opening and closing, respectively. The Following conclusions are drawn based on the transient measurements performed during the turbine start-stop and post processing of the acquired pressure-time data.
(1) The overall variation of the net head across the turbine is about 7% for the operating value of 12.5 m. However, the variation is almost negligible(<5%) during no-load spinning of the runner. The other flow variables such as discharge and the runner output torque correspond to the guide vanes movement during start-up and shutdown.
(2) Pressure fluctuations at the turbine inlet are observed as a function of the guide vanes movement. For an operating pressure of 221 kPa, scheme-I induced fluctuations up to ~5 kPa since the guide vanes are closed in several small steps. The pressure variation during scheme-II is non-oscillating and continuous due to continuous closing of the guide vanes.
(3) Pressure at the vaneless space is not much influenced by the guide vanes movement, however the instantaneous fluctuations are significantly affected by the opening and closing of the guide vanes. During opening and closing of the guide vanes, the fluctuations are about 35 kPa and 53 kPa, respectively, indicating the turbine shutdown is more damaging than the start-up. A frequency of 166 Hz has been captured at the vaneless space and the draft tube which corresponds to the blade passing frequency in the stationary domains.
(4) The maximum pressure fluctuations in the turbine are observed in the runner during shutdown. The spectrogram of transient variation of the guide vane passing frequency shows the amplitude of about 60 kPa during rapid closing of the guide vanes along with several other frequencies of similar amplitudes at three locations namely pressure side, trailing edge, and suction side of the blade. Large pressure amplitudes of the guide vanes passing frequency may cause fatigue to the runner blades and increase the wear. An incompetent movement of the guide vanes results in increased unsteadiness in the runner flow field during transients which may induce low cycle fatigue to the runner blades.
(5) An instantaneous transient pressure difference, between the two sensors located in the draft tube cone at the same distance from the runner outlet, has been observed during both the schemes of start and shutdown, suggesting an asymmetrical flow leaving from the runner.
Acknowledgements
Chirag Trivedi and Prof. Michel Cervantes are grateful to the Swedish Waterpower Centre (SVC) for the financial support. SVC has been established by the Swedish Energy Agency, Elforsk and SvenskaKraftnät together with Luleå University of Technology, the Royal Institute of Technology, Chalmers University of Technology and Uppsala University (www.svc.nu).
[1] TRIVEDI C., BHUPENDRA G. and CERVANTES M. J. Effect of transients on Francis turbine runner life: A review[J].Journal of Hydraulic Research,2013, 51(2): 121-132.
[2] DESCHÊNES C., FRASER R. and FAU J.-P. New trends in turbine modelling and new ways of partner- ship[C].IGHEM.Toronto, Canada, 2002, 1-12.
[3] CHIRAG T., CERVANTES M. J. and BHUPENDRA G. et al. Experimental and numerical studies for a high head Francis turbine at several operating points[J].Journal of Fluids Engineering,June 2013, 135(11): 111102.
[4] BAKKEN B. H., BJØRKVOLL T. Hydropower unit start-up costs[C].Power Engineering Society SummerMeeting,Chicago, USA, 2002.
[5] NICOLET C., RUCHONNET N. and ALLIGNÉ S. et al. Hydroacoustic simulation of rotor-stator interaction in resonance conditions in Francis pump turbine[J].IOP Conference Series: Earth and Environmental Scie-nce,2010, 12(1): 012005.
[6] CHIRAG T. Transients in high head Francis turbines[D]. Licentiate Thesis, Luleå, Sweden: Luleå University of Technology, 2013.
[7] NICOLLE J.-F. M., GIROUX A.-M. Transient CFD simulation of a Francis turbine startup[C].The 26th IAHR Symposium on Hydraulic Machinery and Sys-tems.Beijing, China, 2012.
[8] GAGNON M. TAHAN S. A. and BOCHER P. et al. Impact of startup scheme on Francis runner life expectancy[J].Earth and Environmental Science,2010, 12(1): 012107.
[9] ZHANG Li-xiang, WANG Wen-quan and GUO Yakun. Intrinsic features of turbulent flow in strongly 3-D skew blade passage of a Francis turbine1[J].Journal ofHy- drodynamics, Ser. B,2007, 19(1): 92-99.
[10] WANG Fu-jun, LI Xiao-qin and MA Jia-mei et al. Experimental investigation of characteristic frequency in Unsteady hydraulic behaviour of a large hydraulic turbine[J].Journal of Hydrodynamics,2009, 21(1): 12- 19.
[11] LIU Ying-zheng, CHEN Han-ping and KOYAMA Hide S. Joint investigation of rotating flow with vortex breakdown using CFD, visualization and LDV[J].Journal ofHydrodynamics, Ser. B,2005, 17(4): 455-458.
[12] DORFLER P., SICK M. and COUTU A.Flow-induced pulsation and vibration in hydroelectric machinery[M]. First Edition, London, UK: Springer, 2012.
Nomenclature
BEP-Best efficiency point
D-Runner diameter
f-Frequency
fn-Runner frequency
g-Gravity
GV-Guide vane
H-Net head across the turbine
NTNU-Norwegian university of science and technology
n-Runner speed
RSI-Rotor stator interactions
r-Radius of the guide vanes trailing edge from the center axis
T-Torque
t-Time
t0-Standstill condition of the runner
tnls-No load spin of the runner
tgen.-The generator power increases/decreases
ttorque-Very slow movement of the guide vanes to meet the exact power of the set value
tsteady-Steady state power output
tgv-Slow closing of the guide vanes
vgv-Speed of the guide vanes movement
Δp -Differential pressure across the turbine
Greek symbol
α-Angular position of guide vanes
ω-Angular speed
ρ-Density of the water
Subscript
0-Initial condition
1-Final condition
gen.-Change in generator power output or runner torque output
gv-Guide vanes
max-Maximum
min-Minimum
nls-No-load-spin of the runner
norm-Normalized
h-Hydraulic
M-Model
P-Prototype
T-Torque
steady-Steady state operating condition
10.1016/S1001-6058(14)60031-7
* Biography: TRIVEDI Chirag, Ph. D. Candidate
CERVANTES Michel J., E-mail: Michel.Cervantes@ltu.se

- 水动力学研究与进展 B辑的其它文章
- Numerical prediction of 3-D periodic flow unsteadiness in a centrifugal pump under part-load condition*
- Coupled hydroelastic vibrations of an elliptical cylindrical tank with an elastic bottom*
- Improved conservative level set method for free surface flow simulation*
- Capillary effect on the sloshing of a fluid in a rectangular tank submitted to sinusoidal vertical dynamical excitation*
- Effect of compressive stress on the dispersion relation of the flexural–gravity waves in a two-layer fluid with a uniform current*
- Comprehensive analysis on the sediment siltation in the upper reach of the deepwater navigation channel in the Yangtze Estuary*