
Numerical Modeling and Analysis of Gas Entrainment for the Ventilated Cavity in Vertical Pipe*
2014-07-24 15:40XIANGMinJIANGZhenyu江振宇ZHANGWeihua张为华andTUJiyuan屠基元
关键词:基元
XIANG Min (向 敏), JIANG Zhenyu (江振宇), ZHANG Weihua (张为华)and TU Jiyuan (屠基元)
1Collage of Aerospace Science and Engineering, National University of Defense Technology, Changsha 410073, China
2Institute of Nuclear and New Energy Technology, Tsinghua University, Beijing 100084, China
3School of Aerospace, Mechanical and Manufacturing Engineering, RMIT University, Victoria 3083, Australia
Numerical Modeling and Analysis of Gas Entrainment for the Ventilated Cavity in Vertical Pipe*
XIANG Min (向 敏)1,2,**, JIANG Zhenyu (江振宇)1, ZHANG Weihua (张为华)1and TU Jiyuan (屠基元)2,3
1Collage of Aerospace Science and Engineering, National University of Defense Technology, Changsha 410073, China
2Institute of Nuclear and New Energy Technology, Tsinghua University, Beijing 100084, China
3School of Aerospace, Mechanical and Manufacturing Engineering, RMIT University, Victoria 3083, Australia
A semi-empirical gas entrainment model was proposed for the ventilated cavity in vertical pipe, based on which, a complete numerical scheme was established by coupling with the Eulerian-Eulerian two-fluid model to predict the multiscale flow field created by ventilated cavity. Model predictions were validated against experimental measurements on void fraction and bubble size distributions. Simulations were carried out to explore the effect of ventilation rate and inlet turbulence intensity on the macroscale cavity shape and the bubbly flow downstream of the ventilated cavity. As the ventilation rate increasing, a reverse trend was observed for the void fraction and bubble size distributions. It is concluded that the average void fraction in the pipe flow region is determined by the volumetric ratio between liquid and gas. However, the bubble size evolution is dominated by the breakage effect induced by turbulence in the vortex region. Furthermore, simulations were conducted to analyze geometric scale effect based upon Froude similitude. The results imply that the velocity distributions were properly scaled. Slight scale effect was seen for the void fraction caused by faster dispersion of bubbles in the larger size model. The comparatively greater bubble size was predicted in the smaller model, implying significant scale effects in terms of turbulence and surface tension effect. It reveals that empirical correlations valid in wide range are required for the extrapolation from small-size laboratory models.
ventilated cavity, gas entrainment, bubbly flow, simulation
1 INTRODUCTION
The flow phenomenon of a ventilated cavity is frequently encountered in practical situations such as U-tube fermenters and airlift bioreactors [1]. The ventilated cavity refers generally to a large Taylor bubble attached to a gas-injecting nozzle in a downward flow pipe as depicted in Fig. 1. Gas entrainment, by which gas is introduced into the liquid in the form of gas bubbles due to the action of turbulence and surface tension, occurs at the bottom of the ventilated cavity. The bubbly flow region containing numerous and diverse bubbles is generated downstream of the ventilated cavity which dominates the mass and momentum transfer characteristics between gas and liquid. Three dynamical multiphase phenomena are coupled: (1) macroscale cavity formation, (2) gas entrapment and breakup at the cavity bottom, and (3) dispersion of bubbles and its effect on the liquid phase turbulence, posing a tremendous challenge in comprehending this kind of multiscale two-phase flow.
Numerous studies have been undertaken to better understand the basic phenomenas involved in the gas entrainment process. Some research [1-3] was focused on establishing relationships for the cavity length and bubble entrainment rate and correlating them with gas and liquid flow rates, and concluded that the gas entrainment rate was affected by the turbulence intensity, jet velocity, liquid surface tension and viscosity etc. Other paper [4-6] concentrated on the flow patterns in the bubbly flow region generated by gas entrainment. In particular, Su [4] observed three different regions including the vortex region, transitional region and pipe flow region behind the cavity as shown in Fig. 1, validating the complexity and diversity of the generated bubbly flow. Most of the previous experimental research was carried out in the vertical pipe with diametersranging between 50 mm and 100 mm, providing primary knowledge on the gas entrainment process. However, considering the large number of relevant parameters affecting the gas entrainment process including fluid properties, pipe geometry, inflow conditions, and entrained air bubble characteristics, it is hard to perform parameter sensitivity study for this phenomenon.
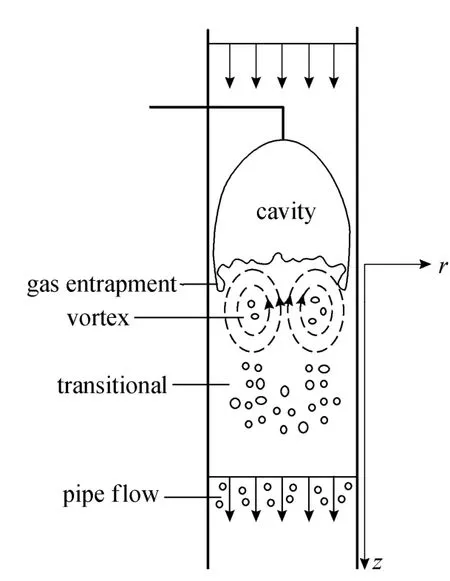
Figure 1 Schematic of the flow field below ventilated cavity [5]
Furthermore, due to the multiscale characteristics imbedded in this problem, an extreme difficulty is induced in carrying out similarity analysis of this two-phase flow. The Froude number similitude [7, 8] is needed for the macroscale cavity while a Weber similitude is required for the entrapment of air bubbles which is dominated by surface tension effects. Furthermore, the momentum exchanges between cavity and streaming film flow which is dominated by viscous effects implies the need for a Reynolds similitude. For geometrically-similar models, it is impossible to satisfy simultaneously Froude, Reynolds and Weber similarities. Therefore, the gas entrainment process for a ventilated cavity may be affected by significant scale effects.
To date, little research has been conducted at the parameter sensitivity study on the gas entrainment for ventilated cavity due to the limit knowledge on the microscale nature of the slug flow. In our previous study [9], a numerical model, based on the Eulerian-Eulerian two-fluid model coupled with the population balance model, has been successfully established to predict the turbulent two-phase flow structure as well as the bubble size distribution downstream of a ventilated cavity. In this study, the previous work is extended by developing a gas entrainment model based on the analysis of the gas entrainment mechanisms. A complete numerical scheme which is capable of predicting the gas entrainment process for a wide range of flow situations is then established by integrating the gas entrainment model into the two-fluid model. The proposed models are validated against the experimental work carried out by Su [4] and Delfos et al [5]. Particular emphasis is then directed towards investigating the effect of ventilation condition, inlet turbulence intensity and geometric scale acting on the bubbly flow downstream of the ventilated cavity. The numerical results will provide us deeper information on the flow field generated by gas entrainment, helping us to condense valuable insights to enhance this two-phase system performance.
2 SEMI-EMPIRICAL GAS ENTRAINMENT MODEL
According to Chanson [10], gas entrainment at a ventilated cavity tail is governed by the free surface gas entrainment caused by plunging jet. It is well established that when the water jet velocity Ujat the cavity base is less than a certain threshold velocity Ue, no gas entrainment takes place. When it exceeds the onset velocity, the gas entrainment is clarified into two regimes. (1) When the jet velocity is small (lower than 4-6 m·s−1), gas may be captured in the induction trumpet caused by the surface roughness [11-13] as shown in Fig. 2. Subsequently, the entrained gas pockets are broken up into small bubbles which are then dragged into the liquid bulk. (2) When the water film jet velocity increases further, the gas entrainment is accomplished dominantly by the boundary layer gas entrainment mechanism [14, 15]. Presently, we restrict ourselves to the first regime in this paper.
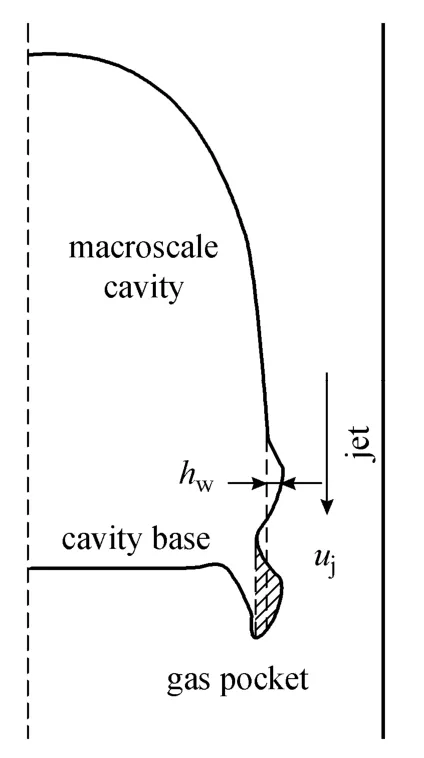
Figure 2 Schematic of gas entrainment at the cavity base
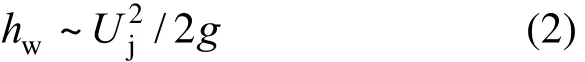
The volumetric rate of gas entrainment per unit peripheral length at the cavity base is considered to be proportional to the jet velocity Ujand the surface roughness hw[16]:

The surface roughness is proved to be proportional to the kinetic of the liquid jet [11, 12, 17]:
According to the experimental results [16], an intermittence factor Iwhas to be introduced to consider the probability of the surface fluctuation. Based on the assumption that the increase of intermittency on the surface of the falling film shows a similar behavior as the growth of turbulent spots in a boundary layer [18], Iwfor ventilated cavity in vertical pipe is calculated as the following formula:
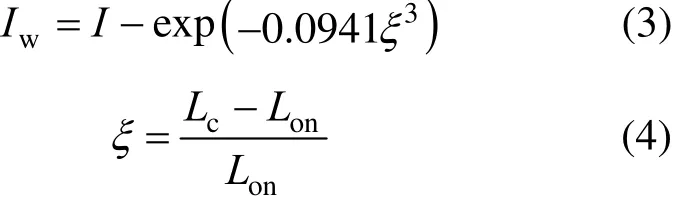
where Lcrefers to the cavity length, Lonis the cavity length for the onset of gas entrainment which is calculated according to the onset velocity for gas entrainment. This formula was firstly validated in a vertical pipe with 100 mm diameter and the cavity length vary from 1D to 15D. In our research, this formula is used in small diameter pipe ranging from 50 mm to 200 mm, and the cavity length in the pipe varies from 1D to 20D. The final volumetric gas entrainment rateis expressed as

where Dcrepresents the cavity base diameter, and C1is an adjustable constant according to the experimental condition [12]. In this paper, a value of 2.5×10⁻⁴was adopted for C1which is in accordance with the plunging jet. The water jet velocity at the cavity tail is obtained according to the mass conservation:
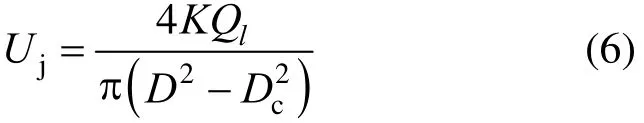
where Qlis the inlet liquid volumetric rate, and K is a proportionality constant with a value of 1.2 adopted [19].
It is imperative that the cavity boundary is appropriately defined in order to calculate the cavity diameter and jet velocity at the cavity base. The cavity profile proposed by Dumitrescu [20] is used in this study:
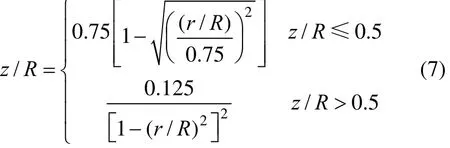
where z refers to the axial distance from the cavity top where the cavity diameter is zero, r represents the radial coordinate and R is the pipe radius. In the case of a long confined cavity, if the gravity acting on the film is balanced by the shear force, the film thickness will reach a constant value which can be calculated from the following correlation given by Henstock and Hanratty (1979):
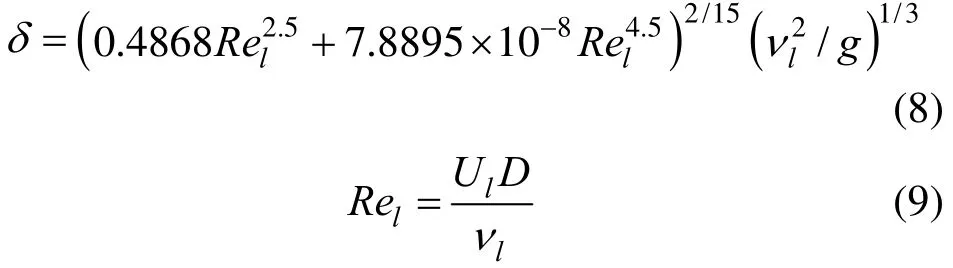
where Ulis the liquid velocity at the inlet,lν is the kinematic viscosity and D represents the pipe diameter.
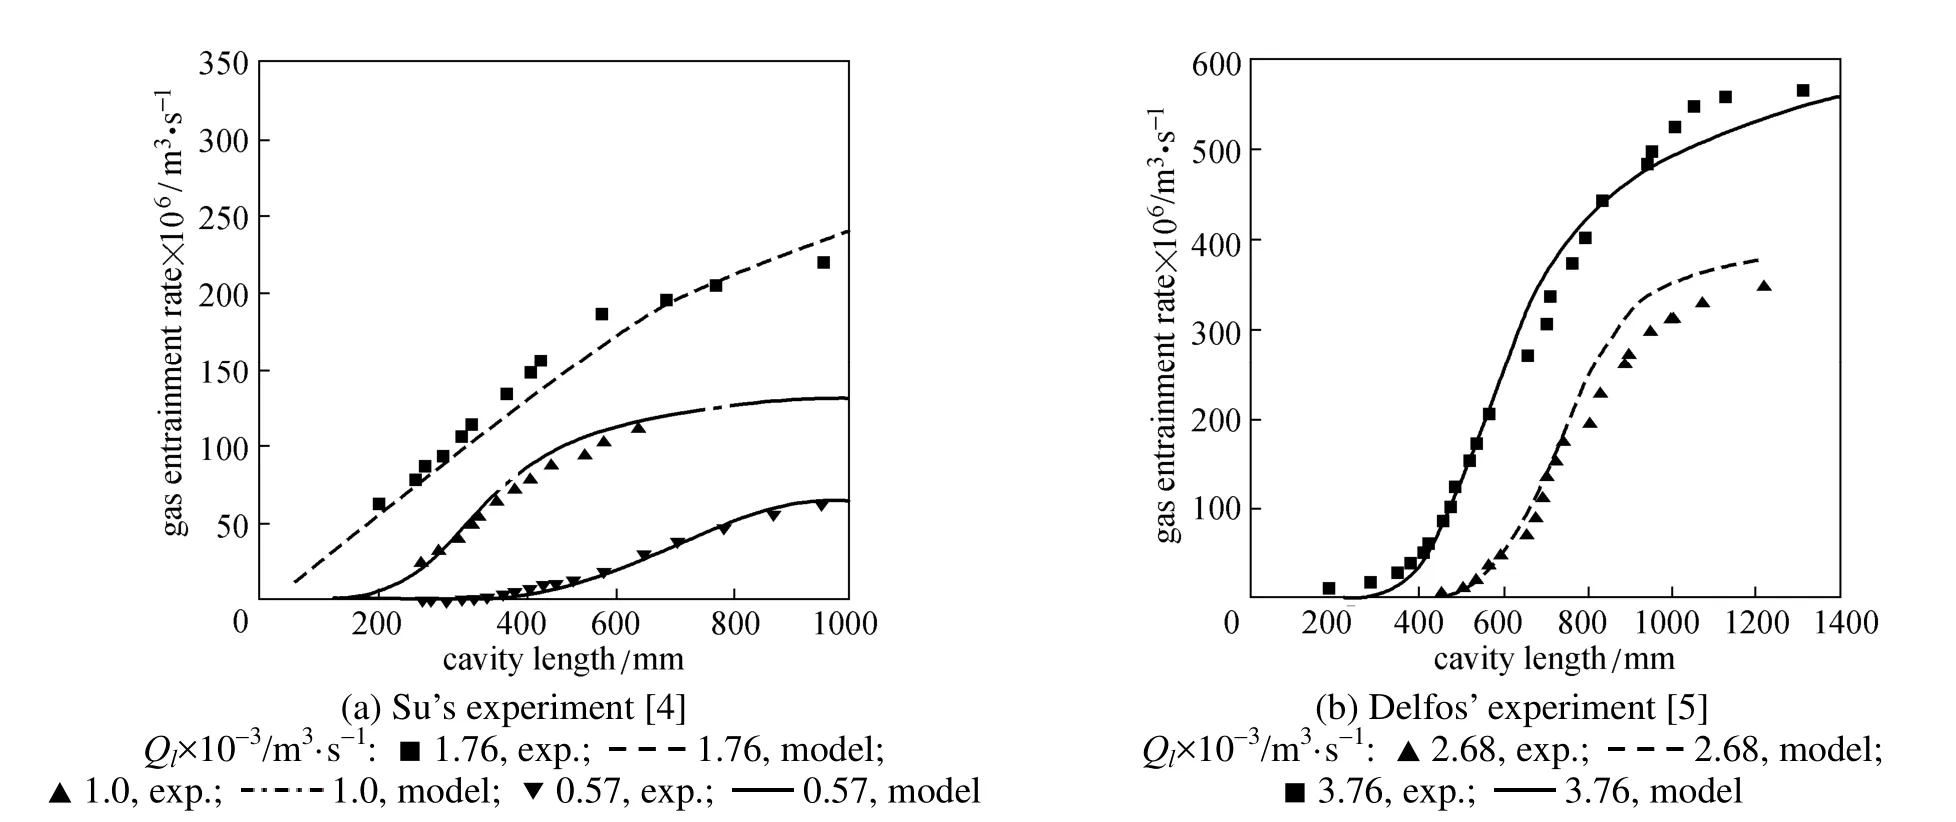
Figure 3 Comparison between predicted gas entrainment rate with experimental data
Due to the limited information on the size of the inception bubbles, the entrained bubble size is taken to be the maximum stable bubble diameter rmaxin the mixing zone behind the cavity. The bubble diameter is calculated using the following formula which was validated through comparison with experiments carried out in a vertical pipe with 50 mm diameter and the inlet liquid velocity range from 0.5 to 1 m·s−1[21]:
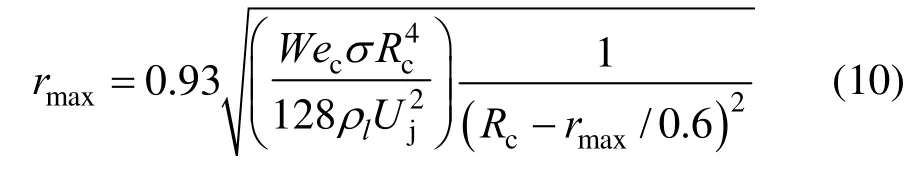
where Wecis the critical Weber number for breakage with a value of 4.7 adopted. σ refers to the surface tension coefficient and Rcis the cavity radius.
The experimental data on vertical pipes with different size by Su [4] and Delfos et al. [5] were employed to assess the model predictions. Considering the similar low turbulence level existing in the experiments, a constant onset velocity of 1 m·s−1for gas entrainment was adopted according to empirical formula for the vertical circular plunging jet [22]. Given different liquid rates, the variation of gas entrainment rate along with cavity length was obtained as shown in Fig. 3. It was observed that higher inlet liquid rate induced shorter cavity length for the onset of gas entrainment. When the gas entrainment was inspired, the gas entrainment rate climbed up slowly at the initial stage due to the low probability of the surface fluctuation. Subsequently, the gas entrainment rate increased linearly along with the cavity length until reaching the maximum value gradually. The gas entrainment model is validated by good agreement with the experimental results.
3 TWO-FLUID MODEL
3.1 Mass and momentum conservation equations
The two-fluid model based on the Eulerian-Eulerianframework [23] solves the ensemble-averaged of mass, momentum and energy equations for each phase, whereby the liquid is considered as the continuum phase and the gas as disperse phase. Interactions between phases are effected via interfacial transfer terms for heat, mass and momentum exchange. Since there is no interfacial mass or heat transfer between the phases in the present study, the energy equation is not needed.
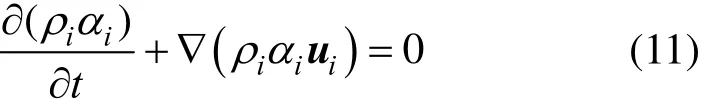
In the absence of interfacial mass transfer, the continuity equation of the two-phases can be written as where α, ρ and u are the void fraction, density and velocity vector of each phase. Subscripts i=l or g denote the liquid and gas phase respectively. The momentum equation can be expressed as:
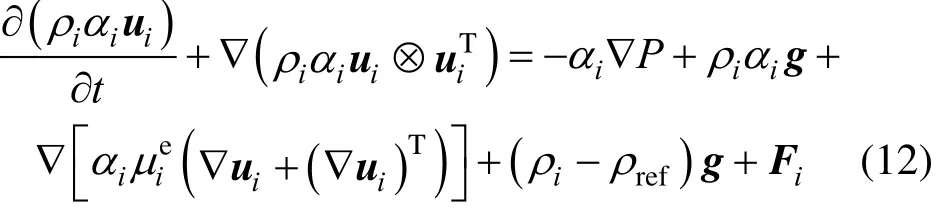
where ρlis adopted as the reference density ρrefto calculate the buoyancy force. Firepresents the interfacial forces for the interfacial momentum transfer and g is the gravity acceleration vector. It is noted that the interfacial forces appearing in the momentum equation strongly govern the distribution of the liquid and gas phases within the flow volume. Details of the different forces acting within the two-phase flow can be found in our previous work [9].
3.2 Population balance model
The population balance method is adopted to predict the size distribution of the poly-dispersed bubbles. The population balance equation is solved with application of the MUSIG model [9] which employs multiple discrete bubble size groups to represent the population balance of bubbles. Assuming each bubble class travel at the same mean algebraic velocity, individual number density of bubble class k can be expressed as [24]
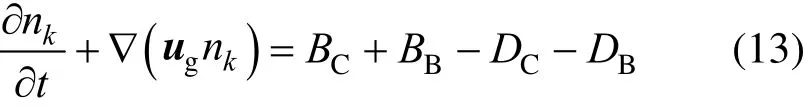
where nkis the average bubble number density of the kth group, the source terms BC, BB, DCand DBare the birth rates due to coalescence and break-up, and the death rate due coalescence and break-up of bubbles respectively. Details of the break-up and coalescence rate can be found in our previous work [9].
3.3 Turbulence model
Turbulence model is required to close the terms of effective viscosity in the Navier-Stokes equations. In this paper, separate turbulence model is adopted for gas and liquid. The effective viscosity of the liquid phase is considered as being composed of the molecular viscosity μl, the turbulent viscosity μt,land the bubble induced turbulent viscosity μt,b:

The two-equation k-ε model is applied for the liquid turbulent viscosity, as it offers a good compromise between numerical effort and computational accuracy, giving:
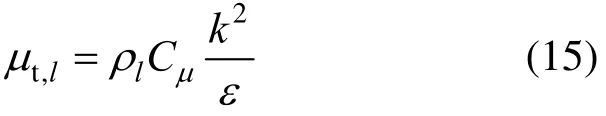
where k represents the turbulent kinetic energy of liquid and ε describes its dissipation rate, Cμis a model constant, k and ε are calculated from their transport equations [25].
The characteristics of the gas phase turbulence are deduced from the ones of the liquid phase as follows:
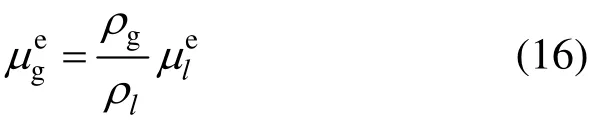
The extra bubble induced turbulent viscosity in Eq. (11) is evaluated according to the model by Sato et al. [26]:

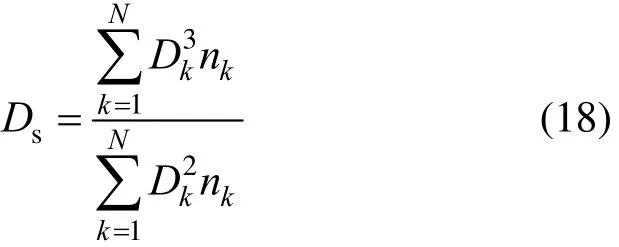
where Dsrepresents the Sauter mean bubble diameter and is calculated according to the diameter and number density of every bubble class:
4 EXPERIMENTAL AND NUMERICAL DETAILS
The experiments [4] carried out in a 3 m long vertical pipe with an internal diameter of 0.058 m by Su [4] are used for further investigation. A gas injection pipe was used to produce a metered flow of gas into the down flowing liquid stream to form a large attached cavity. The superficial liquid velocity Ulvaries from 0.27 to 0.9 m·s−1and the superficial gas velocity Ugfrom 0.01 to 0.1 m·s−1to form cavity with different length. Three cases as depicted in Table 1 are selected as the basis of simulation, where Qland Qgrefer to the liquid flow rate and gas ventilation rate respectively. Fr is the Froude number defined by inlet liquid velocity Uland pipe diameter D. Re is the Reynolds number defined by the liquid inlet velocity and pipe diameter.
The generic computational fluid dynamics (CFD) code ANSYS CFX12 was utilized to investigate the liquid flow around the ventilated cavity and the two-phase flow behavior downstream of the cavity. Numerical calculations were performed on a 45° radialsector of the pipe with symmetry boundary conditions imposed at both vertical sides of the pipe. Taking the liquid inlet as the reference datum, the outlet boundary was placed at a distance of 1.7 m downstream. The ventilated cavity generated at the injection pipe was placed 100 mm downstream of the pipe inlet. The cavity length and boundary profile which were calculated through the air entrainment model and assumed to be fixed during the simulation. Therefore, the gas field inside the cavity was excluded from the computational domain. A velocity inlet is set up at the pipe inlet, while a mass flow inlet boundary condition is specified at the circumference of the cavity base for the entrained bubbles. A low turbulence intensity of 1% based on velocity magnitude was specified at the liquid inlet. The bubble inlet thickness is determined based on the initial bubble diameter which is estimated using Eq. (7).
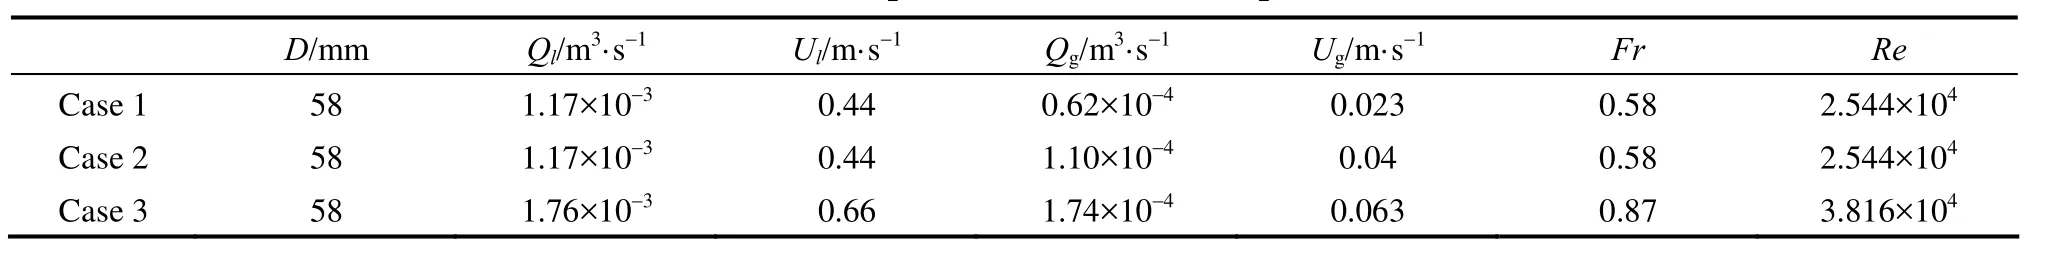
Table 1 Experimental cases description
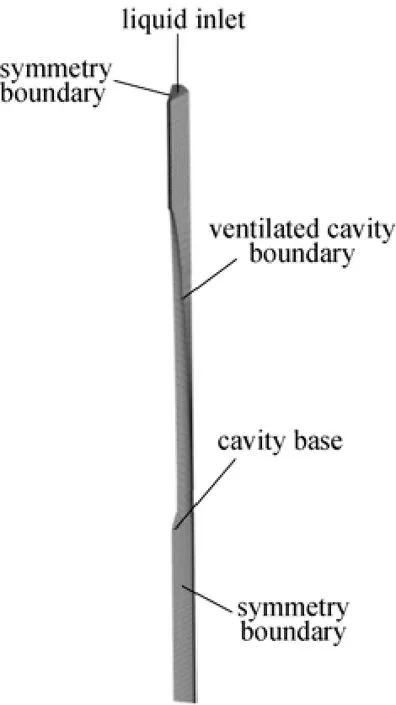
Figure 4 Visualization and mesh distribution of computational model
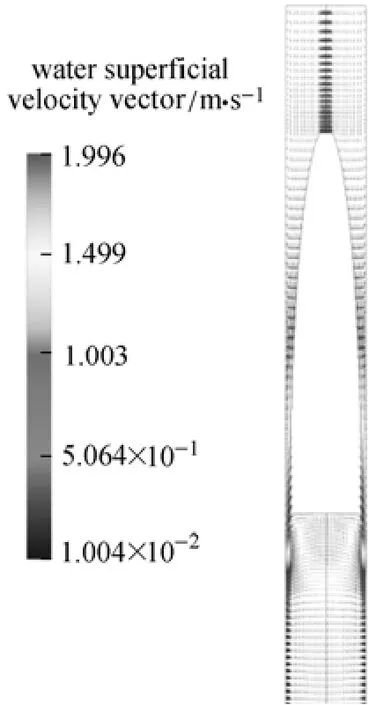
Figure 5 Water velocity vector distribution for Case 2
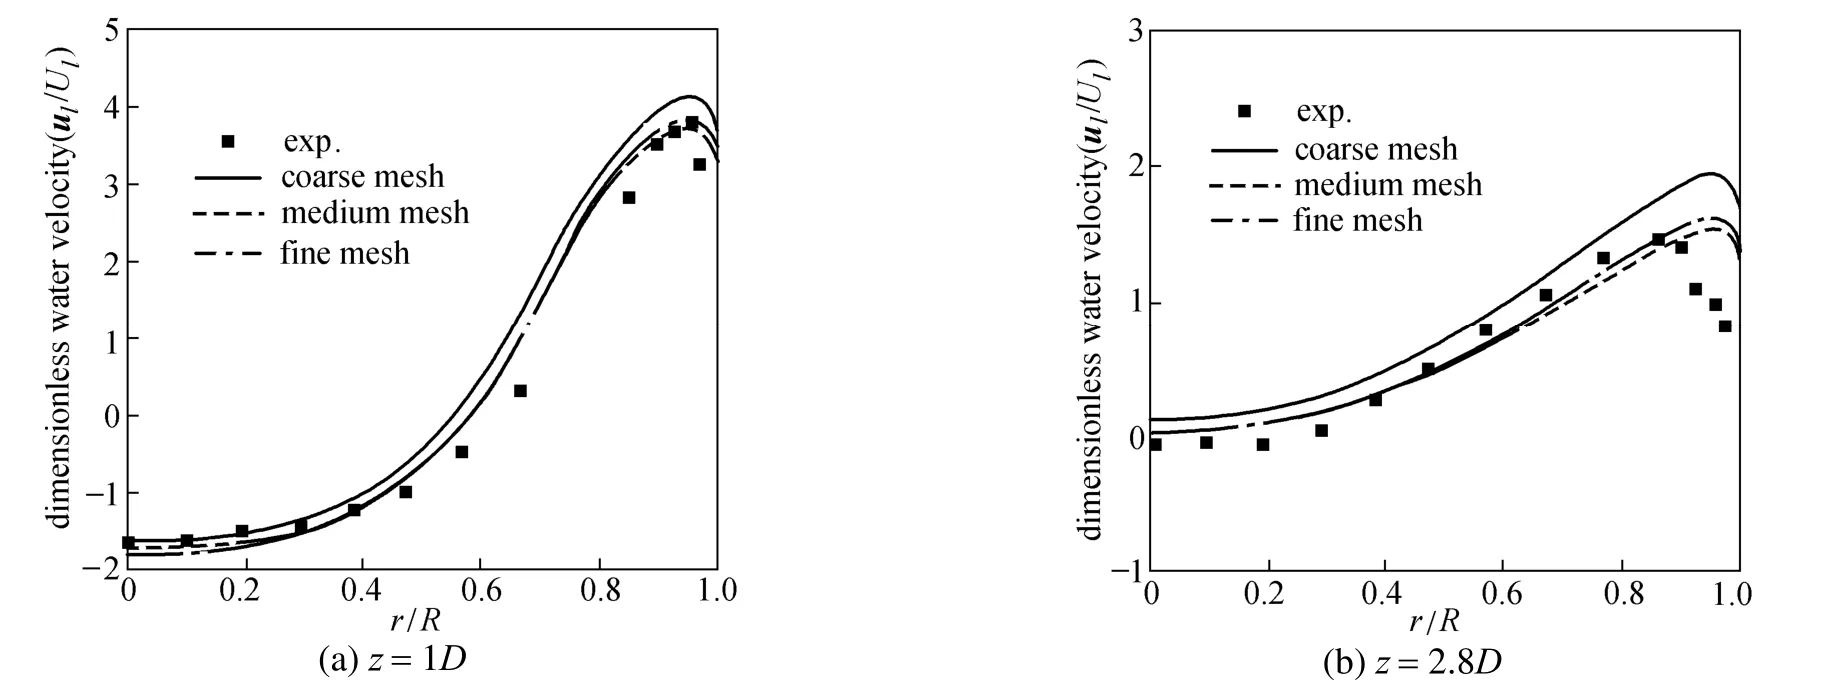
Figure 6 Dimensionless water velocity distribution downstream cavity base for Case 2 (z: axial distance from the cavity base)
The mesh structure and boundary conditions were presented in Fig. 4. In order to carry out mesh sensitivity study, three levels of computational mesh consisting of around 30000 nodes (coarse), 60000 nodes (medium) and 120000 nodes (fine) were adopted. Fig. 5 gives the water vector distribution throughout the computational domain. The predicted water velocity distribution downstream of the cavity base for Case 2 using different mesh size were compared in Fig. 6 where the maximum differences between the mediumand fine mesh were less than 3%, indicating the numerical prediction was mesh independent. Therefore, the medium mesh with the maximum grid size taken as 4 mm and the minimum grid size taken as 0.6 mm was adopted for the following research. The transport equations of the two-fluid and population balance models were discretized by the finite volume approach. The convection terms were approximated by the high resolution scheme which uses a slope limiter to limit the gradient around shocks or discontinuities, while the diffusion terms were approximated by the second-order central difference scheme. These different schemes are detailed in the technical documentation for CFX 11 [27]. A fixed physical time scale of 0.001 s was adopted to achieve steady state solutions.
5 RESULTS
5.1 Influence of ventilation rate on the multiscale flow field
Figure 7 shows the cavity shape and the void fraction distributions for different cases. Resulted from a higher ventilation rate, the stable cavity length was increased by 50% for Case 2 compared with Case 1. The bubbly flow downstream the cavity was therefore affected. The size for the vortex regions characterized by high void fraction distributions and the nature of the swirling streamlines just below the base of the ventilated cavity was also presented in the figure. In comparison with Case 1, the vortex region length was expanded by 16% for Case 2, which was mainly caused by the higher jet velocity at the cavity tail. The detail distributions of the bubbly flow parameters including the void fraction and the Sauter mean bubble diameter at different axial positions are given in Fig. 8. A good agreement was observed between the predicted parameters and the experimental results. However, disagreement was found for the void fraction distribution in the near wall region, indicating the underestimate of the free-bubble region thickness. This maybe resulted from the limitation of the radial force model. The flow turbulence and volumetric rate ratio between gas and liquid were considered as the main parameter to determine the void fraction in the fully developed pipe flow region. However, smaller bubbles were generated in Case 2, showing a reversed variation trend with the void fraction. This was resulted from the stronger turbulence in the vortex region which enhanced the breakage of bubbles, demonstrating the dominant effect of the turbulence in the vortex region on the bubble size evolution.
5.2 Effect of inlet turbulence intensity
The onset velocity for gas entrainment is observed to reduce with the increasing of inlet turbulence intensity, approaching around 0.5-1.0 m·s−1for rough cavity interface [27-29], therefore the gas entrainment rate and the bubbly flow downstream the cavity is influenced as well. In application of the empirical formula calculating the onset velocity for the vertical circular plunging jet [22], the variation of gas entrainment rate along with the cavity length under different inlet turbulence intensity represented by Itwas obtained as shown in Fig. 9. The liquid volumetric rate was maintained as 1.17×10⁻³m3·s−1. Resulted from a shorter cavity length for the onset of gas entrainment, the initial part of the variation curve was shifted left when the turbulence intensity was enhanced. However, as the increasing of the cavity length, the effect of turbulence intensity gradually diminished,leading to a coincidence of the two curves. As shown in the figure, with a stable cavity length of 400 mm, the gas entrainment rate was raised by 50% when the turbulence intensity was increased from 1% to 3%.
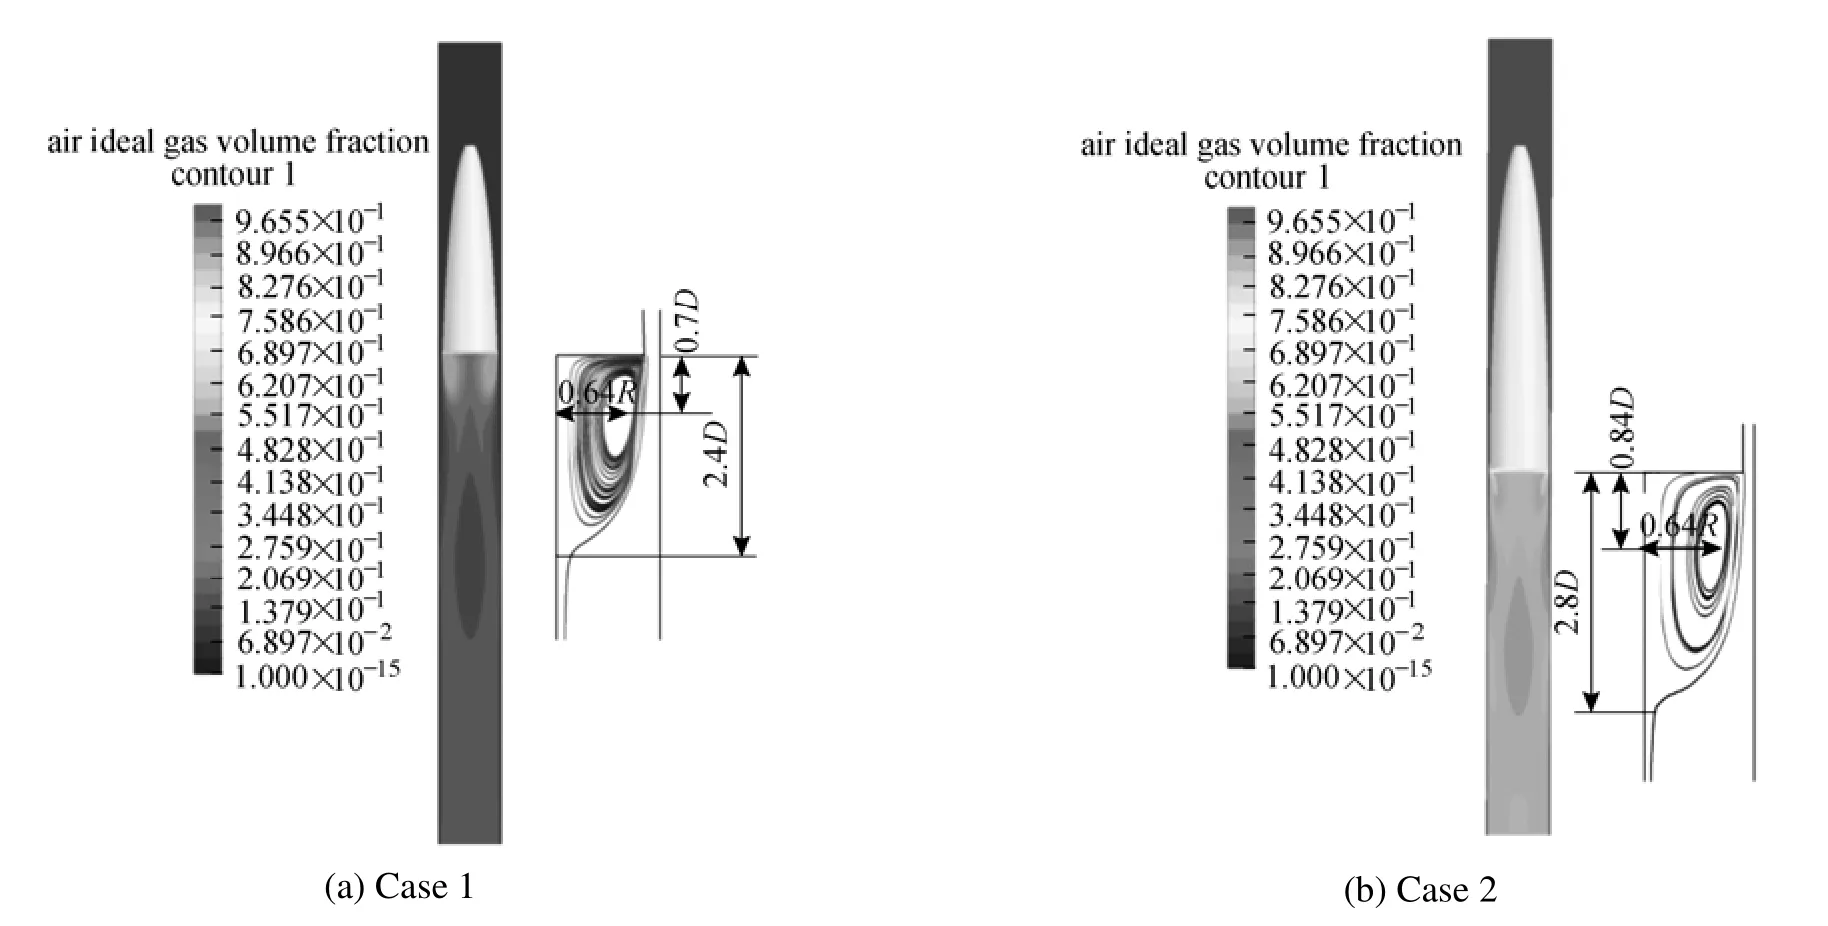
Figure 7 Void fraction distributions and vortex region size under different ventilation rate

Figure 8 Bubbly flow parameters distributions in the fully developed pipe flow region under different ventilation rate
Figure 9 Variation of gas entrainment rate along with the cavity length under different inlet turbulence intensity
Figure 10 presents detail distributions of the bubbly flow parameters for further investigation on the inlet turbulence intensity effect. The average void fraction at different sections was all augmented with higher turbulence intensity. The local maximum void fraction at the exit section of the vortex region was increased by 50% which was in accordance with the raising magnitude of the gas entrainment rate, indicating the aforementioned dominant effect of the volumetric ratio between liquid and gas on the void fraction. Nevertheless, the bubble size was only slightly increased at the exit of the vortex region due to high turbulence. In the pipe flow region, the high void fraction effect gradually dominated, causing the average bubble diameter increased by 6%. When the cavity was expanded beyond 600 mm, the gas entrainment rate and the resulted bubbly flow were unaffected by the inlet turbulence intensity.
5.3 Geometric scale effect analysis
Simulations were conducted with a scaled up model with the geometric scaling ratio rl=2. The simulated liquid flow conditions (Table 2) were chosen based upon the Froude similitude in comparison with the experimental condition of Cases 2 and 3. The ventilation rate required to maintain the same geometric scaling ratio for the cavity length was calculated according to the air entrainment model. For identical fluids in all simulated cases, the Froude similitude implies that the Weber number differs between simulations that surface tension-dominated processes may not be properly scaled. Comparative analysis of dimensionless water velocity, void fraction and bubble size were given in Fig. 11. The distributions of velocity were properly scaled with a Froude similitude for the investigated flow conditions, which was illustrated by the good agreement in terms of dimensionless distributions of water velocity. Caused by faster dispersion of bubbles, a slightly lower void fraction was observed in the larger size model. The entrained bubbles, as well as the bubbles downstream the ventilated cavity were comparatively larger in the smaller size model,implying significant scale effects in terms of turbulence and surface tension effect. In dimensional terms, the size distributions of the smallest bubbles in the pipe flow region were about the same for both models.
6 CONCLUSIONS
Figure 10 Bubbly flow parameters distributions in the fully developed pipe flow region

Table 2 Computational condition for scale effect analysis
Figure 11 Comparison of dimensionless distributions of water velocity, void fraction and bubble size
A numerical scheme for the ventilated cavity was established by coupling the Eulerian-Eulerian two-fluid model with a semi-empirical gas entrainment model. Simulations were carried out to explore the effect of ventilation rate, inlet turbulence intensity and geometric scale effect on the bubbly flow downstream of the ventilated cavity. As the ventilation rate was doubled,the void fraction in the pipe flow region was raised up to the same degree. However, the bubble size was reduced by 20%, indicating that the bubble size evolution process is dominated by the breakage effect induced by turbulence in the vortex region. When the inlet turbulence intensity was enhanced, the gas entrainment rate and the resulted bubbles were only affected at the initial stage of gas entrainment where the intermittence factor remained below 1. In conclusion, the proposed model provides a useful methodology to predict the multiscale multiphase flow field created by ventilated cavity, which will lead a valuable insight in designing and controlling of the two phase systems with ventilated cavity existing.
NOMEMCALATURE
BBbirth rate due to breakage, m−3·s−1
BCbirth rate due to coalescence, m−3·s−1
C1adjustable model constant
Cμk-ε turbulence model constant
Cμbbubble induced turbulent viscosity constant
D diameter, m
DBdeath rate due to breakage, m−3·s−1
DCdeath rate due to coalescence, m−3·s−1
DsSauter mean bubble diameter, m
Fitotal interfacial force, kg·m·s−2
g gravitational acceleration, m·s−2
hWsurface roughness, m
K proportionality constant
k turbulent kinetic energy, m2·s−2
Lccavity length, m
Loncavity length for the onset of gas entrainment, m
nkaverage number density of the kth class, m−3
P pressure, kg·m−1·s−2
Q volumetric rate, m3·s−1
q gas volumetric rate per unit peripheral width of the cavity base, m2·s−1
Rccavity radius, m
Re Reynolds number
r distance from the pipe centerline, m
rlgeometric scaling ratio
rmaxmaximum stable bubble diameter, m
U superficial velocity, m·s−1
Ueonset velocity for gas entrainment, m·s−1
Ujwater jet velocity at the cavity base, m·s−1
u velocity, m·s−1
Weccritical Weber number
z axial distance, m
α void fraction
δ liquid film thickness, m
ε turbulent kinetic energy dissipation rate, m2·s−3
μ molecular viscosity, kg·m−1·s−1
μt,bbubble induced turbulent viscosity, kg·m−1·s−1
μeeffective viscosity, kg·m−1·s−1
ν kinematic viscosity, m2·s−1
ρ density, m3·kg−1
σ surface tension coefficient, kg·s−2
Subscripts
c cavity
g gas
i index of gas/liquid phase
l liquid
t turbulence induced
REFERENCES
1 Bacon, R.P., Scott, D.M., Thorpe, R.B., “Large bubbles attached to spargers in downwards two-phase flow”, Int. J. Multiphase Flow, 21, 949-959 (1995).
2 Riiser, K., Fabre, J., Suzanne, C., “Gas entrainment at the rear of a Taylor bubble”, In: Proceedings of the European Two-phase Flow Group Meeting, Stockholm (1992).
3 Lee, Y.H., Scott, D.M., Thorpe, R.B., “The scale-up of large bubbles attached to spargers in downward two-phase flow”, Chem. Eng. Sci, 52, 3797-3809 (1997).
4 Su, C., “Gas entrainment at the bottom of a Taylor bubble in vertical gas-liquid slug flows”, Ph.D. Thesis, University of Houston, USA (1995).
5 Delfos, R., Wisse, C.J., Oliemans, R.V.A., “Measurement of air-entrainment from a stationary Taylor bubble in a vertical tube”, Int. J. Multiphase Flow, 27, 1769-1787 (2001).
6 Sotiriadis, A.A., Thorpe, R.B., “Liquid re-circulation in turbulent vertical pipe flow behind a cylindrical bluffbody and a ventilated cavity attached to a sparger”, Chem. Eng. Sci., 60, 981-994 (2005).
7 Chanson, H., Toombes, L., “Hydraulics of stepped chutes: the transition flow”, J. Hyd. Res. IAHR, 42, 43-54 (2004).
8 Henderson, F.M., Open Channel Flow, MacMillan Co., New York (1966).
9 Xiang, M., Cheung, S.C.P., Yeoh, G.H., Zhang, W.H., Tu, J.Y., “On the numerical study of bubbly flow created by ventilated cavity in vertical pipe”, Int. J. Multiphase Flow, 37, 756-768 (2011).
10 Chanson, H., Air Bubble Entrainment in Free-Surface Turbulent Shear Flows. Academic Press, London (1996).
11 Chanson, H., Brattberg, T., “Air entrainment by two-dimensional plunging jets: The impingement region and the very-near flow field”, In: Proceedings of the ASME Fluids Engineering Conference, Washington DC (1998).
12 Ma, J., Oberai, A.A., “A quantitative sub-grid air entrainment model for bubbly flows—Plunging jets”, Comput. Fluids, 39, 77-86 (2010).
13 Chanson, H., Manasseh, R., “Air entrainment processes in a circular plunging jet: Void-fraction and acoustic measurements”, J. Fluids Eng., 125, 910-921 (2003).
14 Fernandes, R.C., Semiat, R., “Hydrodynamic model for gas-liquid slug flow in vertical tubes”, AlChE J., 29 (6), 981-989 (1983).
15 Fu, X., “Interfacial area measurement and transport modeling in air-water two-phase flow”, Ph.D. Thesis, Purdue University, USA (2001).
16 Kockx, J.P., Nieuwstadt, F.T.M., “Gas entrainment by a liquid film falling around a stationary Taylor bubble in a vertical tube”, Int. J. Multiphase Flow, 31, 1-24 (2005).
17 Sene, K.J., “Air entrainment by plunging jets”, Chem. Eng. Sci., 43, 2615-2623 (1988).
18 Johnson, M.W., Fashifar, A., “Statistical properties of turbulent bursts in transitional boundary layers”, Int. J. Heat Fluid Flow, 15, 283-290 (1994).
19 Evans, G.M., Machniewski, P.M., Bin, A.K., “Bubble size distribution and void fraction in the wake region below a ventilated gas cavity in downward pipe flow”, Chem. Eng. Res. Des., 82 (9), 1095-1104 (2004).
20 Dumitrescu, D.T., “Stromung an einer Luftblase im Senkrechten Rohr”, Z. angew., Math. Mech., 23, 139-149 (1943).
21 Thorpe, R.B., Evans, G.M., Zhang, K., “Liquid recirculation and bubble breakup beneath ventilated gas cavities in downward pipe flow”, Chem. Eng. Sci., 56, 6399-6409 (2001).
22 Ervine, D., Mckeogh, E., Elsawy, E., “Effect of turbulence intensity on the rate of air entrainment by plunging water jets”, ICE Proc., 69, 425-450 (1980).
23 Shah, A., Chughtai, I.R., Inayat, M.H., “Numerical simulation of direct-contact condensation from a supersonic steam jet in subcooled water”, Chin. J. Chem. Eng., 18 (4), 577-587 (2010).
24 Kumar, S., Ramkrishna, D., “On the solution of population balance equations by discretization—I. A fixed pivot technique”, Chem. Eng. Sci., 51, 1311-1332 (1996).
25 Launder, B., Salding, D., Lectures in Mathematical Models for Turbulence, Academic Press, New York (1972).
26 Sato, Y., Sadatomi, M., Sekoguchi, K., “Momentum and heat transfer in two-phase bubbly flow”, Int. J. Multiphase Flow, 7, 167-178 (1981).
27 Cummings, P.D., “Aeration due to breaking waves”, Ph.D. Thesis, University of Queensland, Australia (1996).
28 Mckeogh, E.J., Ervine, D.A., “Air entrainment rate and diffusion pattern of plunging liquid jets”, Chem. Eng. Sci., 36, 1161-1172 (1981).
29 Wood, I.R., IAHR Hydraulic Structures Design Manual, Balkema Press, Rotterdam, 1-149 (1991).
FLUID DYNAMICS AND TRANSPORT PHENOMENA
Chinese Journal of Chemical Engineering, 22(3) 252—260 (2014)
10.1016/S1004-9541(14)60033-1
2012-10-25, accepted 2013-04-23.
*Supported by the Research Project Foundation of National University of Defense Technology (JC12-01-04) and the National Science Foundation for Post-doctoral Scientists of China (2012M520268).
**To whom correspondence should be addressed. E-mail: xiangmin333@hotmail.com
猜你喜欢
计算机工程与应用(2023年1期)2023-01-13
长春师范大学学报(2022年10期)2022-11-11
兵工学报(2022年2期)2022-05-22
作物学报(2022年4期)2022-02-10
西南农业学报(2021年10期)2021-12-14
兵工学报(2021年4期)2021-06-19
声学与电子工程(2021年1期)2021-04-19
兵工学报(2020年12期)2020-02-06
自然资源遥感(2019年3期)2019-09-12
科学导报(2018年30期)2018-05-14
 Chinese Journal of Chemical Engineering2014年3期
- Chinese Journal of Chemical Engineering的其它文章
- A Bi-component Cu Catalyst for the Direct Synthesis of Methylchlorosilane from Silicon and Methyl Chloride
- Hydrodynamics and Mass Transfer of Oily Micro-emulsions in An External Loop Airlift Reactor
- Effects of Shape and Quantity of Helical Baffle on the Shell-side Heat Transfer and Flow Performance of Heat Exchangers*
- A Contraction-expansion Helical Mixer in the Laminar Regime*
- Preparation and Characterization of Sodium Sulfate/Silica Composite as a Shape-stabilized Phase Change Material by Sol-gel Method*
- Determination of Transport Properties of Dilute Binary Mixtures Containing Carbon Dioxide through Isotropic Pair Potential Energies