
Incorporating S-shaped testing-effort functions into NHPP software reliability model with imperfect debugging
2015-01-17 12:29QiuyingLiHaifengLiandMinyanLu
Qiuying Li,Haifeng Li,and Minyan Lu
1.School of Reliability and Systems Engineering,Beihang University,Beijing 100191,China;
2.Science&Technology on Reliability&Environmental Engineering Laboratory,Beijing 100191,China;
3.Quality Technique Center,China Aero-polytechnology Establishment,Beijing 100028,China
Incorporating S-shaped testing-effort functions into NHPP software reliability model with imperfect debugging
Qiuying Li1,2,*,Haifeng Li3,and Minyan Lu1,2
1.School of Reliability and Systems Engineering,Beihang University,Beijing 100191,China;
2.Science&Technology on Reliability&Environmental Engineering Laboratory,Beijing 100191,China;
3.Quality Technique Center,China Aero-polytechnology Establishment,Beijing 100028,China
Testing-effort(TE)and imperfect debugging(ID)in the reliability modeling process may further improve the ftting and prediction results of software reliability growth models(SRGMs).For describing the S-shaped varying trend of TE increasing rate more accurately,frst,two S-shaped testing-effort functions(TEFs),i.e., delayed S-shaped TEF(DS-TEF)and infected S-shaped TEF (IS-TEF),are proposed.Then these two TEFs are incorporated into various types(exponential-type,delayed S-shaped and infected S-shaped)of non-homogeneous Poisson process(NHPP) SRGMs with two forms of ID respectively for obtaining a series of new NHPP SRGMs which consider S-shaped TEFs as well as ID.Finally these new SRGMs and several comparison NHPP SRGMs are applied into four real failure data-sets respectively for investigating the ftting and prediction power of these new SRGMs. The experimental results show that:(i)the proposed IS-TEF is more suitable and fexible for describing the consumption of TE than the previous TEFs;(ii)incorporating TEFs into the infected S-shaped NHPP SRGM may be more effective and appropriate compared with the exponential-type and the delayed S-shaped NHPP SRGMs;(iii)the infected S-shaped NHPP SRGM considering both IS-TEF and ID yields the most accurate ftting and prediction results than the other comparison NHPP SRGMs.
testing-effort(TE),imperfect debugging(ID),software reliability growth models(SRGMs),S-shaped,non-homogeneous Poisson process(NHPP).
1.Introduction
Nowadays,software has been widely used and plays a key role in many safety-critical systems.However,the failures of safety-critical software may result in catastrophic loss of life and property.Thus,software reliability which can be defned as the probability of failure-free software operation for a special period of time in a special usage environment[1],has become one of the most important customer-oriented characters of software quality.And as a result,it is important and signifcant to have effective approaches for developing reliable software as well as accurate approaches for quantitatively estimating and predicting software reliability[2].
As the main means for software reliability estimation and prediction,many time-dependent software reliability growth models(SRGMs)have been proposed and successfully applied into the development process of various types of safety-critical software[3].SRGMs use the failure data collected in the testing process to estimate and predict the failure occurrences in the operational phase as well as to provide decision-making information to project managers for effectively improving the reliability level and the development process of software products.Several previous studies suggested that the estimation or prediction accuracy of traditional SRGMs can be further improved by considering the infuence of some testing process factors(such as testing coverage)on reliability into the modeling process[4–6].Testing-effort(TE)and imperfect debugging (ID)are believed to be two important ones of such testing factors.
TE indicates the consumed resources during the testing phase and can be measured as human power,the number of test cases,the number of CPU hours,etc[7–8].Actually, because the fnal level of software reliability is highly related to the amount of TE performed on fault detection and correction[9],TE is a more suitable and direct exposure indicator for software reliability modeling than calendar time and should be considered as a crucial factor[8,10].Thus it is obviously unreasonable that some SRGMs assume the consumption rate of TE during the testing phase is constant or does not explicitly consider TE or its effectiveness[4]. To solve this problem,the researchers frst proposed various time-dependent functions,i.e.,testing-effort functions(TEFs),to describe the cumulated consumption amount of TE during the software testing phase,such as exponential, Rayleigh,Weibull[11],exponentiated Weibull[12],generalized exponential[13],Burr-type X[14],logistic[4,8], generalized logistic[15–16],log-logistic[17],and Chatterjee[18].Then many TEF-based SRGMs and related discussions[2,4,7–9,11–25]are proposed by incorporating these above TEFs into the non-homogeneous Poisson process(NHPP)SRGMs to illustrate the relationship among the calendar time,the amount of TE and the number of detected faults.
Due to the integrated effects of software structure and learning factor on testing,at the beginning of the software testing phase,the amount of TE increases very fast,after a certain point in time,the TE increasing rate becomes lower and lower.In other words,the growth curve of the amount of TE may exhibit an S-shaped varying trend which is diffcult or not suitable to describe by the exponential,Rayleigh or Weibull curves.Huang suggested the logistic TEF[8] is fairly fexible for describing this S-shaped curve.However,it is sometimes not enough to describe this S-shaped TE expenditure only by logistic TEF,since the actual data may show diverse expenditure patterns.
The delayed S-shaped function and the infected S-shaped function are two representative S-shaped functions which are fexible and applicable in many cases and have been applied into modeling software reliability[26–27]. Thus in this paper,frst we will present two S-shaped TEFs,i.e.,delayed S-shaped TEF(DS-TEF)and infected S-shaped TEF(IS-TEF),as the alternatives of logistic TEF. Then we will show how to incorporate these S-shaped TEFs into the exponential,delayed S-shaped and infected S-shaped NHPP SRGMs respectively.Moreover,we will further investigate these proposed SRGMs under two ID assumptions.Finally,four cases for comparison which are performed for several real failure data sets are presented.
The rest of this paper is organized as follows.In Section 2,we frst review several existing TEFs and then present two S-shaped TEFs.In Section 3,we integrate these S-shaped TEFs into the exponential,delayed S-shaped and infected S-shaped NHPP SRGMs respectively. In Section 4,we give a further discuss with two ID assumptions.In Section 5 we provide the case studies on several real failure data sets.Section 6 concludes this paper.
2.Software TEFs
The consumption amount of TE can be measured by the testing time or software characters(such as the size),etc.In this section,we will review some previous time-dependent TEFs,and then present two S-shaped TEFs(i.e.,DS-TEF and IS-TEF).
2.1Brief review of previous TEFs
Yamada[11]frst proposed the Weibull-type TEFs with the following three cases:
(i)Exponential TEF
where W(t)is the cumulative TE consumed in(0,t), Wmaxis the total TE eventually consumed in the testing phase(i.e.,Wmax=W(∞)),and b is a scale parameter. (ii)Rayleigh TEF

(iii)Weibull TEF
where m is a shape parameter.It is obvious that exponential TEF and Rayleigh TEF are two special cases of Weibull TEF when m equals 1 and m equals 2.Although the Weibull TEF is fexible for ftting various testing datasets,Huang indicated that it displays an obvious peak phenomenon(nonsmoothly increasing and degrading consumption curve)when the shape parameter m is greater than 3[8].
(iv)Generalized exponential TEF(GExp)[13]

Exponential TEF is its special case when θ equals 1.
(v)Burr type X TEF(Burr)[14]
Rayleigh TEF is its special case when θ equals 1.
(vi)Exponentiated Weibull TEF(Exp Weibull)[12]

It should be noted that the previous fve TEFs are its special cases for various m and θ.Ahmad suggested that the exponentiated Weibull TEF is a more fexible and general TEF and has no peak phenomenon[12].However,it is not very suitable for describing the S-shaped growth trend.
(vii)Logistic TEF[8]
where α is the TE consumption rate,and A is a constant parameter.Huang suggested that the logistic TEF appeared to be fairly accurate in describing the expended TE[4]. He further gave two generalized logistic TEFs which are shown as follows[15,16]:
(viii)The frst generalized logistic TEF(GLogistic 1) [15]
where k is the structure parameter.For k=1,(8)becomes (7).
(ix)The second generalized logistic TEF(GLogistic 2) [16]
when β=k+1,(9)becomes(8).
It should be noted that in the initial point,W(0)calculated by these logistic TEFs is not equal to zero.
(x)Chatterjee TEF[18]
Chatterjee proposed a TEF which considers TE and learning factor together and the can be written as the following equation:
(xi)Log-logistic TEF[17]
2.2Two S-shaped TE functions
In this section,two S-shaped TEFs are presented as the alternatives of the logistic TEF for describing various expenditure patterns of the actual TE data.
(i)Delayed S-shaped TEF(DS-TEF)
If we use the delayed S-shaped function to describe TEF,the cumulative TE expenditure consumed in(0,t)can be depicted as follows:

where b is the TE consumption rate,b>0.
According to(12),we can have:
i)W(t)is a non-negative and non-decreasing function of time t which is consistent with the continuous growth trend of TE with time;
ii)The TE consumption rate at time t is
where w(t)is a function which frst increases and then decreases with t and reaches its maximum value at
(ii)Infected S-shaped TEF(IS-TEF)
where b is the TE consumption rate and ψ is a constant parameter.
According to(15),we can have:
i)W(t)is also a non-negative and non-decreasing function of time t;
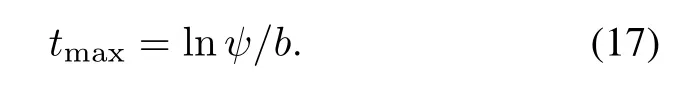
ii)The TE consumption rate at time t is
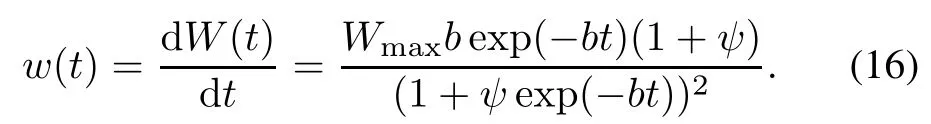
where w(t)is a function which frst increases and then decreases with t and reaches its maximum value at
3.NHPP software reliability modeling with two S-shaped TEFs
The general assumptions of the NHPP SRGM with S-shaped TEFs are shown as follows[4,7,8,12]:
(i)The occurrence and removal process of software faults follows the NHPP;
(ii)The software failures occur at random time caused by the remaining faults in the system;
2010~2015年,山东省基层卫生机构卫生人员数呈现先增加后降低的趋势,整体增幅11.75%,其中,社区卫生服务中心人员增幅最大,为62.35%,其次是社区卫生服务站,为22.11%,乡镇卫生院增幅为9.15%,而村卫生室人员到2015年呈现降低趋势,整体降幅5.63%。(详见表2)
(iii)The mean number of faults detected in the time interval(t,t+Δt)to the current TE expenditures is proportional to the mean number of remaining faults in the system;
(iv)The proportionality is a constant r or a timedependent fault detection rate function r(t);
(v)The consumption amount of TE is described by DSTEF or IS-TEF;
(vi)When a fault is detected,it is immediately removed and will not introduce a new fault.In other words,the number of the total faults in the software system is a constant N.
According to the above assumptions,the modeling framework of the NHPP SRGM with S-shaped TEFs can be shown as follows:
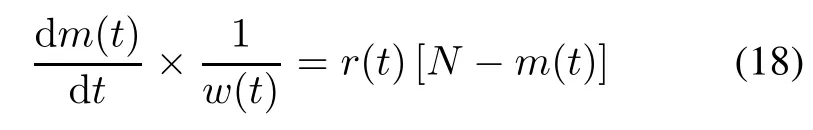
where m(t)is the mean value function of the expected number of faults detected in time interval(0,t).Based on the above modeling framework,three types of NHPP SRGMs with S-shaped TEFs can be formulated respectively as follows.
3.1Exponential NHPP SRGMs with S-shaped TEFsThe assumptions of the exponential NHPP SRGM with S-shaped TEFs are the same with the above six generalassumptions.And the corresponding fault detection rate function r(t)of the exponential NHPP SRGM is r(t)=r (0<r<1)[8,28].Then(18)can be rewritten as
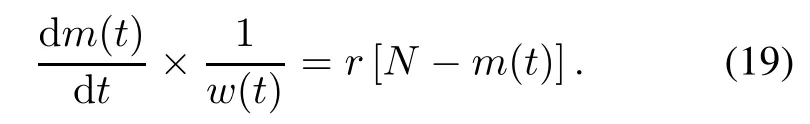
Solving(19)under the boundary condition m(0)=0 and W(0)=0,the exponential NHPP SRGM[8]with TEFs is shown as
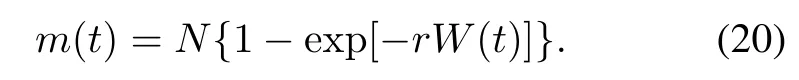
From(20),we also have
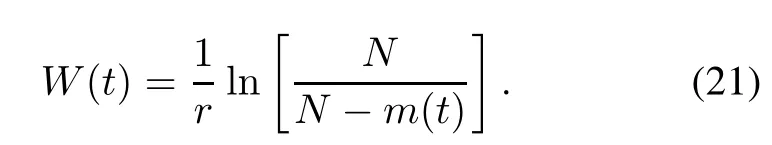
Integrating the above two S-shaped TEFs into(20)respectively,we can have:
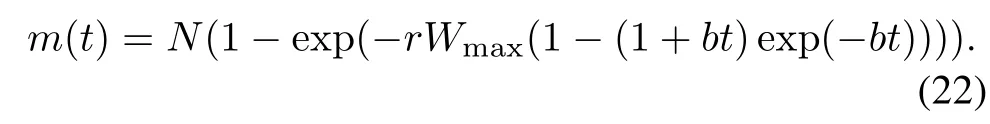
(i)Exponential NHPP SRGM with DS-TEF
Taking the DS-TEF(shown in(12))into(20),the exponential NHPP SRGM with DS-TEF(i.e.,DS-TEFM)is given as
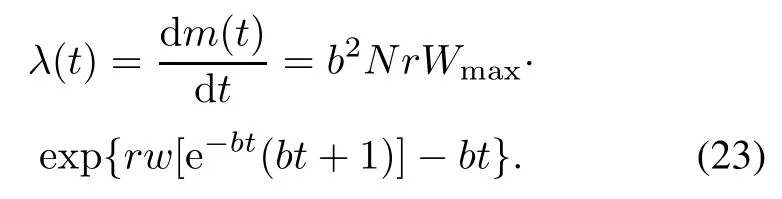
From(22),the failure intensity function λ(t)at testing time t is depicted as
The fnal expected value of the remaining faults can be obtained by(22)and shown as

Equation(24)implies that even if the software system is tested during an infnitely long duration,all faults remaining in the system cannot be fully detected because the total TE eventually consumed is limited to a fnite value,i.e., Wmax.
(ii)Exponential NHPP SRGM with IS-TEF
Taking the IS-TEF(shown in(15))into(20),the exponential NHPP SRGM with IS-TEF(i.e.,IS-TEFM)is given as
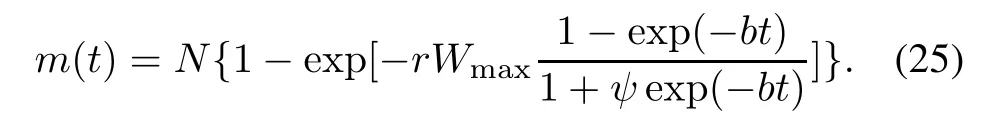
From(25),the failure intensity function λ(t)at testing time t is depicted as
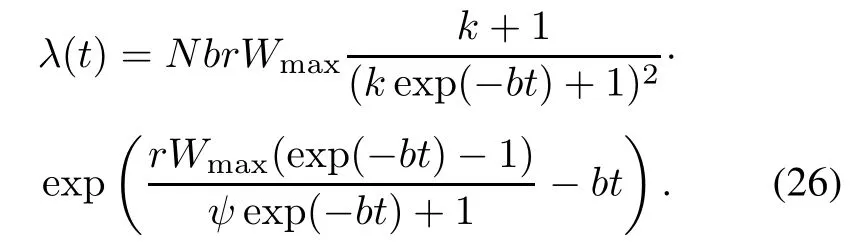
The fnal expected value of the remaining faults can be obtained by(26)and shown as
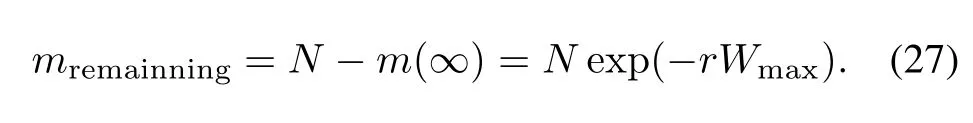
It should be noted that(27)has the same form with(24), thus the same conclusion that the original faults cannot be fully detected also can be obtained.
3.2S-shaped NHPP SRGMs with S-shaped TEFs
Although most existing NHPP SRGMs belong to the exponential-type,the delayed S-shaped NHPP SRGM[26] and the infected S-shaped NHPP SRGM[27]are proposed to describe the S-shaped growth curve of the cumulative number of detected faults for obtaining a better description of the software fault removal and detection process.The delayed S-shaped NHPP SRGM is designed to describe the processes of fault detection and fault isolation.And the infected S-shaped NHPP SRGM is designed to describe two types of faults:mutually independent and dependent. Huang incorporated the logistic TEF into the delayed S-shaped NHPP SRGM[4].Ahmad incorporated the exponentiated Weibull TEF into the infected S-shaped NHPP SRGM[9].Thus,in this section,we will show how to respectively integrate these two S-shaped TEFs into the delayed S-shaped and the infected S-shaped NHPP SRGMs.
(i)Delayed S-shaped NHPP SRGM with the S-shaped TEFs
The assumptions of the delayed S-shaped NHPP SRGM with S-shaped TEFs are nearly the same as the six general assumptions.However,we suggest the corresponding fault detection rate function r(t)is related to the consumption amount of TE W(t).Thus,according to the delayed S-shaped SRGM[26,28],we have
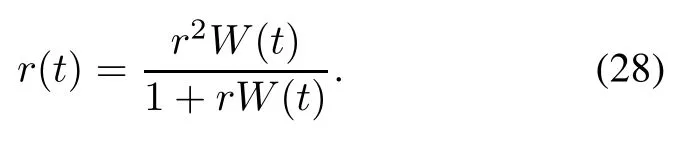
Taking(28)into(18),(18)can be rewritten as
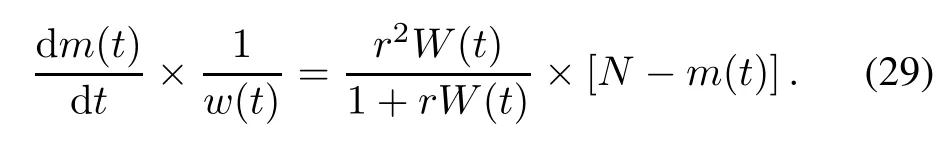
Solving(29)under the boundary condition m(0)=0 and W(0)=0,the delayed S-shaped NHPP SRGM with TEF(i.e.,TEFM-DS)is shown as

Substituting DS-TEF(12)or IS-TEF(15)into(30),the delayed S-shaped NHPP SRGM with DS-TEF(i.e.,DSTEFM-DS)orIS-TEF(i.e.,IS-TEFM-DS)can be obtained respectively.
(ii)Infected S-shaped NHPP SRGM with the S-shaped TEFs
The assumptions of the infected S-shaped NHPP SRGM with S-shaped TEFs are also nearly the same as the six general assumptions.We suggest the corresponding fault detection rate function r(t)is related to the consumption amount of TE W(t).Thus,according to the infected S-shaped SRGM[27,28],we can have
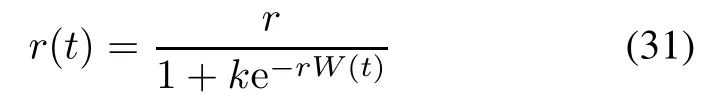
where k is the infection factor,k=1/γ−1.The parameter γ is the infection rate that indicates the proportion of the number of independent faults to the total number of faults in software[28].
Taking(31)into(18),(18)can be rewritten as

Solving(32)under the boundary condition m(0)=0 and W(0)=0,then the infected S-shaped NHPP SRGM with TEF(i.e.,TEFM-IS)is shown as

Substituting DS-TEF(12)or IS-TEF(15)into(33),the infected S-shaped NHPP SRGM with DS-TEF(i.e.,DSTEFM-IS)or IS-TEF(i.e.,IS-TEFM-IS)can be obtained respectively.
4.NHPP software reliability modeling with S-shaped TEF and ID
Most traditional NHPP SRGMs,such as the Goel-Okumoto model[3],assume that once a failure occurs,the fault causing this failure is immediately removed and no new fault is introduced,namely,the perfect debugging phenomenon.However,dueto the complexity of software systems and debugging activities,in reality,the fault removal process may not be perfect and may generate another new fault,i.e.,ID.Thus ID problems should be considered in the reliability modeling process for interpreting the debugging process more accurately and actually.Since Goel frst incorporated ID into reliability modeling[29],many studies have been proposed for solving ID issues[4,9,22,30–36].For example,Pham proposed a framework for incorporating the testing coverage and ID into NHPP SRGM [31].Kapur discussed how to integrate TEF and ID into the exponential NHPP SRGM[22].In addition,Huang and Ahmad[4,9]discussed how to integrate TEF and ID into the delayed S-shaped and infected S-shaped NHPP SRGMs respectively.Thus here we will respectively incorporate the S-shaped TEFs and ID into the exponential, delayed S-shaped and infected S-shaped NHPP SRGMs to providean intuitive and actual description of the ID process.
The general assumptions of the NHPP SRGM with S-shaped TEFs and ID are shown as follows[4,9,22,31]:
(i)The occurrence and removal process of software faults follows the NHPP;
(ii)The software failures occur at random times caused by the remaining faults in the system;
(iii)The mean number of faults detected in the time interval(t,t+Δt)to the current TE expenditures is proportional to the mean number of remaining faults in the system;
(iv)The proportionality is a constant r or a timedependent fault detection rate function r(t);
(v)The consumption amount of TE is described by the DS-TEF or the IS-TEF;
(vi)When a fault is detected,it is immediately removed. However when removing or fxing a detected fault,a new fault may be generated with a certain probability β.In other words,the number of the total faults in the software system is not a constant and may be a function of t,i.e., N(t),which can be generally regarded as the sum of the initial total faults N and the introduced faults[4].
According to the above assumptions,the modeling framework of the NHPP SRGM with S-shaped TEFs and ID is shown as follows:
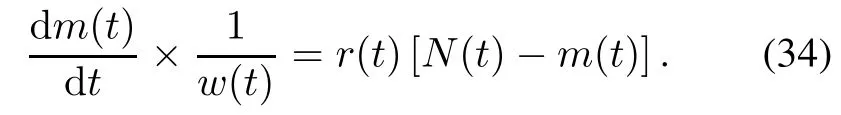
Many expression forms of N(t)have been proposed for describing the ID process[4,31,32,37].The following two expression forms of N(t)are commonly used in the research and practice related to reliability modeling.
Form 1The introduced faults are proportional to the current time t or TE W(t)[30–32],that is
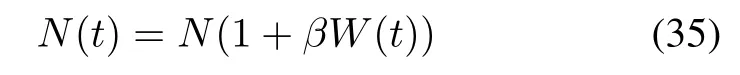
where β is the fault introduction rate.
Form 2The introduced faults are proportional to the current detected faults m(t)[4,9,37],that is,
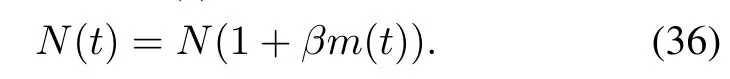
At present,only Form 2 has been discussed and incorporated into the NHPP SRGM with TEFs[4,9].However, we think Form 1 is also reasonable and should be considered in the modeling process.Thus,we will incorporate these two forms of ID into the exponential-type,delayed S-shaped and infected S-shaped NHPP SRGMs with S-shaped TEFs respectively for obtaining the NHPP SRGMs with TEFs and ID(i.e.,TEFM-ID).
4.1Exponential NHPP SRGM with S-shaped TEF and ID
The assumptions of the exponential NHPP SRGM with the S-shaped TEF and ID are the same as the above six general assumptions.And the corresponding fault detection ratefunction r(t)of the exponential NHPP SRGM is r(t)=r (0<r<1).
(i)Exponential NHPP SRGM with TEF and Form 1 of ID(TEFM-ID1)
Taking(35)into(34),(34)is rewritten as
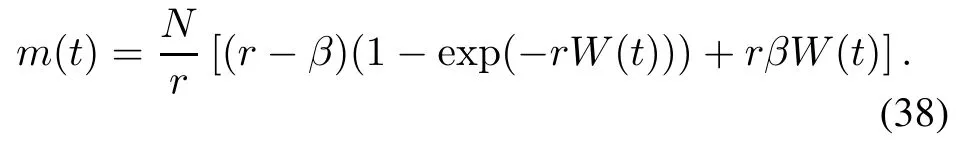
Solving(37)under the boundary condition m(0)=0 and W(0)=0,the exponential NHPP SRGM with S-shaped TEF and Form 1 of ID is shown as
(ii)Exponential NHPP SRGM with TEF and Form 2 of ID(TEFM-ID2)
Taking(36)into(34),(34)is rewritten as follows:
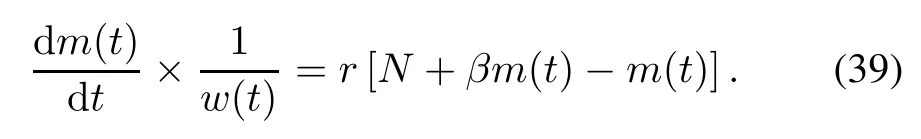
Solving(39)under the boundary condition m(0)=0 and W(0)=0,the exponential NHPP SRGM with S-shaped TEF and Form 2 of ID is shown as
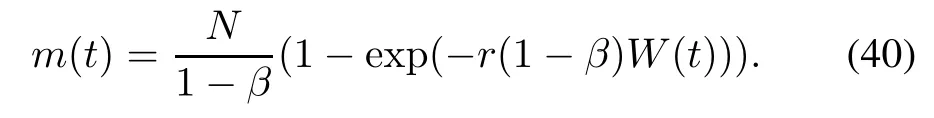
Substituting DS-TEF(12)and IS-TEF(15)into(38)and (40),the exponential NHPP SRGMs with S-shaped TEFs and two forms of ID can be obtained respectively.
4.2Delayed S-shaped NHPP SRGM with S-shaped TEF and ID
The fault detection rate function r(t)of the delayed S-shaped NHPP SRGM is shown in(28).
(i)Delayed S-shaped NHPP SRGM with TEF and Form 1 of ID
Taking(28)and(35)into(34),(34)is rewritten as
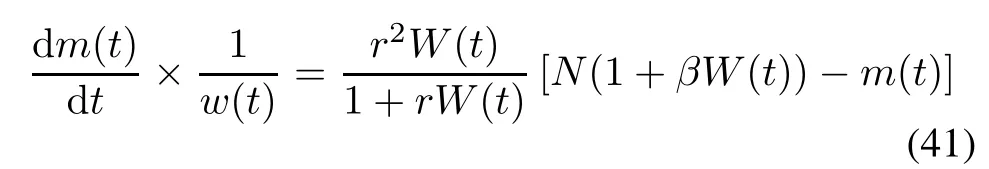
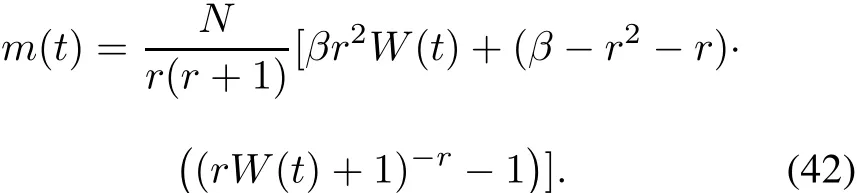
Solving(41)under the boundary condition m(0)=0 and W(0)=0,the delayed S-shaped NHPP SRGM with TEF and Form 1 of ID is shown as
(ii)Delayed S-shaped NHPP SRGM with TEF and Form 2 of ID
Taking(28)and(36)into(34),(34)is rewritten as
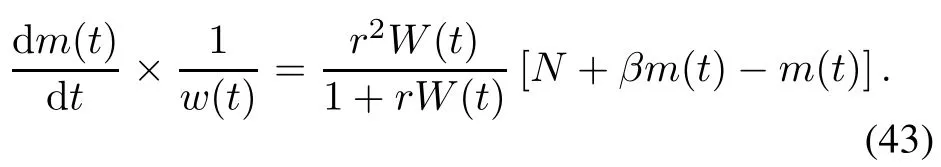
Solving(43)under the boundary condition m(0)=0 and W(0)=0,the delayed S-shaped NHPP SRGM with TEF and Form 2 of ID is shown as
Substituting DS-TEF(12)into(42)and(44)respectively,the delayed S-shaped NHPP SRGMs with delayed S-shaped TEF and ID can be obtained(i.e.,DS-TEFMDS-ID1 and DS-TEFM-DS-ID2).Similarly,substituting IS-TEF(15)into(42)and(44)respectively,the delayed S-shaped NHPP SRGMs with infected S-shaped TEF and ID can be obtained(i.e.,IS-TEFM-DS-ID1 and IS-TEFMDS-ID2).
4.3Infected S-shaped NHPP SRGM with S-shaped TEF and ID
The fault detection rate function r(t)of the infected S-shaped NHPP SRGM is shown in(31).
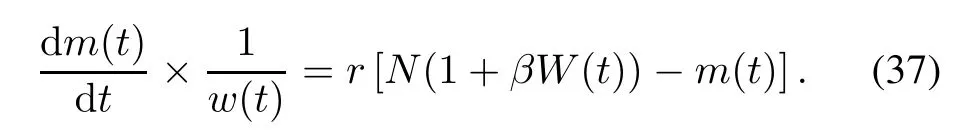
(i)Infected S-shaped NHPP SRGM with TEF and Form 1 of ID
Taking(31)and(35)into(34),(34)can be rewritten as
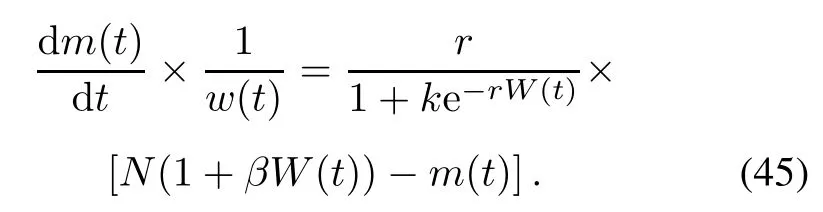
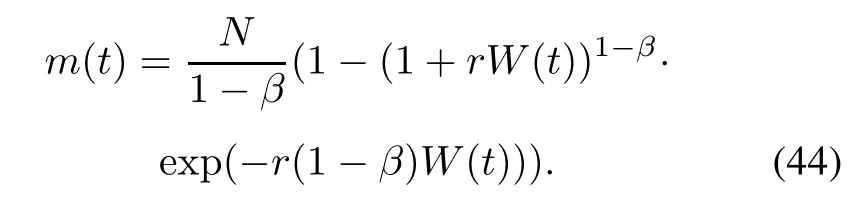
Solving(45)under the boundary condition m(0)=0 and W(0)=0,the infected S-shaped NHPP SRGM with TEF and Form 1 of ID is shown as
(ii)Infected S-shaped NHPP SRGM with TEF and Form 2 of ID
Taking(31)and(36)into(34),(34)can be rewritten as
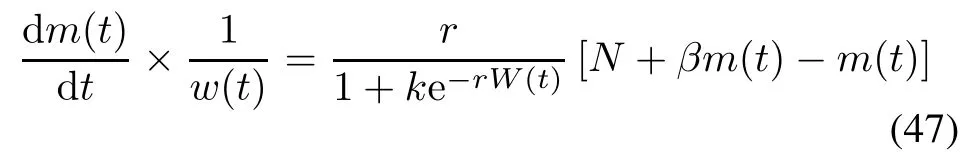
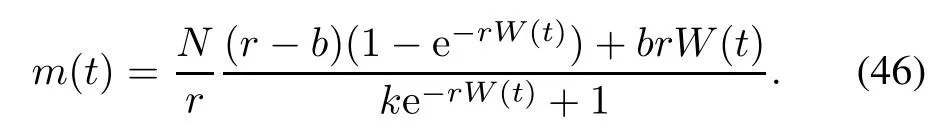
Solving(47)under the boundary condition m(0)=0 and W(0)=0,the infected S-shaped NHPP SRGM with S-shaped TEF and Form 2 of ID is shown as
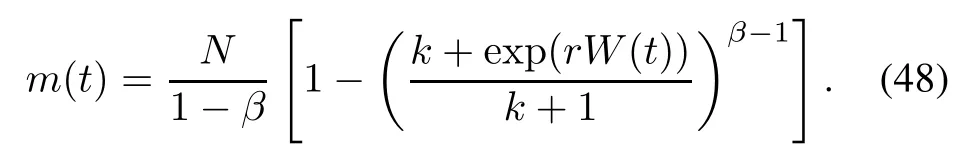
Substituting DS-TEF(12)into(46)and(48)respectively,the infected S-shaped NHPP SRGMs with delayedS-shaped TEF and ID can be obtained(i.e.,DS-TEFMIS-ID1 and DS-TEFM-IS-ID2).Similarly,substituting ISTEF(15)into(46)and(48)respectively,the infected S-shaped NHPP SRGMs with infected S-shaped TEF and ID are obtained(i.e.,IS-TEFM-IS-ID1 and IS-TEFM-ISID2).
To sum up,based on the two proposed S-shaped TEFs, we propose a series of new NHPP SRGMs by incorporating the two S-shaped TEFs into the exponential and S-shaped NHPP SRGMs with or without two forms of ID respectively in Sections 3 and 4.Table 1 summarizes these new NHPP SRGMs.
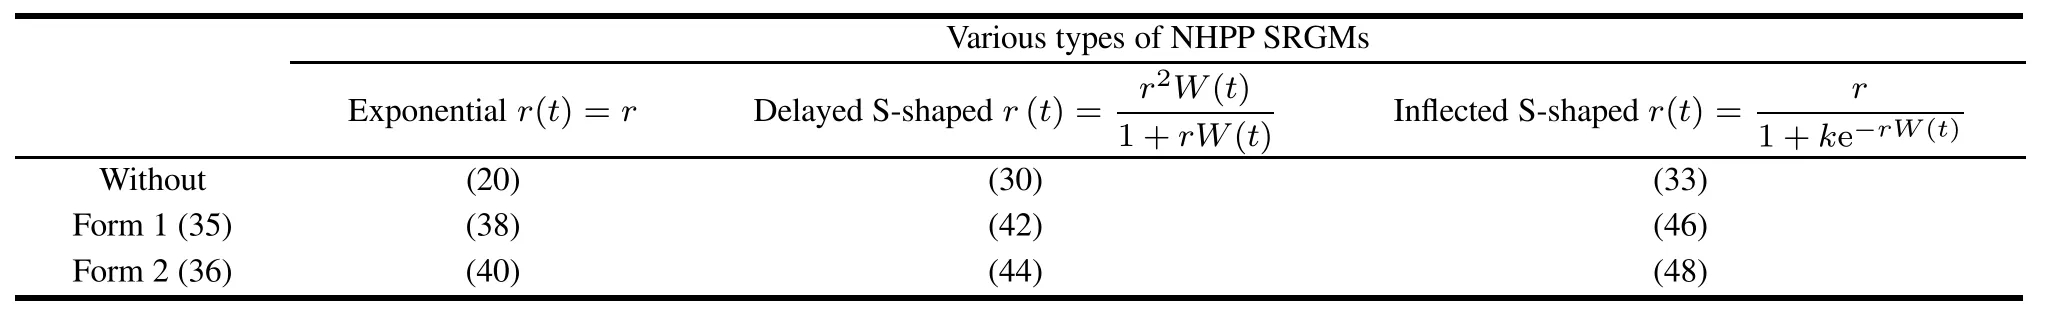
Table 1 Incorporating S-shaped TEFs into various types of NHPP SRGMs with or without ID
5.Case studies
In this section,we propose four case(Sections5.1–5.4)on four real failure data-sets for investigating the effectiveness and applicability of the proposed S-shaped TEFs and a series of the proposed NHPP SRGMs with S-shaped TEFs and two forms of ID respectively in terms of ftting and prediction results.
(i)Four real failure data-sets for comparison
Four real failure data-sets concluding TE data are selected which are popular and frequently used as the benchmark for comparison in the reliability modeling feld.The frst data-set(DS1)was collected by Ohba[38].During 19 weeks,328 faults were detected with 47.65 CPU hours consumed.The second data-set(DS2)was collected by Wood[39].During 20 weeks,100 faults were detected with 10 000 CPU hours consumed.The third data-set (DS3)was from the study of Tohma[40].During 22 days, 86 faults were detected with 93 CPU hour consumed.The fourth data-set(DS4)was also from the study of Tohma [40].During 111 days,481 faults were detected with 442 man-days.Due to the limited space,these four data-sets are not shown in this paper and can be seen in corresponding literature.
(ii)Comparison TEFs or comparison NHPP SRGMs in case studies
We select 10 existing TEFs as the comparison TEFs in Section 5.1,which are shown in(1)–(9)and(11).We also select 19 different NHPP SRGMs as the comparison SRGMs.These SRGMs(shown in Table 2)can be classifed into diverse types,i.e.,the classical NHPP SRGMs (noted by A in Table 2)which have been widely cited by many researchers in the feld of NHPP software reliability modeling,the NHPP SRGMs with TEFs(noted by B)and the NHPP SRGMs with ID(noted by C).
(iii)Comparison criteria of SRGMs
Generally,the SRGMs can be compared in terms of their ability to ft the observed failure data and to predict the future behaviors according to the observed failure data.Because the four failure data-sets are recorded in terms of failure number and TE,and the least square estimation(LSE) is used for parameters estimation due to its advantage of producing unbiased results[41],then the following comparison criteria are recommended and shown as follows: i)Goodness-of-ft criteria
Two criteria are selected for comparing the descriptive power of SRGMs,i.e.,the mean squared error(MSE, shown in(49))and the correlation index of the regression curve equation(R-square,shown in(50)).
The MSE[4]is defned as
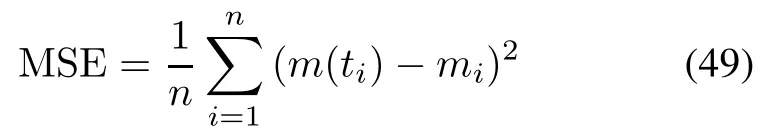
and the R-square[42]is defned as
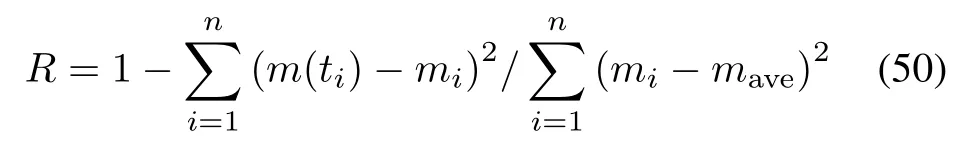
where miis the observed number of faults at ti,m(ti)is the estimated value of the number of faults at ti,maveis the average value of mi.The less the value of MSE is,the better the SRGM fts.The value of R-square is limited in [0,1].The larger the value of R-square(i.e.,closer to 1)is, the better the SRGM fts.
ii)Predictive validity criteria
The capability of the SRGM to predict the future failure behavior from the observed failure data-set is called predictive validity.We select the relative error(RE)[43]as the predictive validity criterion which is shown as
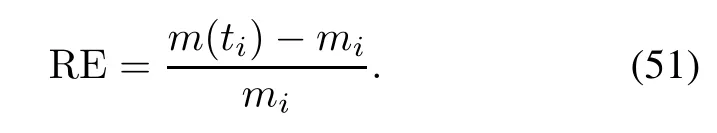
Assuming mnfailures are observed by the end of test time tn,the failure data up to time te(te≤tn)is used for estimating the parameters of me(t).
Substituting the estimated parameters into me(t)yields the prediction value me(tn)by tn.Then the prediction value me(tn)is compared with the actual number mn.The procedure is repeated with various values of tefor getting various values of RE.If the RE value is positive,it indicates overestimation.If the RE value is negative,it indicates underestimation.Finally,we can check the prediction power by plotting various RE values for different values of te.Numbers closer to zero imply more accurate prediction [44].
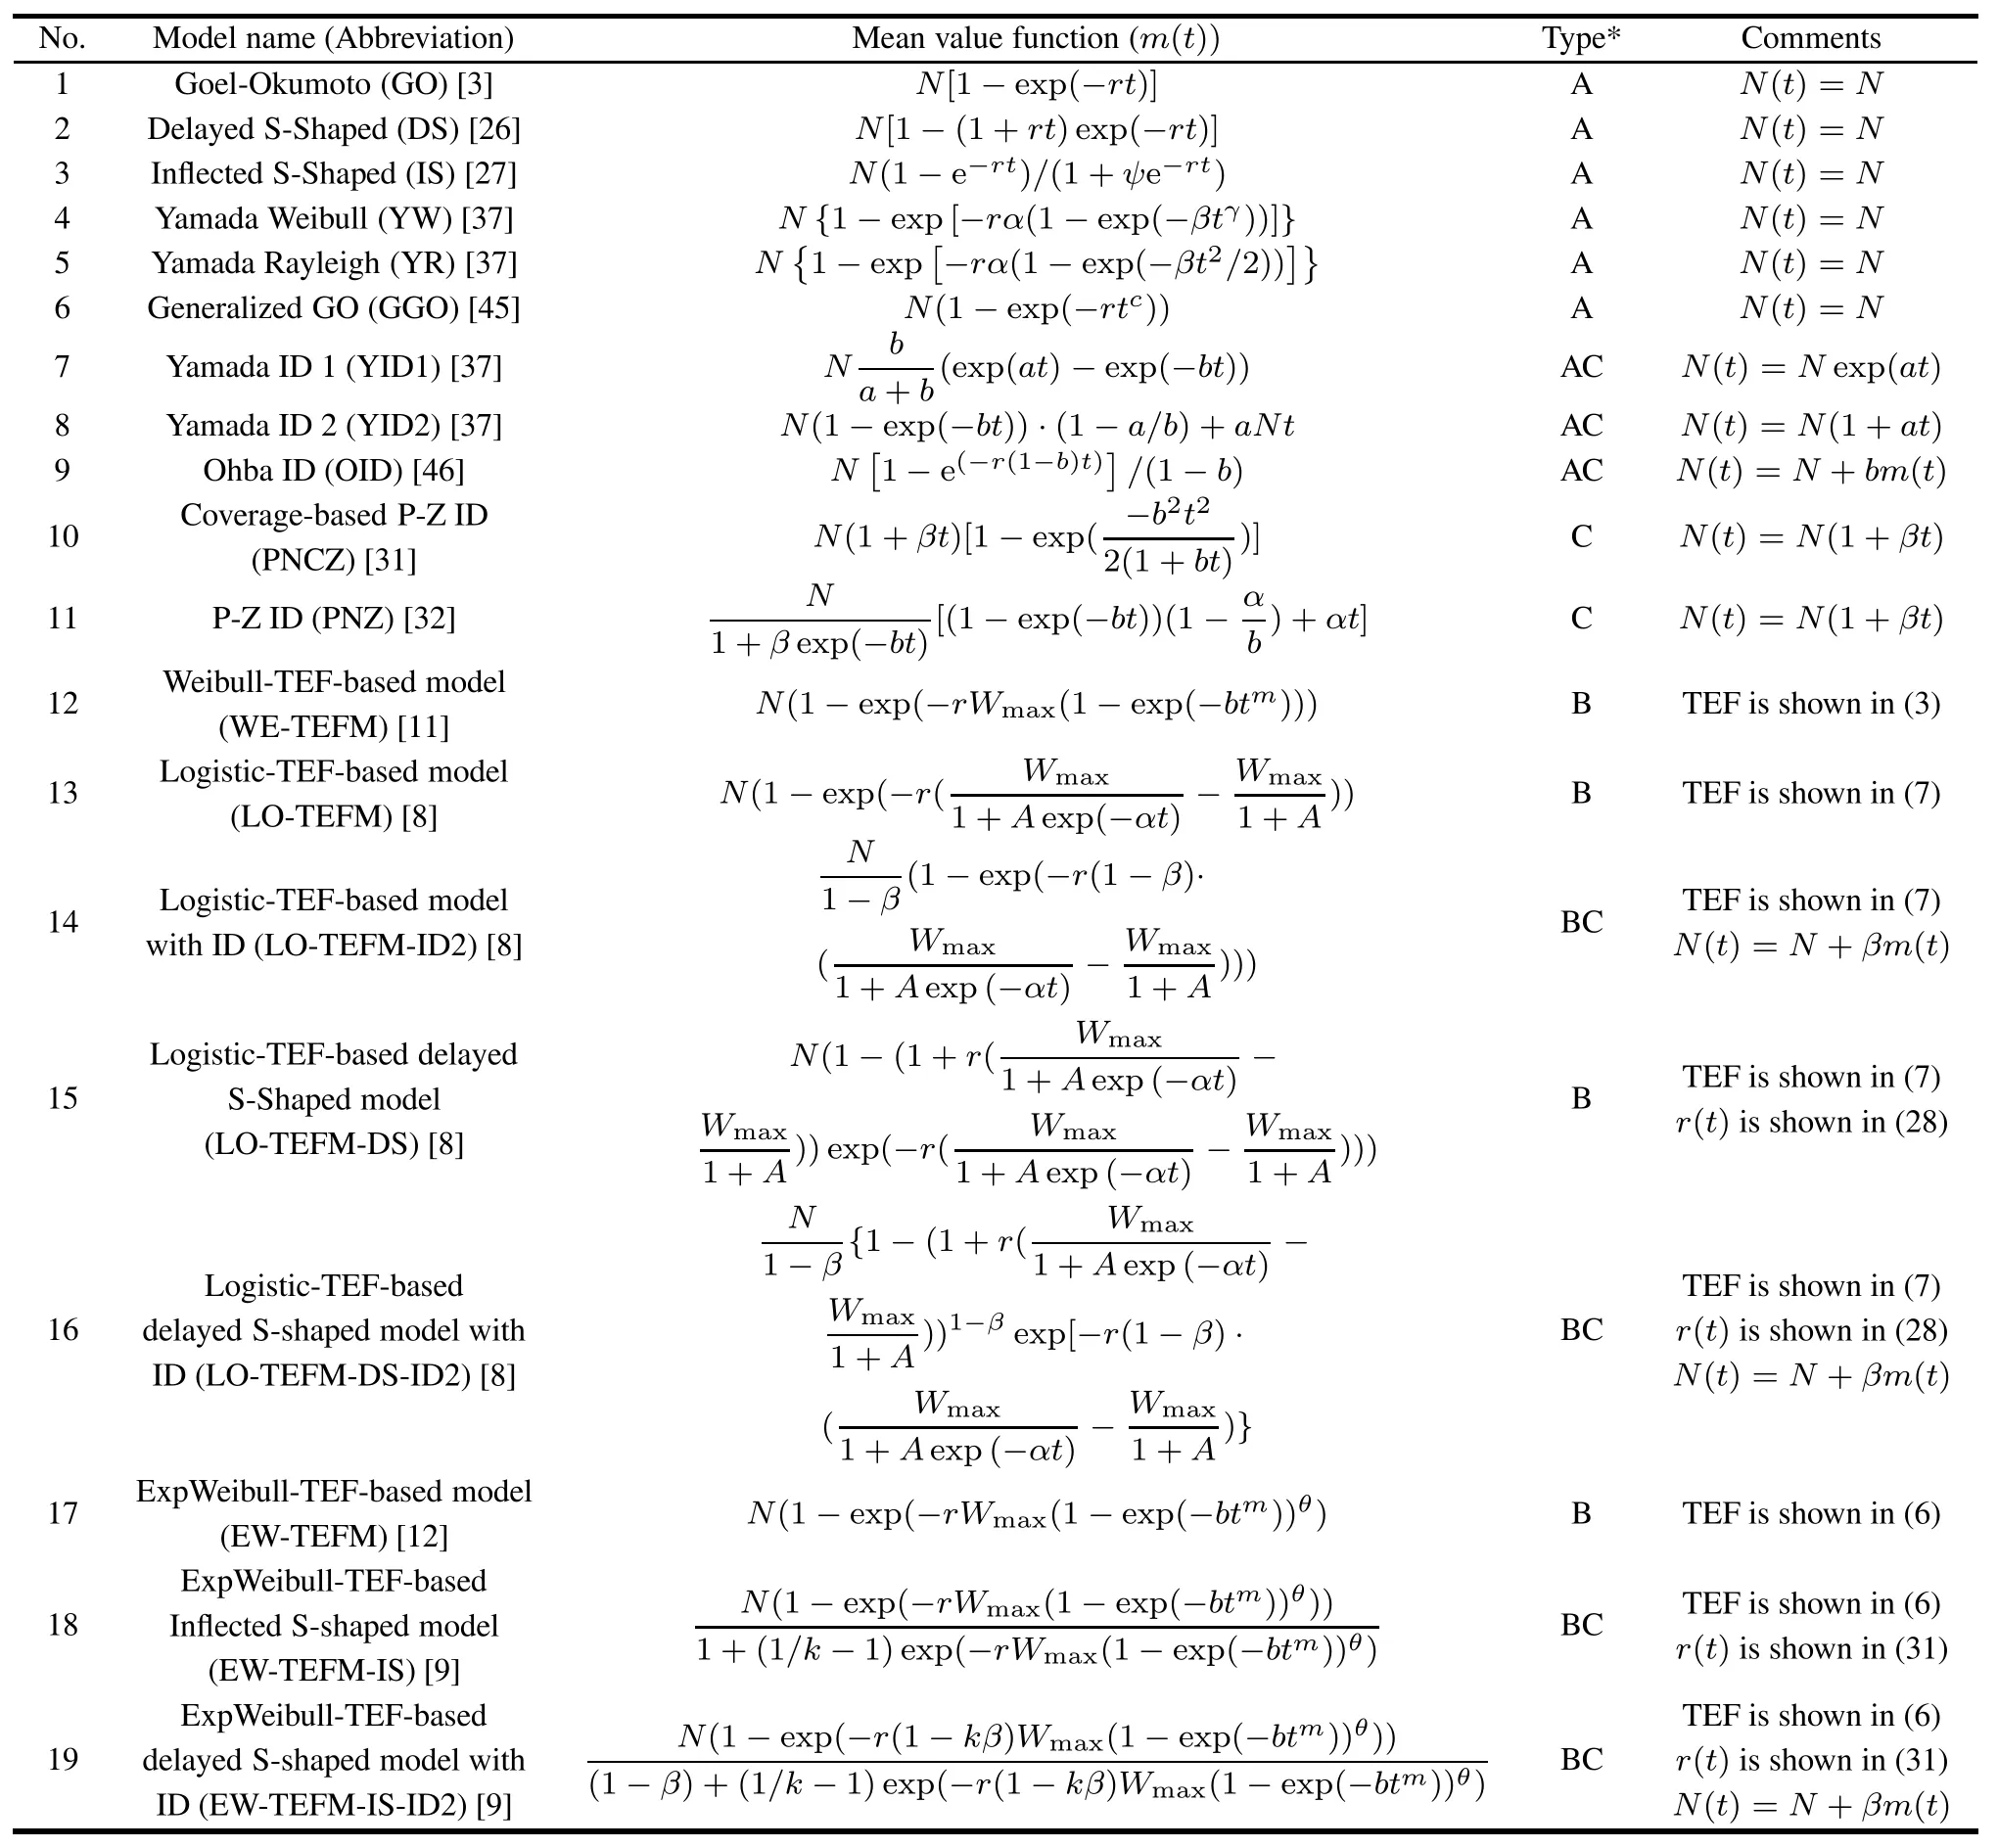
Table 2 Overview of the comparison NHPP SRGMs for case studies
5.1Comparison of TEFs
In this case,to validate the descriptive power of the proposed S-shaped TEFs(DS-TEF and IS-TEF),we apply all comparison TEFs to four real failure data-sets(i.e.,DS1–DS4).Then the estimated parameters and ftting results (the values of MSE and R-square)of these TEFs for DS1–DS4 are shown in Table 3 respectively.The estimated parameters of several TEFs are also available and applicable in the latter case studies.The bold number indicates the best ftting result in this column for each data-set.
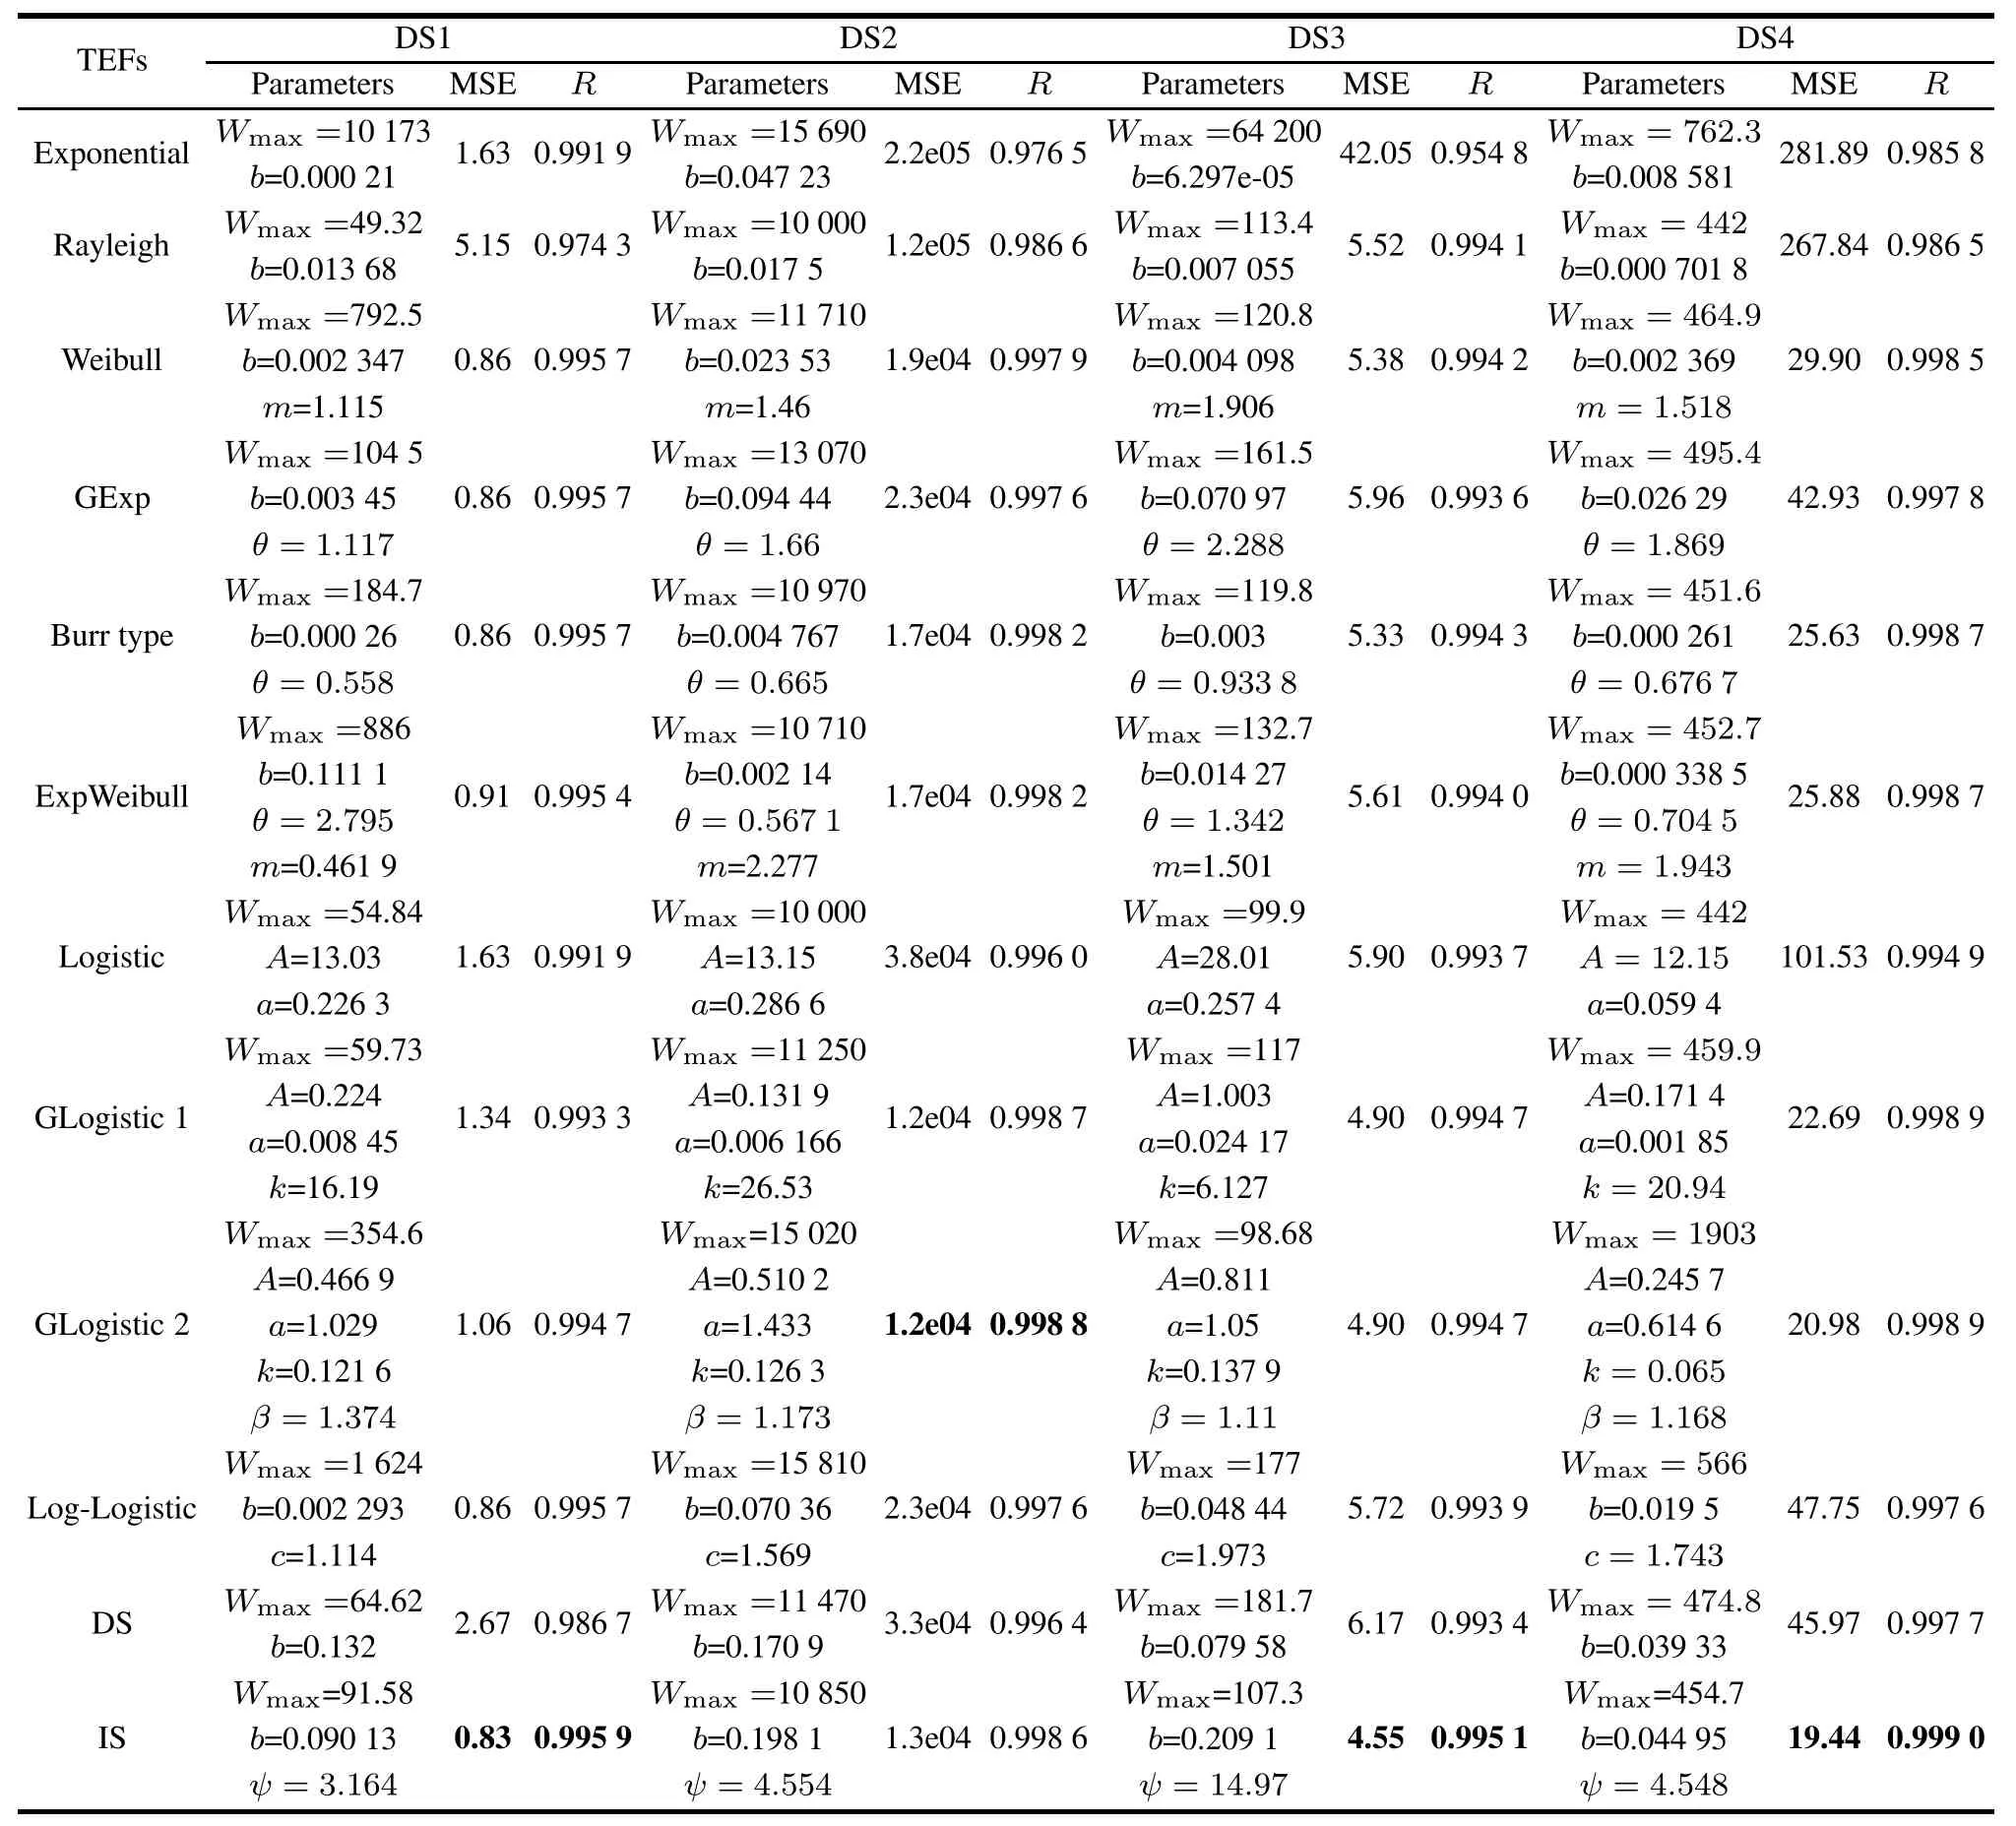
Table 3 Estimated parameters and ftting results of the comparison TEFs
From the ftting results shown in Table 3,we fnd that:
(i)Compared with other comparison TEFs,the proposed infected S-shaped TEF(i.e.,IS-TEF)provides the best ftting results(namely,the value of MSE is the least and the value of R-square is closest to 1)for three data-sets(DS1, DS3 and DS4).Only for the DS2,the ftting results of IS-TEF are a little worse than the frst and second generalized logistic TEFs(i.e.,GLogistic1&2),but still signifcantly better than other comparison TEFs.In addition,the estimated TE values of the IS-TEFs for each data-set and the corresponding actual TE values in each data-set are also plotted in Figs.1–4 respectively against the testing time for illustrating the ftting results of IS-TEF to the actual data graphically.
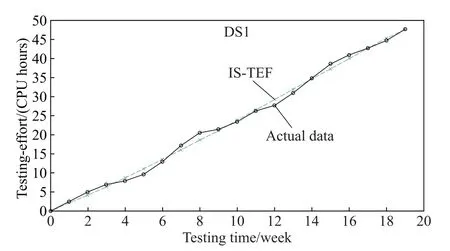
Fig.1 Observed TE data in DS1 and the estimated values of IS-TEF for DS1
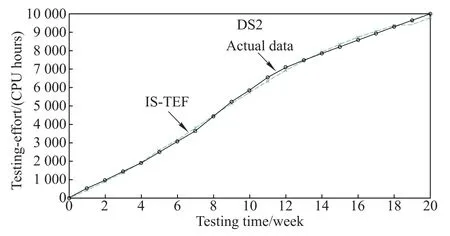
Fig.2 Observed TE data in DS2 and the estimated values of IS-TEF for DS2
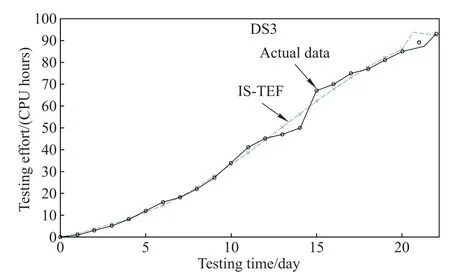
Fig.3 Observed TE data in DS3 and the estimated values of IS-TEF for DS3
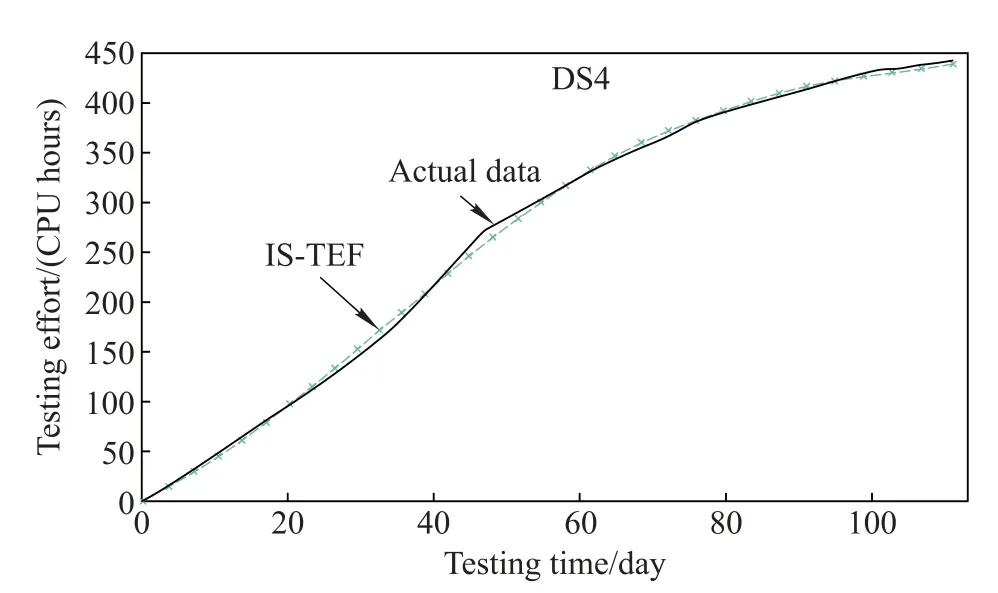
Fig.4 Observed TE data in DS4 and the estimated values of IS-TEF for DS4
Thus,we suggest that the proposed IS-TEF has a signifcantly better ftting power for accurately describing the resource consumption during the testing phase than the previous TEFs and is fexible and applicable for diverse TE data-sets.
(ii)However,it should be noted that the ftting results of the proposed delayed S-shaped TEF(DS-TEF)are a little worse compared with several TEFs for the four data-sets. It indicates that the DS-TEF is not very appropriate for describing the S-shaped growth trend of TE.
5.2Comparison of the exponential NHPP SRGMs with various TEFs
In this case,we investigate the ftting and prediction power of the exponential NHPP SRGMs with two S-shaped TEFs (i.e.,DS-TEFM and IS-TEFM)by applying these two models and several comparison SRGMs shown in Table 2 (i.e.,several classical SRGMs and the exponential NHPP SRGMs with other TEFs)to DS1–DS4 respectively.
(i)Fitting results analysis
The estimated parameters and the ftting results in terms of mean square error(MSE)and R-square of the models are plotted in Figs.5–8 respectively for illustrating the ftting results of these comparison models to the actual failure data graphically.From Tables 4–7 and Figs.5–8,we can fnd that:
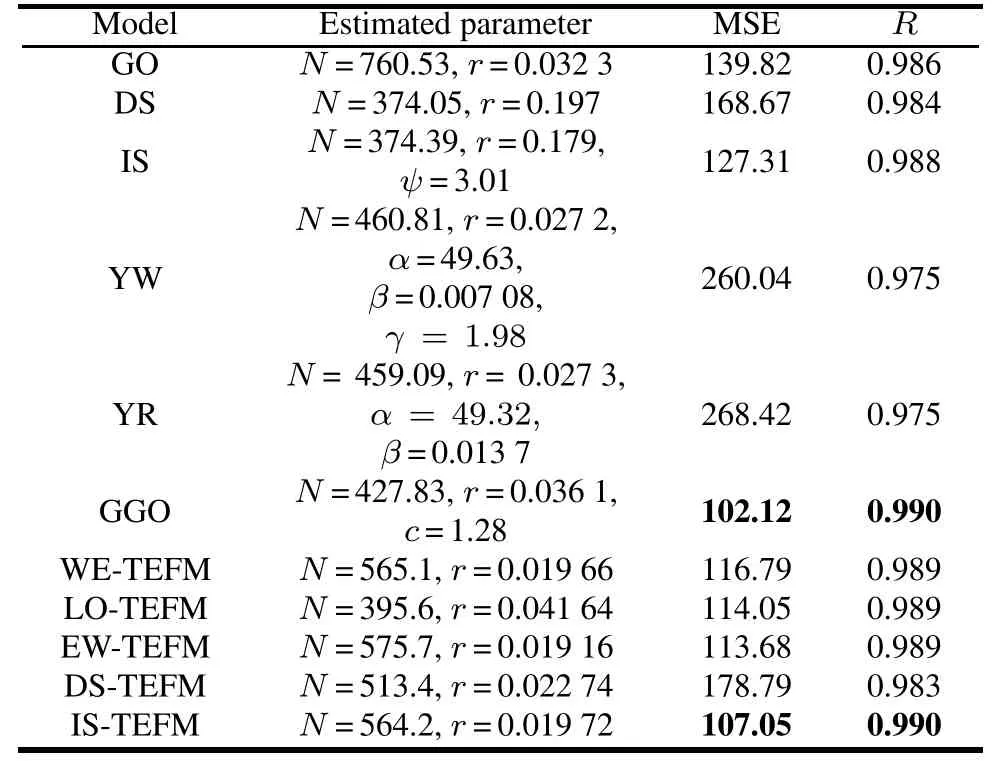
Table 4 Estimated parameters and ftting results for DS1 of the exponential NHPP SRGMs
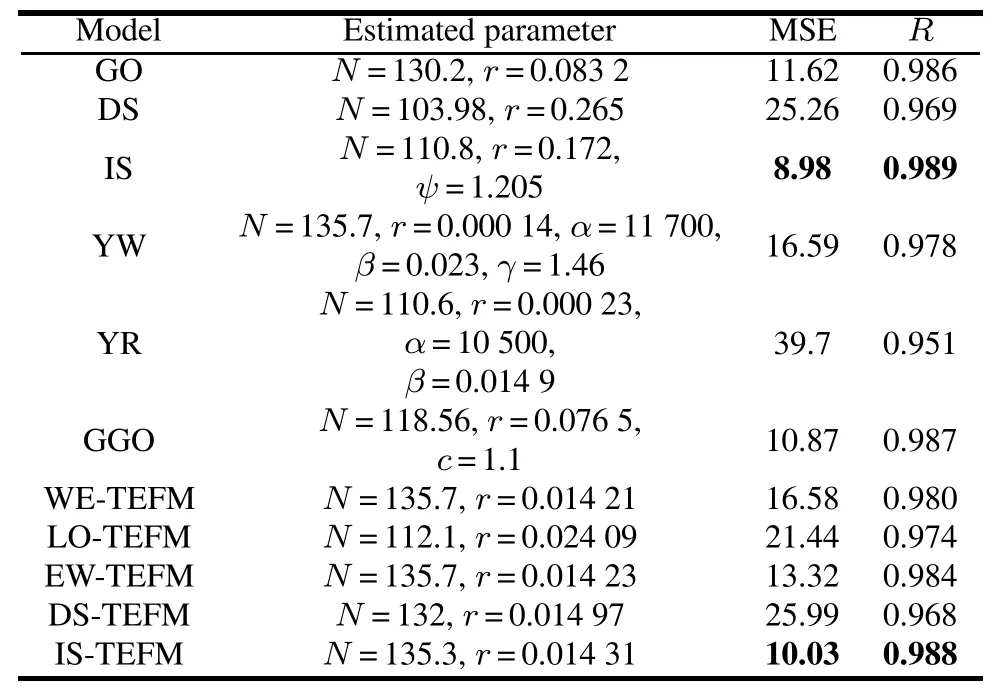
Table 5 Estimated parameters and ftting results for DS2 of the exponential NHPP SRGMs
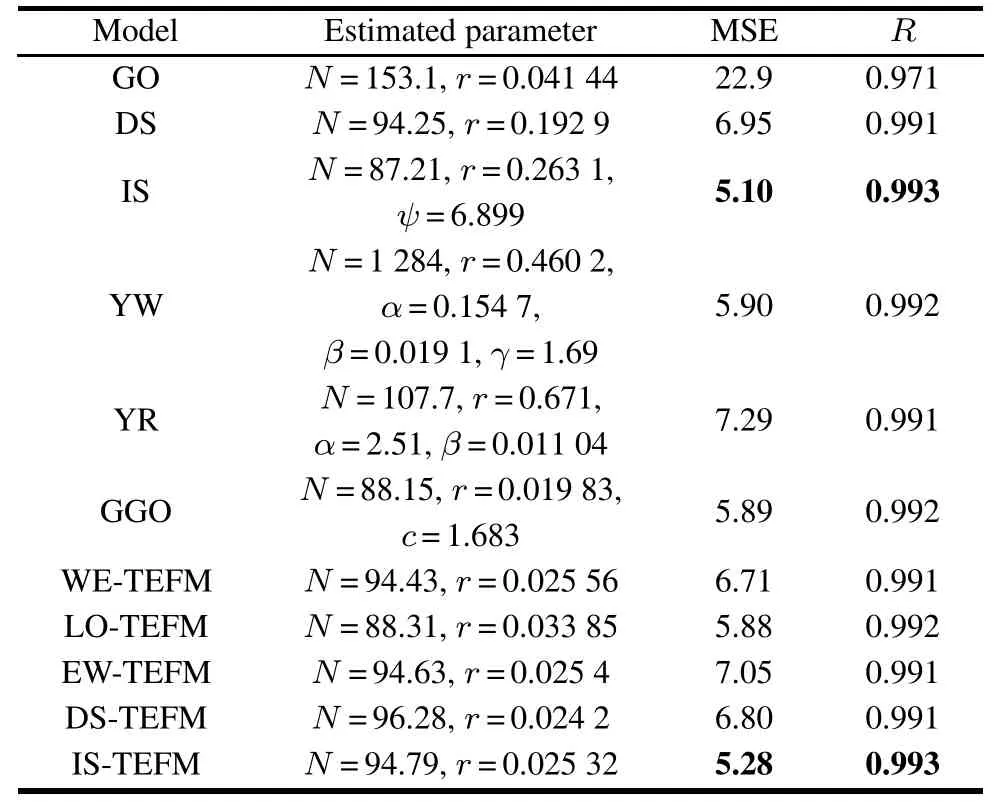
Table 6 Estimated parameters and ftting results for DS3 of the exponential NHPP SRGMs
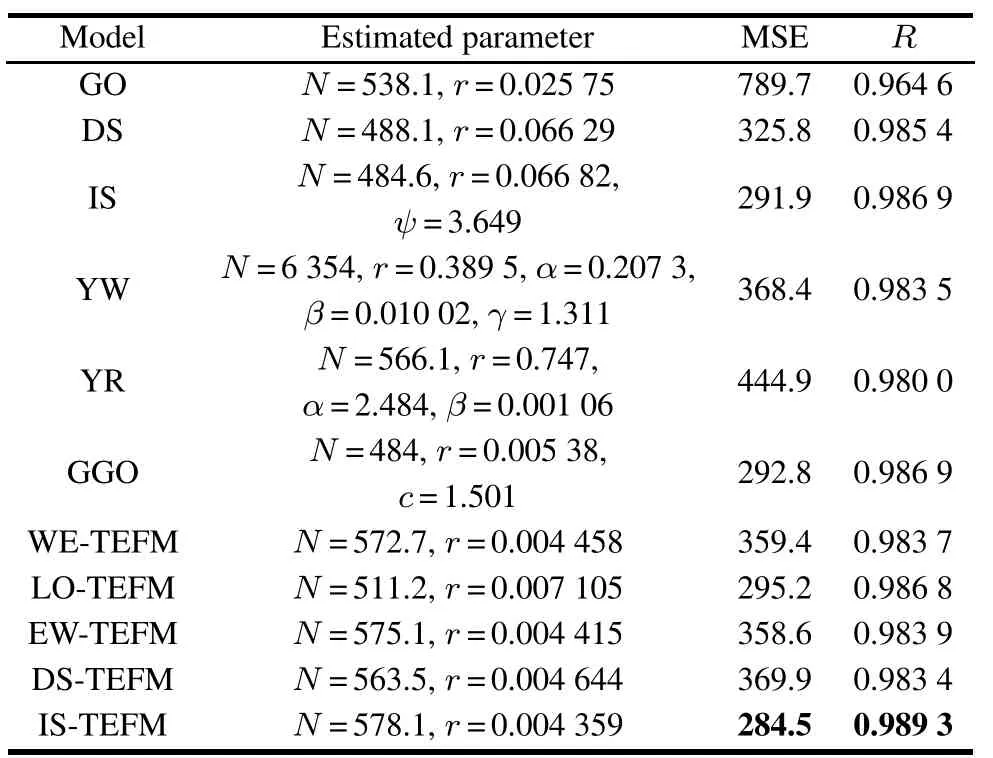
Table 7 Estimated parameters and ftting results for DS4 of the exponential NHPP SRGMs

Fig.5 Fitting results for DS1 of the exponential NHPP SRGMs
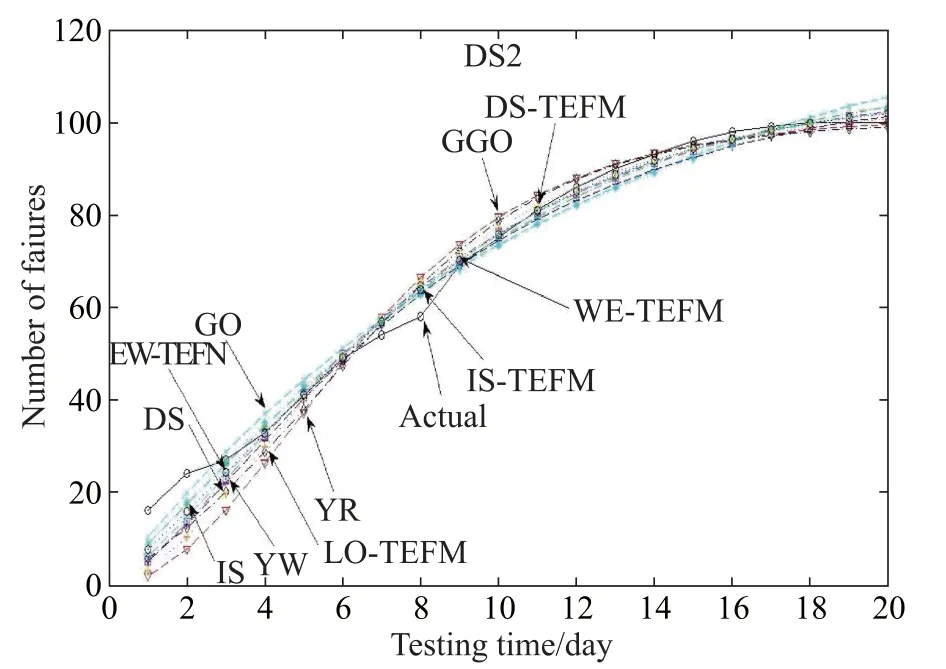
Fig.6 Fitting results for DS2 of the exponential NHPP SRGMs
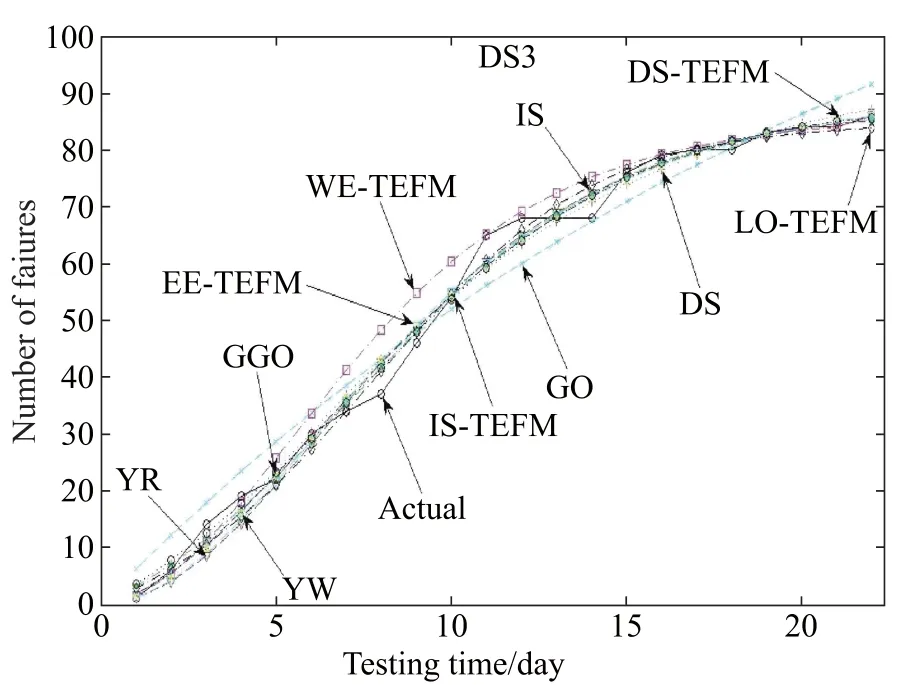
Fig.7 Fitting results for DS3 of the exponential NHPP SRGMs
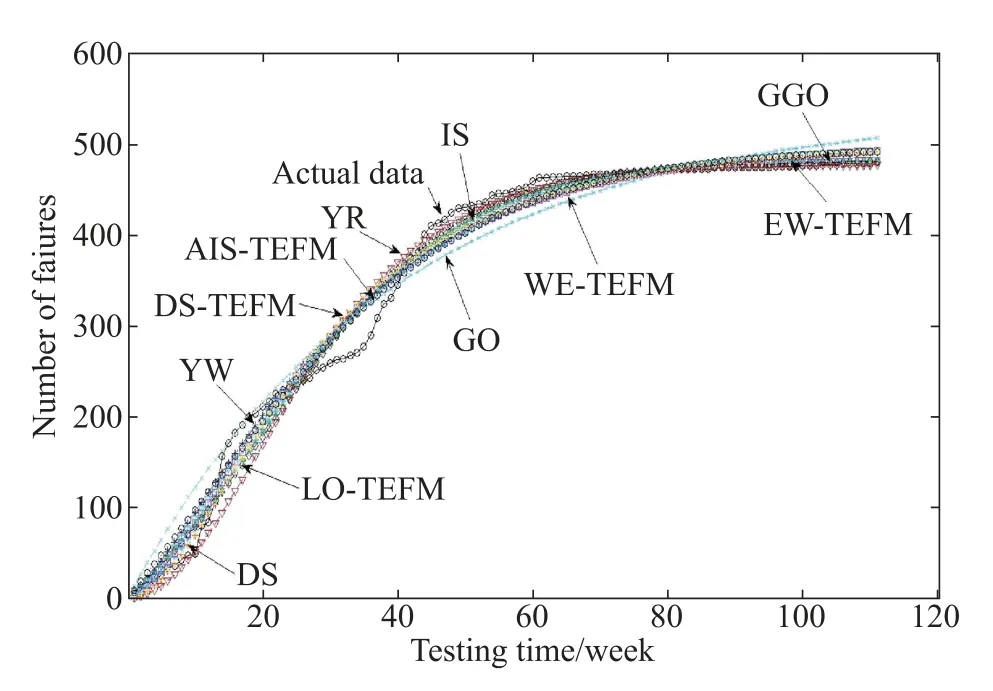
Fig.8 Fitting results for DS4 of the exponential NHPP SRGMs
For DS1,the best two SRGMs which have the least values of MSE and the largest values of R-square are GGO and the IS-TEFM.For DS2 and DS3,the best two SRGMs are IS and IS-TEFM.For DS4,the best SRGM is ISTEFM.Although the ftting results of the proposed ISTEFM are a little worse than GGO or IS,it can consistently provide better and satisfying ftting results for eachdata-set than the other comparison SRGMs(especially,the NHPP SRGMs with the other TEFs,i.e.,the exponentiated Weibull TEF and logistic TEF)on average,and can give a more insightful interpretation for the resource consumption process during the development phase.
However,the DS-TEFM does not ft the observed failure data well for each data-set.Thus,we suggest that the DS-TEF may be not very appropriate for software reliability modeling and we will not consider and discuss it in the latter case studies.
(ii)Predictive results analysis
Figs.9–12 depict the RE curves for different comparison models shown in Tables 4–7 for four data-sets respectively.From Figs.9–12,it should be noted that the relative error of the proposed IS-TEFM approaches zero faster compared with the other NHPP SRGMs with the other TEFs.Thus it indicates that the IS-TEFM also can provide pretty prediction results for each data-set.
To sum up,we can suggest that incorporating the ISTEF into the exponential-type NHPP SRGMs indeed can signifcantly improve the ftting and prediction power of SRGMs.
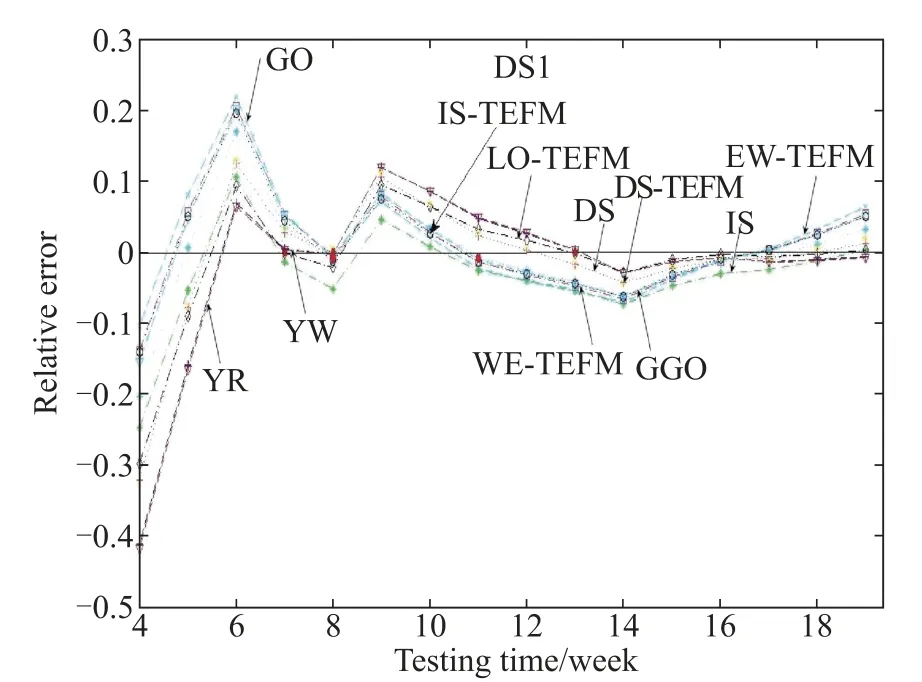
Fig.9 RE curves for DS1 of the exponential NHPP SRGMs
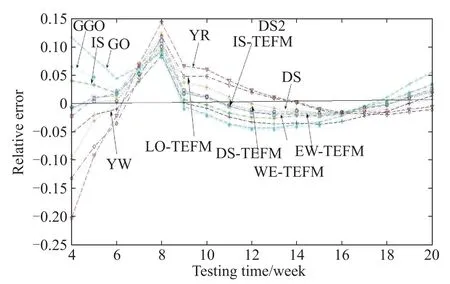
Fig.10 RE curves for DS2 of the exponential NHPP SRGMs
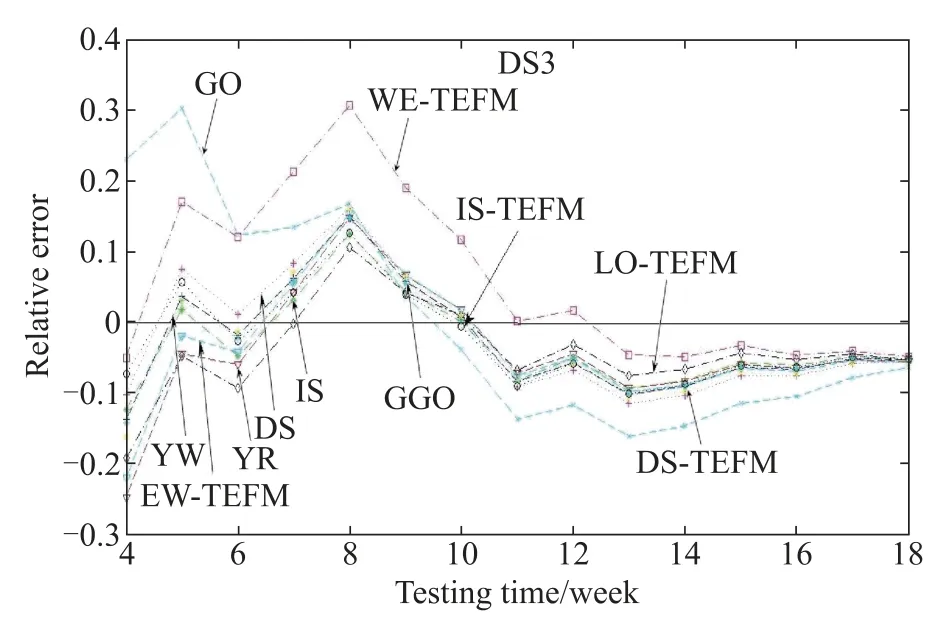
Fig.11 RE curves for DS3 of the exponential NHPP SRGMs
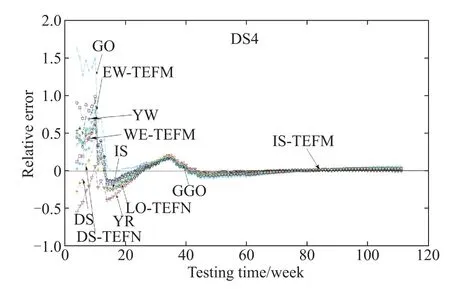
Fig.12 RE curves for DS4 of the exponential NHPP SRGMs
5.3Comparison of the S-shaped NHPP SRGMs with various TEFs
In this case,frst we will investigate the ftting and prediction power of the delayed S-shaped and infected S-shaped NHPP SRGMs with infected S-shaped TEF(i.e.,ISTEFM-DS and IS-TEFM-IS)by applying these two models and several comparison SRGMs shown in Table 2(i.e., several classical SRGMs,the exponential NHPP SRGMs with various TEFs,and the S-shaped NHPP SRGMs with various TEFs)to DS1–DS3 respectively.Then we will further discuss which is the most appropriate SRGM for reliability modeling with TEFs among the three types of NHPP SRGMs(i.e.,exponential,delayed S-shaped and infected S-shaped)by comparing the exponential,delayed S-shaped and infected S-shaped NHPP SRGMs with various TEFs respectively for DS1–DS3.
(i)Fitting results analysis
The estimated parameters and the ftting results in terms of MSE and R-square of the comparison SRGMs for each failure data-set are shown in Tables 7–9 respectively. Moreover,the observed failure data and the estimated data of several comparison models(i.e.,the NHPP SRGMs with various TEFs)are also plotted in Figs.11–13 respectivelyfor graphically illustrating the ftting results of these comparison models.
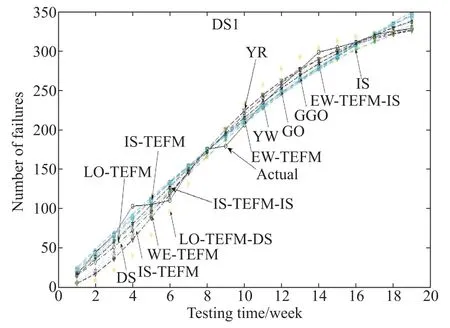
Fig.13 Fitting results for DS1 of the S-shaped NHPP SRGMs
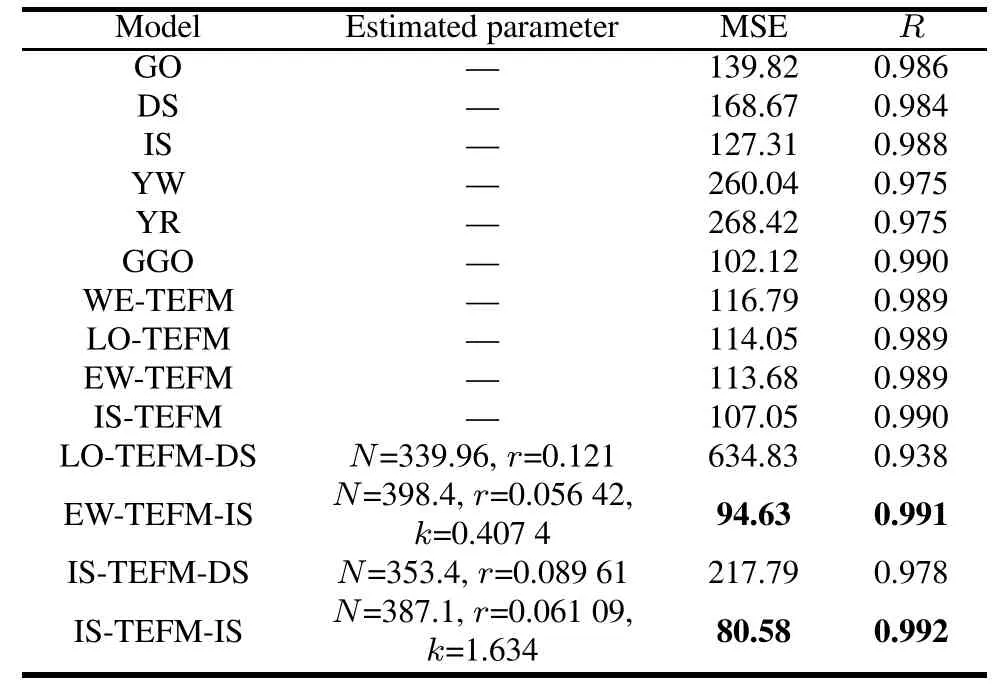
Table 8 Estimated parameters and ftting results for DS1 of the S-shaped NHPP SRGMs
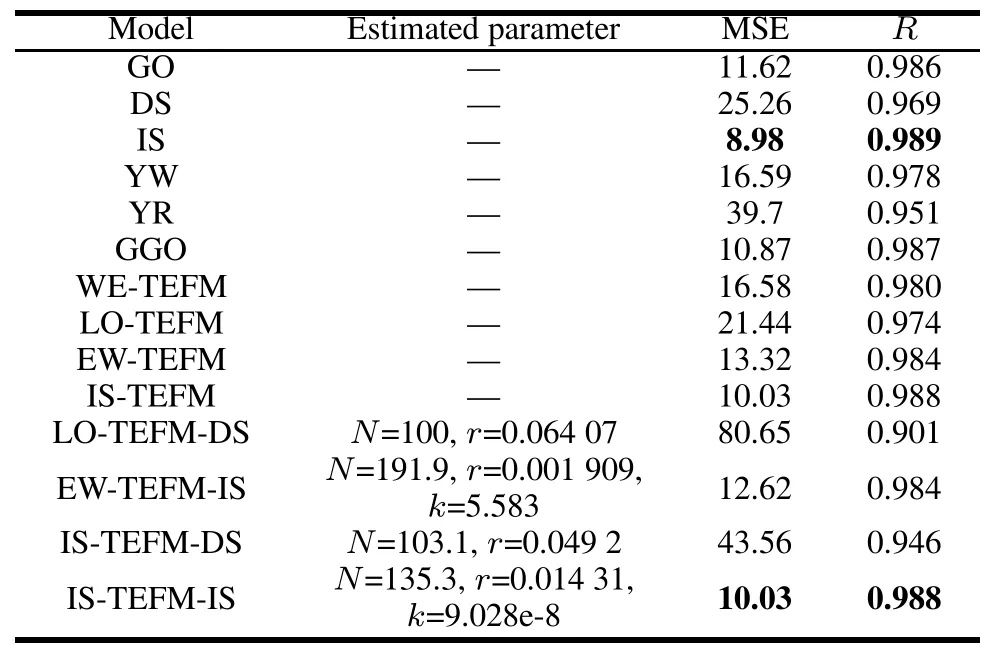
Table 9 Estimated parameters and ftting results for DS2 of the S-shaped NHPP SRGMs
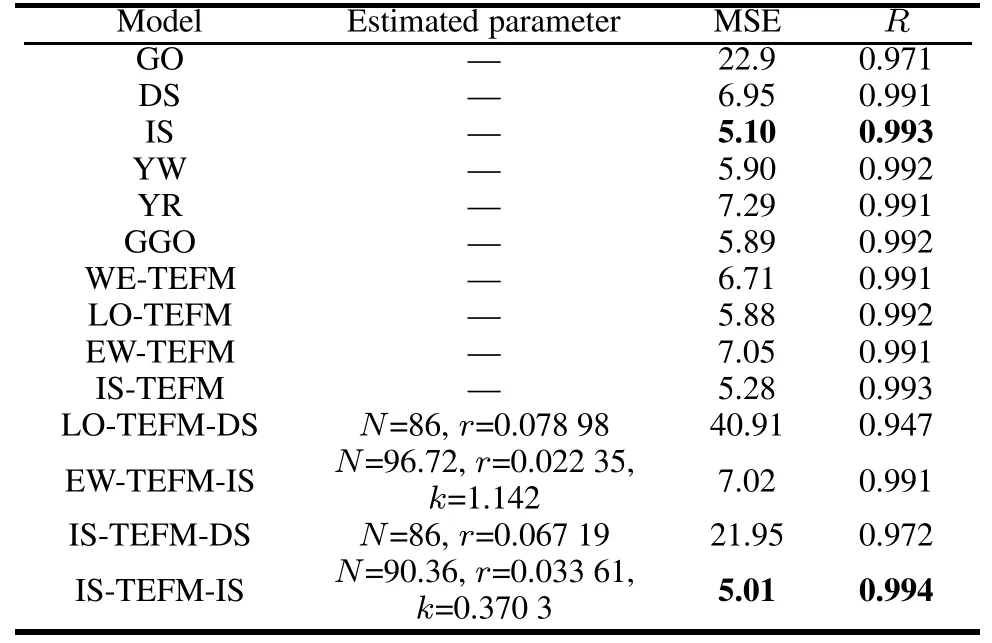
Table 10 Estimated parameters and ftting results for DS3 of the S-shaped NHPP SRGMs
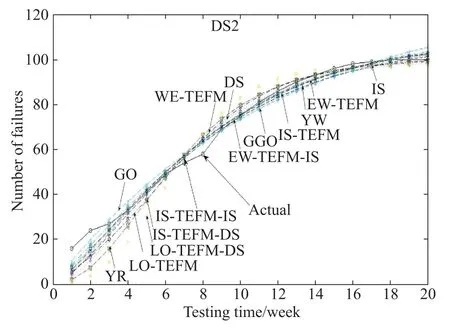
Fig.14 Fitting results for DS2 of the S-shaped NHPP SRGMs
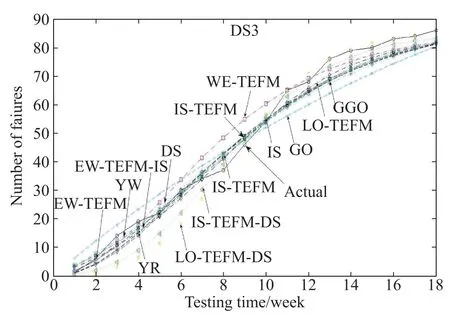
Fig.15 Fitting results for DS3 of the S-shaped NHPP SRGMs
As seen in Tables 8–10 and Figs.13–15,we can fnd that:
For DS1,the proposed IS-TEFM-IS and the EW-TEFMIS yield the best ftting results,that is,they have the least values of MSE and the largest values of R-square.For DS2 and DS3,the best two SRGMs are IS and IS-TEFM-IS.Especially,for DS1 or DS3 the IS-TEFM-IS has the best ftting result compared with all comparison SRGMs.Thus, it indicates that the IS-TEFM-IS has a signifcantly pretty ftting power as well as applicable for various data-sets.
However,it should be noted that the ftting results of the proposed IS-TEFM-DS for each failure data-set are not very good and signifcantly worse than IS-TEFM and ISTEFM-IS.Thus we conclude that among these three types of NHPP SRGMs,the infected S-shaped NHPP SRGM is the most suitable for reliability modeling with TEFs,the exponential-type is the second and the delayed S-shaped NHPP SRGM is the worst.To further validate this conclusion,we will give the following discusses.
We integrate the ExpWeibull(6),logistic(7)and infect S-shaped(15)TEFs into the exponential-type(20), delayed S-shaped(30)and infected S-shaped(33)NHPP SRGMs respectively to obtain the following nine models,namely LO-TEFM,LO-TEFM-DS,LO-TEFM-IS, EW-TEFM,EW-TEFM-DS,EW-TEFM-IS,IS-TEFM,ISTEFM-DSandIS-TEFM-IS.Then we compare these models by respectively applying them into DS1–DS3.The estimated parameters and the ftting results of these models are shown in Tables 11–13.
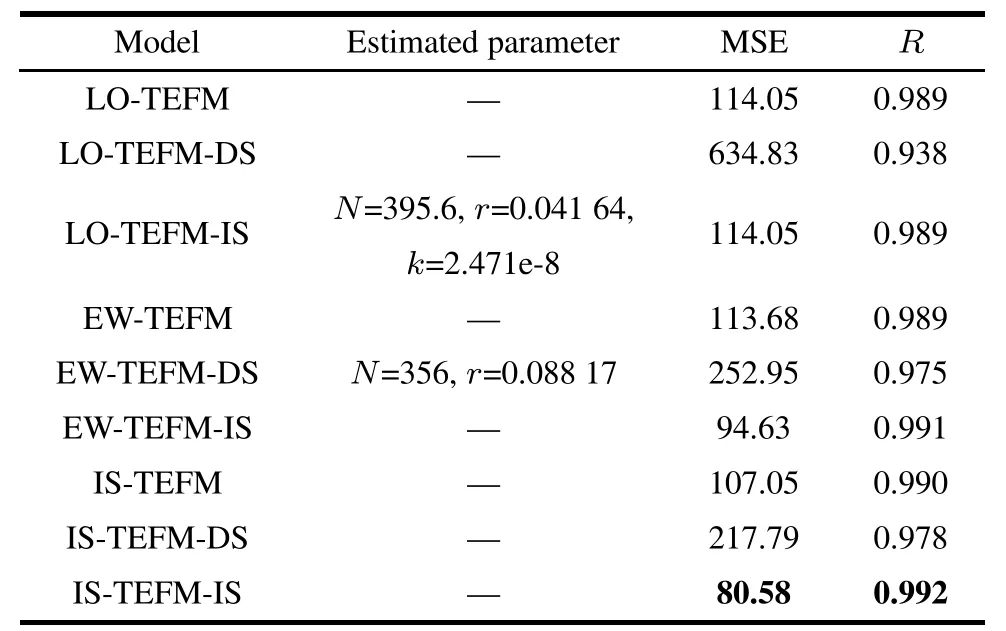
Table 11 Estimated parameters and the ftting results of the nine NHPP SRGMs with various types and TEFs for DS1
According to Tables 11–13,for each failure data-set, each infected S-shaped NHPP SRGM with TEF yields better ftting results compared with the exponential-type and delayed shaped NHPP SRGM with the same TEF.For example,for DS1,the IS-TEFM-IS has the best ftting results(the value of MSE is 80.58,andthe value of R-square is 0.992)compared with the IS-TEFM(107.05 and 0.990) and IS-TEFM-DS(217.79 and 0.978).Especially,sometimes the ftting results of the infected S-shaped and the exponential NHPP SRGMs with the TEF are both signifcantly better than the delayed S-shaped NHPP SRGMs with the same TEF.For example,for DS1,the ftting result in terms of MSE of LO-TEFM-DS is 634.83,and the ftting result of LO-TEFM or LO-TEFM-ISis only 114.05. Thus,the previous conclusion is reasonable that the infected S-shaped NHPP SRGM is the most suitable for reliability modeling with TEFs,and the delayed S-shaped NHPP SRGM is the most unsuitable oppositely.As a result,we will not considerand discuss the delayed S-shaped NHPP SRGMs with TEFs in the latter case studies.
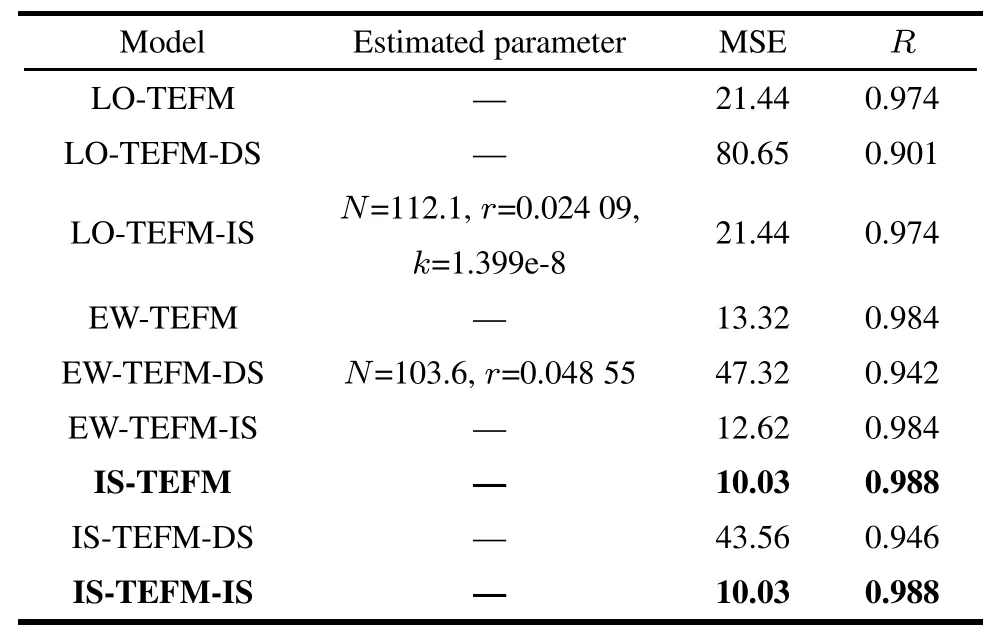
Table 12 Estimated parameters and the ftting results of the nine NHPP SRGMs with various types and TEFs for DS2
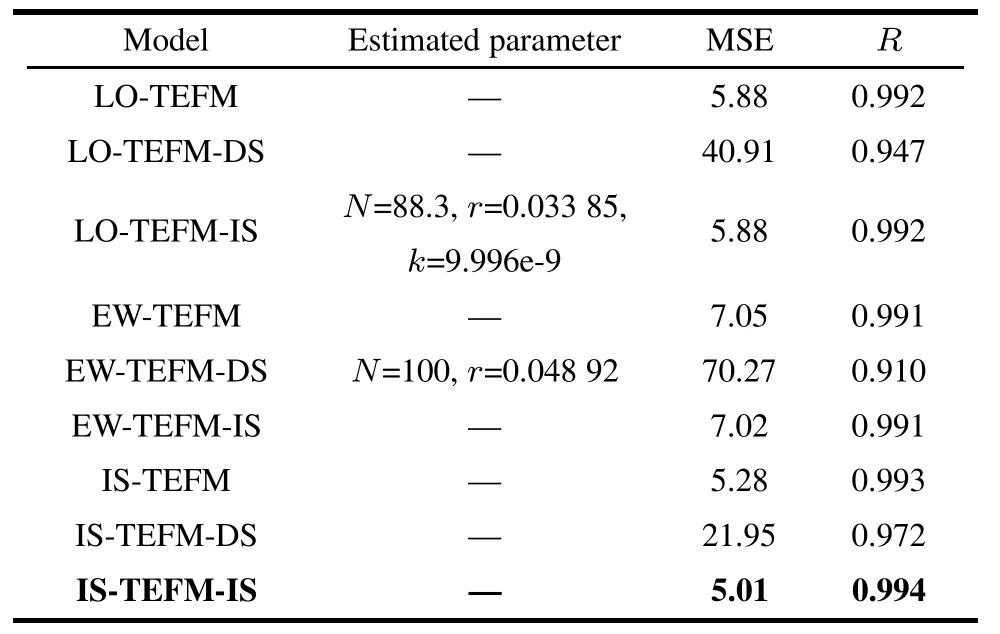
Table 13 Estimated parameters and the ftting results of the nine NHPP SRGMs with various types and TEFs for DS3
It should be noted that,sometimes the infected S-shaped NHPP SRGM with the TEF nearly has the same ftting results compared with the exponential-type NHPP SRGM with the same TEF.For example,for DS1,the ftting results in terms of MSE and R-square of LO-TEFM are all the same as LO-TEFM-IS.The underlying reason may be that the infection factor k of LO-TEFM-IS is very close to zero(such as for DS1,k=2.471e-8).Inother words,incorporating the logistic TEF into the infected S-shaped SRGM tends to have a trivial effect on improving the ftting results.However,for ExpWeibull and infected S-shaped TEFs,the ftting results of EW-TEFMIS or IS-TEFM-IS are all better than the ones of EW-TEFM or IS-TEFM.Thus,as a whole,we recommend incorporating TEFs into the infected S-shaped SRGM for obtaining signifcant ftting and prediction results.
(ii)Predictive results analysis
Figs.16–18depict the RE curves of several comparison models(the NHPP SRGMs with various TEFs)for three data-sets respectively.According to the Figs.16–18,RE of the proposed IS-TEFM-IS approaches zero with time faster compared with the other comparison SRGMs.Thus it indicates that the IS-TEFM-IS also predicts more accurately than the other comparison models.
To sum up,in this case,the proposed infected S-shaped NHPP SRGM with IS-TEF(namely IS-TEFM-IS) achieves the best ftting and predictive power compared with other comparison models for each data-set.Furthermore we suggest that incorporating TEFs into the infected S-shaped SRGM may illustrate and predict the failure behaviors more accurately and applicably.
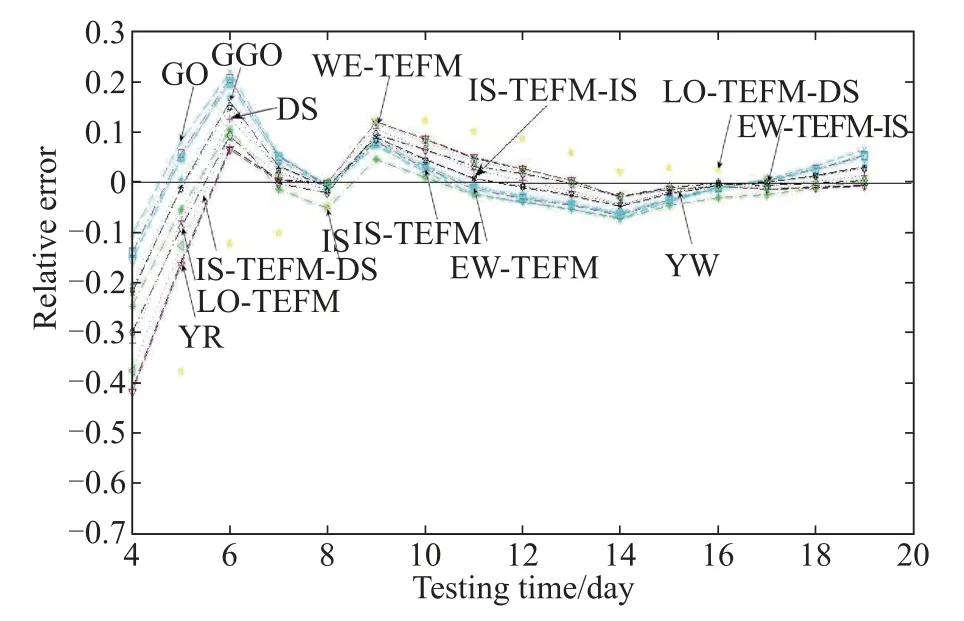
Fig.16 RE curves for DS1 of the S-shaped NHPP SRGMs
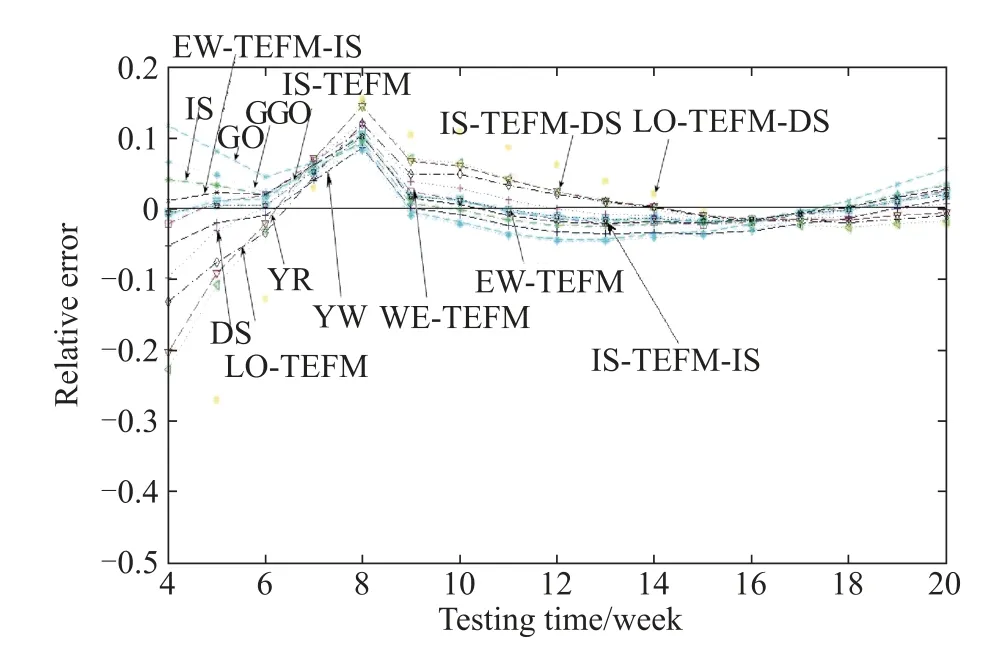
Fig.17 RE curves for DS2 of the S-shaped NHPP SRGMs
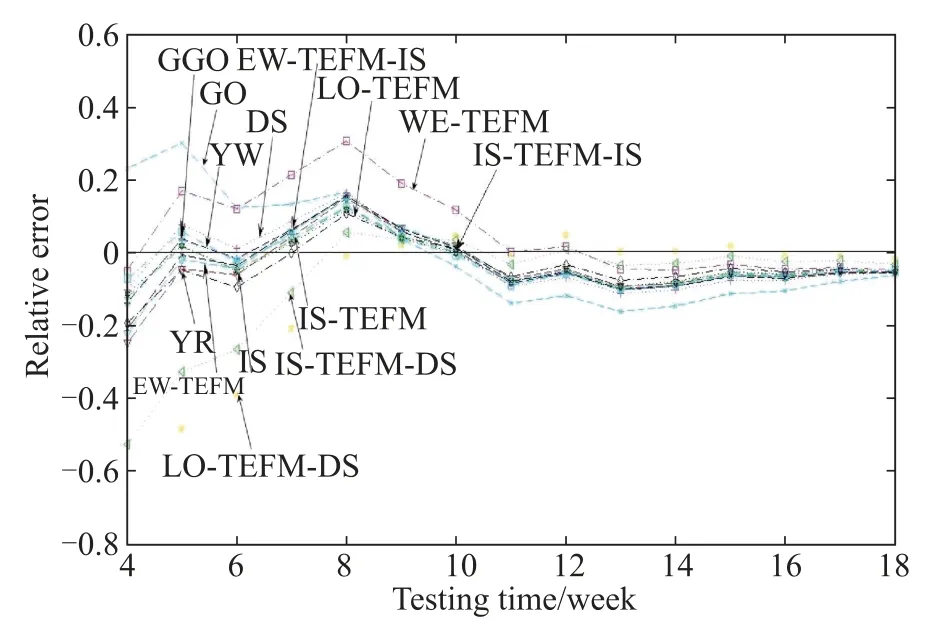
Fig.18 RE curves for DS3 of the S-shaped NHPP SRGMs
5.4Comparison of NHPP SRGMs with various TEFs and ID
In this case,we intend to investigate the effect of ID on modeling NHPP SRGMs with TEFs.Due to the limited space,here we only show the ftting results of NHPP SRGMs with TEFs and ID for DS1,however we give the analysis results for DS2-DS4 according to their experiment results in the end.By the way,we compare these two forms of ID for discussing which one is more suitable for considering in the NHPP SRGMs with TEFs.
We respectively incorporate two forms of ID((35)and (36))into LO-TEFM and LO-TEFM-DS(shown in Table 2)frst for obtaining four models,i.e.,LO-TEFM-ID1 (shown as(38)),LO-TEFM-ID2(shown in Table 2),LOTEFM-DS-ID1(shown as(42))and LO-TEFM-DS-ID2 (shown in Table 2,as(44)),then into EW-TEFM and EWTEFM-IS(shown in Table 2)respectively for obtaining four models,i.e.,EW-TEFM-ID1(shown as(38)),EWTEFM-ID2(shown in Table 2),EW-TEFM-IS-ID1(shown as(46))and EW-TEFM-IS-ID2(shown in Table 2),and fnally into IS-TEFM and IS-TEFM-IS for obtaining four models,i.e.,IS-TEFM-ID1(shown as(38)),IS-TEFMID2(shown as(40)),IS-TEFM-IS-ID1(shown as(46))and IS-TEFM-IS-ID2(shown as(48)).
The estimated parameters and the ftting results in terms of MSE and R-square of these comparison SRGMs for DS1 are shown in Table 14.From the results of Table 14, it can be observed that:
The ftting results of the proposed IS-TEFM-IS,ISTEFM-IS-ID1 and IS-TEFM-IS-ID2 are all the best ones compared with all the other comparison SRGMs for DS1. It indicates that incorporating IS-TEF and ID into the infected S-shaped NHPP SRGMs indeed can yield a novel ftting power for accurately describing the failure behavior as we expect.
The estimated values of the fault introduction rate(i.e.,β)in Table 13 are all close but not equal to zero(such as the value of β of LO-TEFM-ID1 is 0.004 672).It indicates that the fault removal process of DS1 may not be a completely perfect debugging process.As a result,we should consider the effect of ID in the modeling process.
It should be noted that the ftting results of most NHPP SRGMs with ID are nearly the same as the corresponding NHPP SRGMs without ID(such as IS-TEFM-IS-ID1&2 and IS-TEFM-IS).It means that the infuence of ID on improving the ftting power is less signifcant for the NHPP SRGMs with TEFs listed in Table 14.Huang[4]proposed an explaination for this phenomenon that ID should be taken into account when the software product is reaching the mature stage[47].However,we also fnd that the ftting results of two SRGMs(i.e.,LO-TEFM-DS and LOTEFM)are signifcantly improved when these two SRGMs consider Form 1 of ID(i.e.,LO-TEFM-DS-ID1 and LOTEFM-ID1).Thus we infer that compared with Form 2, Form 1 of ID sometimes may be more suitable and applicable for considering in the NHPP SRGMs with TEF.
According to the experiment results on DS2–DS4,we also fnd that the ftting results of the proposed IS-TEFMIS and IS-TEFM-IS-ID1 are the best models compared with all the other comparison SRGMs.It indicates that incorporating IS-TEF and Form 1 of ID into the infected S-shaped NHPP SRGMs indeed can yield a novel ftting power for accurately describing failure behaviors as we expect.Certainly,it is just a primary conclusion which should be validated by further experiments and discussions in our future study.
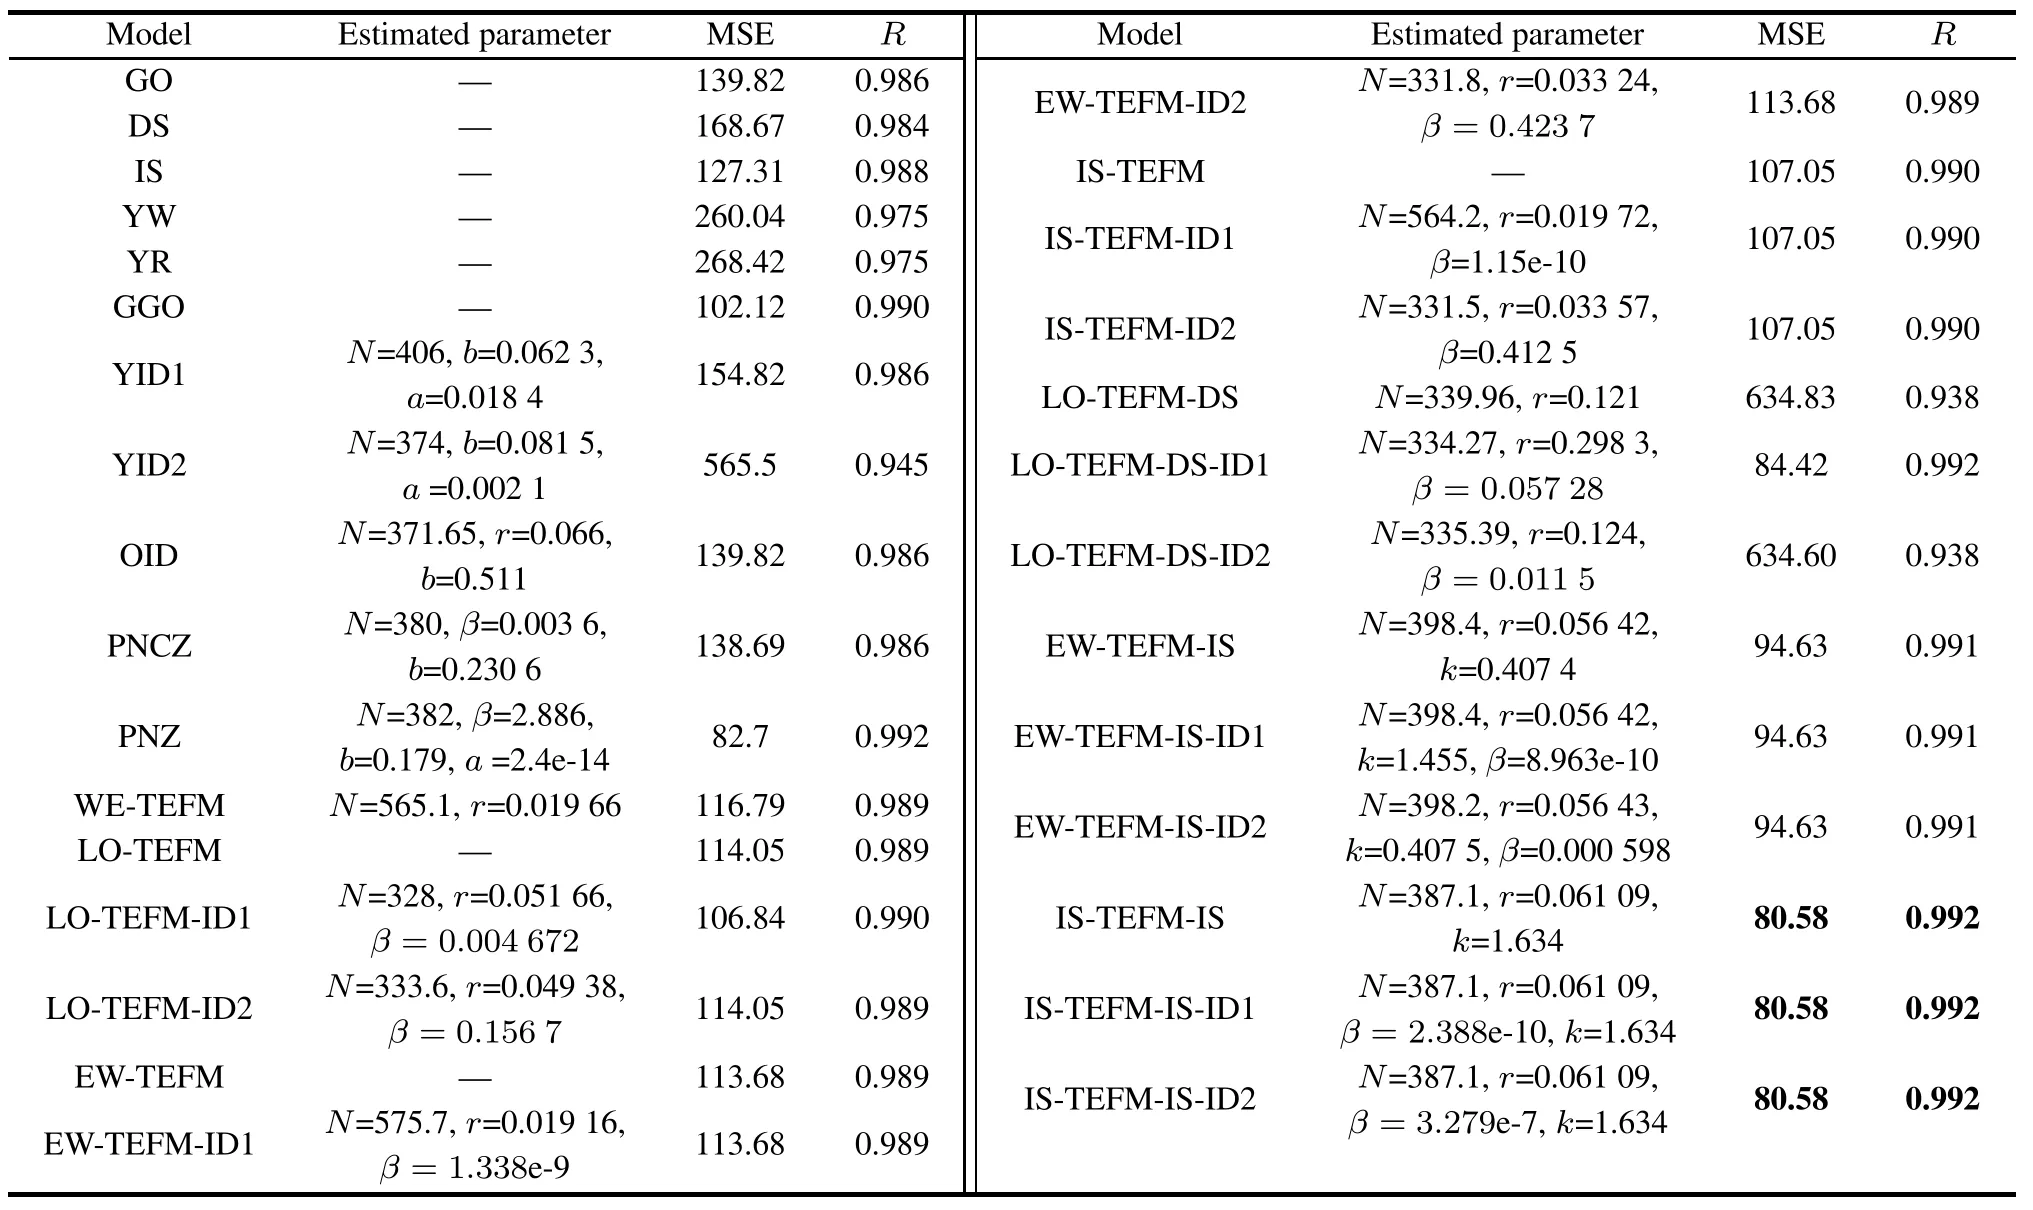
Table 14 Estimated parameters and ftting results of the NHPP SRGMs with TEFs and ID for DS1
6.Conclusions
This paper frst proposes two S-shaped TEFs,namely ISTEF and DS-TEF for describing the S-shaped growth trend of the TE consumption more accurately.Then these two S-shaped TEFs are incorporated into various types of NHPP SRGMs with two forms of ID for obtaining a series of new NHPP SRGMs which consider both S-shaped TEFs and ID.Finally,four cases are presented for validating the ftting and prediction power of these new NHPP SRGMs by applying them and several comparison NHPP SRGMs into four real failure data-sets.
The experimental results show that:(i)the proposed ISTEF is more suitable and fexible than the previous TEFs for describing the consumption of TE;(ii)the infected S-shaped NHPP SRGM is the most suitable one for reliabil-ity modeling with TEFs compared with the exponentialtype or the delayed S-shaped NHPP SRGM;(iii)incorporating the IS-TEF and ID into the infected S-shaped NHPP SRGMs yields the most accurate ftting and prediction results compared with other comparison SRGMs.
[1]M.R.Lyu.Handbook of software reliability engineering.New York:McGraw-Hill,1996.
[2]P.K.Kapur,O.Shatnawi,A.G.Aggarwal,et al.Unifed framework for developing testing effort dependent software reliability growth models.WSEAS Trans.on Systems,2009,8(4): 521–531.
[3]H.Pham.Software reliability.Singapore:Springer-Verlag, 2000.
[4]C.Y.Huang,S.Y.Kuo,M.R.Lyu.An assessment of TE dependent software reliability growth models.IEEE Trans.on Reliability,2007,56(2):198–211.
[5]K.Shibata,K.Rinsaka,T.Dohi.Metrics-based software reliability models using non-homogeneous Poisson processes. Proc.of the 17th IEEE International Symposium on Software Reliability Engineering,2006:52–61.
[6]X.Cai,M.R.Lyu.Software reliability modeling with test coverage experimentation and measurement with a fault-tolerant software project.Proc.of the 18th IEEE International Symposium on Software Reliability,2007:17–26.
[7]S.Y.Kuo,C.Y.Huang,M.R.Lyu.Framework for modeling software reliability,using various testing-efforts and faultdetection rates.IEEE Trans.on Reliability,2001,50(3):310–320.
[8]C.Y.Huang,S.Y.Kuo.Analysis of incorporating logistic testing-effort function into software reliability modeling.IEEE Trans.on Reliability,2002,51(3):261–270.
[9]N.Ahmad,M.G.M.Khan,L.S.Raf.A study of testing-effort dependent infection S-shaped software reliability growth models with imperfect debugging.International Journal of Quality&Reliability Management,2010,27(1):89–110.
[10]E.F.Norman,N.Martin,A critique of software defect prediction models.IEEE Trans.on Software Engineering,1999, 25(5):675–688.
[11]S.Yamada,J.Hishitani,S.Osaki.Software reliability growth model with Weibull testing effort:a model and application. IEEE Trans.on Reliability,1993,42(1):100–106.
[12]N.Ahmad,M.U.Bokhari,S.M.K.Quadri,et al.The exponentiated Weibull software reliability growth model with various testing-efforts and optimal release policy.International Journal of Quality&Reliability Management,2008,25(2): 211–235.
[13]S.M.K.Quadri,N.Ahmad.Nonhomogeneous Poisson process software reliability growth model with generalized exponential testing effort function.RAU Journal of Research,2006, 16(2):159–163.
[14]N.Ahmad,M.G.M.Khan,S.M.K.Quadri,et al.Modeling and analysis of software reliability with Burr type X testingeffort and release-time determination.Journal of Modeling in Management,2009,4(1):28–54.
[15]C.Y.Huang.Cost-reliability-optimal release policy for software reliability models incorporating improvements in testing effciency.The Journal of Systems and Software,2005,77(2): 139–155.
[16]C.Y.Huang,M.R.Lyu.Optimal release timefor software systems considering cost,testing-effort,and test effciency.IEEE Trans.on Reliability,2005,54(4):583–591.
[17]M.U.Bokhari,N.Ahmad.Analysis of a software reliability growth models:the case of log-logistic test-effort function. Proc.of the 17th IASTED International Conference on Modeling and Simulation,2006:540–545.
[18]S.Chatterjee,R.B.Misra,S.S.Alam.Joint effect of test effort and learning factor on software reliability and optimal release policy.International Journal of System Science,1997,28(4): 391–396.
[19]C.Y.Huang.Performance analysis of software reliability growth models with testing-effort and change-point.The Journal of Systems and Software,2005,76(2):181–194.
[20]C.T.Lin,C.Y.Huang,J.R.Chang.Integrating generalized Weibull-type testing-effort function and multiple changepoints into software reliability growth models.Proc.of the 12th Asia-Pacifc Software Engineering Conference,2005: 431–438.
[21]C.T.Lin,C.Y.Huang.Enhancing and measuring the predictive capabilities of testing-effort dependent software reliability models.The Journal of Systems and Software,2008,81(6): 1025–1038.
[22]P.K.Kapur,P.S.Grover,S.Younes.Modeling an imperfect debugging phenomenon with testing effort.Proc.of the 5th IEEE International Symposium on Software Reliability,1994: 178–183.
[23]P.K.Kapur,A.Gupta.Testing effort control using fexible software reliability growth model with change point.International Journal of Performability Engineering,2006,2(3): 245–262.
[24]P.K.Kapur,D.N.Goswami,A.Bardhan,et al.Flexible software reliability growth model with testing effort dependent learning process.Applied Mathematical Modeling,2008, 32(7):1298–1307.
[25]P.C.Jha,D.Gupta,B.Yang,et al.Optimal testing resource allocation during module testing considering cost,testing effort and reliability.Computers&Industrial Engineering,2009, 57(3):1122–1130.
[26]S.Yamada,M.Ohba,S.Osaki.S-shaped software reliability growth models and their applications.IEEE Trans.on Reliability,1984,33(4):289–292.
[27]M.Ohba.Infection S-shaped software reliability growth model.Stochastic Models in Reliability Theory.Berlin: Springer,1984:144–162.
[28]C.Y.Huang,M.R.Lyu,S.Y.Kuo.A unifed scheme of some Nonhomogeneous Poisson process models.IEEE Trans. on Reliability,2003,29(3):261–269.
[29]A.L.Goel,K.Okumoto.An analysis of recurrent software errors in a real-time control system.Proc.of the ACM Annual Conference,1978:496–501.
[30]H.Pham,L.Nordmann,X.M.Zhang.A general imperfect software debugging model with S-shaped fault-detection rate. IEEE Trans.on Reliability,1999,48(2):169–175.
[31]H.Pham,X.M.Zhang.NHPP software reliability and cost models with testing coverage.European Journal of Operational Research,2003,145(2):445–454.
[32]H.Pham.An imperfect-debugging fault-detection dependentparameter software.International Journal of Automation and Computing,2007,4(4):325–328.
[33]B.May.Predicting software reliability using an imperfect debugging Jelinski-Moranda non-homogeneous Poisson process model.Model Assisted Statistics and Applications,2010,5(1): 31–41.
[34]M.Xie,B.Yang.A study of the effect of imperfect debugging on software development cost model.IEEE Trans.on Software Engineering,2003,29(5):471–473.
[35]H.J.Shyur.A stochastic software reliability model with imperfect-debugging and change-point.Journal of Systems and Software,2003,66(2):135–141.
[36]Y.C.Chang,C.T.Liu.A generalized JM model with applications to imperfect debugging in software reliability.Applied Mathematical Modeling,2009,33(9):3578–3588.
[37]S.Yamada,K.Tokuno,S.Osaki.Imperfect debugging models with fault introduction rate for software reliability assessment.International Journal of Systems Science,1992,23(12): 2241–2252.
[38]M.Ohba.Software reliability analysis models.IBM Journal of Research and Development,1984,28(4):428–443.
[39]A.P.Wood.Predicting software reliability.Computer,1996, 29(11):69–77.
[40]Y.Tohma,R.Jacoby,Y.Murata.Hyper-geometric distribution model to estimate the number of residual software faults.Proc. of the 13th Annual International Computer Software and Applications Conference,1989:610–617.
[41]Y.S.Su,C.Y.Huang.Neural-network-based approaches for software reliability estimation using dynamic weighted combinational models.Journal of Systems and Software,2007, 80(4):606–615.
[42]J.Zhao,H.W.Liu,G.Cui,et al.Software reliability growth model with change-point and environmental function.Journal of Systems and Software,2006,79(11):1578–1587.
[43]J.D.Musa,A.Iannino,K.Okumoto.Software reliability:measurement,prediction and application.USA:McGraw-Hill,1987.
[44]C.Y.Huang,C.T.Lin.Software reliability analysis by considering fault dependency and debugging time lag.IEEE Trans. on Reliability,2006,55(3):436–450.
[45]M.Xie.Software reliability modeling.Singapore:World Scientifc Publishing Company,1991.
[46]M.Ohba,X.M.Chou.Does imperfect debugging affect software reliability growth?Proc.of the 11th International Conference on Software Engineering,1989:273–244.
[47]M.L.Yin,L.E.James,S.Keene,et al.An adaptive software reliability prediction approach.Proc.of the 23rd Annual NASA/IEEE Software Engineering Workshop,1998.
Biographies

Qiuying Li was born in 1973.She received her B.S.degree and M.S.degree from Harbin Engineering University in 1996 and 1999,Ph.D.degree from Beihang University in 2004,respectively.She is now working in Beihang University.Her current research interests include software reliability evaluation and software reliability testing.
E-mail:li qiuying@buaa.edu.cn

Haifeng Li was born in 1981.He received his bachelor degree,master degree and Ph.D.degree from Beihang University in 2003,2006 and 2011,respectively.He is now working in Quality Technique Center of China Aero-polytechnology Establishment. His current research interests include software reliability measurement and application.
E-mail:yongxin765@126.com

Minyan Lu was born in 1963.She is now a professor and Ph.D.supervisor of School of Reliability and Systems Engineering in Beihang University. Her current research interests include software reliability engineering and software dependability.
E-mail:lmy@buaa.edu.cn
10.1109/JSEE.2015.00024
Manuscript received May 15,2013.
*Corresponding author.
This work was supported by the Pre-research Foundation of CPLA General Equipment Department.
猜你喜欢
工会博览(2023年1期)2023-02-23
工会博览(2022年16期)2022-02-04
当代水产(2019年3期)2019-05-14
现代养生·下半月(2016年11期)2016-04-12
医学与社会(2015年9期)2015-12-26
中国卫生(2015年10期)2015-11-10
西南军医(2015年4期)2015-01-23
中国卫生(2014年2期)2014-11-12
中国卫生(2014年6期)2014-11-10
中国卫生(2014年5期)2014-11-10
 Journal of Systems Engineering and Electronics2015年1期
- Journal of Systems Engineering and Electronics的其它文章
- Dynamic channel reservation scheme based on priorities in LEO satellite systems
- Adaptive beamforming and phase bias compensation for GNSS receiver
- Novel dual-band antenna for multi-mode GNSS applications
- Nonparametric TOA estimators for low-resolution IR-UWB digital receiver
- Effcient hybrid method for time reversal superresolution imaging
- Adaptive detection in the presence of signal mismatch