
High pressure equation of state for molten CaCO3from frst principles simulations
2015-02-07 09:08•
Acta Geochimica 2015年1期
•
ORIGINAL ARTICLE
High pressure equation of state for molten CaCO3from frst principles simulations
Zhigang Zhang•Zairong Liu
Carbonate melts are important active metasomatic agents and effcient transport agents;their thermodynamic properties at high temperatures and pressures are therefore of considerable interest for various geochemical applications.However,due to the extreme challenges in relevant experiments,current knowledge of even the density of carbonate melts is limited.In this study,we provide high quality volumetric data of CaCO3-melt from frst principles at high temperatures and pressures(up to 3,500 K and 60 GPa).The accuracy of these data is demonstrated through comprehensive comparison with available experimental data and a thorough discussion of the predictability of the re-scaling method proposed in this study.Based on the simulations,an equation of state has been established that is critical to relevant highly disputed questions such as the decomposition and solidifcation boundaries of CaCO3melts,the latter of which is briefy discussed in this study with a newly derived ab initio melting curve to high pressures.
Carbonates·Melts·CaCO3·First principles· Equation of state
1 Introduction
Carbonate melts play important roles in various geochemical processes on the surface and in the interior of Earth(Jones et al.2013).With remarkable features,such as low density and high mobility,carbonate melts are wellknown as active metasomatic agents in the mantle(Green and Wallace 1988).They are also recognized to be effcient transport agents of volatiles and rare earth elements due to the high solubility of these components in carbonate melts (Yang et al.2003).In addition,carbonate melts are thought to be related to low seismic velocity and high electrical conductivity in the asthenosphere(Gaillard et al.2008; Gudfnnsson and Presnall 2005)and to be responsible for the formation of‘‘super-deep’’diamonds(Litvin et al. 2014).Furthermore,shock-induced devolatilization of carbonate melts in Earth’s early history dramatically alter the evolution of the atmosphere and may be the main cause for the Cretaceous–Tertiary extinction(O’Keefe and Ahrens 1989).
Despite the ubiquity and importance of carbonate melts, it is surprising to fnd that people actually know little about their properties at high temperatures and pressures,conditions under which carbonate melts often reside.Most experiments are concentrated around ambient pressure and mainly on alkali carbonate melts,owing to their role as electrolyte materials for fuel cells.Current measurements of carbonate melts are limited to 1,800 K and 5.5 GPa and signifcant discrepancies exist among different research groups,owing to the extreme challenges faced in these experiments(Dobson et al.1996;Liu and Lange 2003).
Calcium-bearing carbonate melts are one of the main components of mantle-derived and highly evolved carbonatite melts(Church and Jones 1995).Nevertheless,as shown in Fig.1,even the phase and stability boundaries of CaCO3-melt remain poorly constrained.There is no consensus on exactly what temperature and pressure CaCO3liquid decomposes and what the products of its decomposition are in extreme conditions(Bobrovsky et al.1976; Litvin et al.2014;Martinez et al.1995).Nor is thereconsensus about the onset of melting of CaCO3solids and whether or not it is congruent(Kerley 1989;Spivak et al. 2011).Related with these,there is no consensus as to the precise boundary of crystalline phases and whether or not meta-stable polymorphs would be stabilized at high temperatures(Merlini et al.2012;Oganov et al.2006;Ono et al.2005,2007).

Fig.1 Phase diagram of CaCO3-system.Points at low temperatures and pressures are determined by Irving and Wyllie(1973)and Huang and Wyllie(1976),respectively,for calcite–aragonite transition and melting
Uncertainty about CaCO3melts and their minerals, some of which are marked in Fig.1,can be ascribed to the complexity of the structure and bonding of carbonates at high pressures(Oganov et al.2013).Different from silicate melts,which are characterized by polymerization and network formation,carbonate melts consist of metal cations and carbonateanions with no defnite association(Jones et al.2013).The C–O bonds are more polarized and readily introduce more energetic local minimums by rotating theanions.This feature of carbonate melts calls for theoretical approaches from frst principles; experimental measurements are extremely diffcult and thermodynamic models with empirical parameters do not generate reliable predictions in regions far beyond the regression regime.For CaCO3-melts,as shown in Fig.1, the calculations by Bobrovsky et al.(1976),Kerley(1989), and Martinez et al.(1995)are thus prone to signifcant error at high pressures and temperatures.
Recently it has become our continuous endeavor to uncover the properties and roles of carbonatite melts in the mantle through frst principles simulations based on predictive quantum mechanical theories.In this study,as an important step,we explore the pressure–volume–temperature(PVT)properties of CaCO3-melts.Closely related to fundamental thermodynamic properties such as free energy and chemical potential,PVT properties are the key to solving the above-mentioned questions.In contrast to the growing database of PVT data for fuids and silicate melts (Zhang and Duan 2005),high pressure PVT data of CaCO3melts are still extremely scarce.As a matter of fact,current knowledge of CaCO3melts is not remarkably better than that generated by studies carried out decades ago(Dobson et al.1996;Genge et al.1995;Liu and Lange 2003).With a generalized re-scaling method to correct the systematic errors in the simulation results(Zhang et al.2013),we present an accurate equation of state(EOS)and,for the frst time,extend the PVT data of CaCO3-melts to at least 3,500 K and 60 GPa,rectifying the high pressure melting curve based on this EOS and that of the coexisting aragonite.Finally,we briefy discuss the implications of the results of this study.
2 Theory
2.1 Computational details
First principles simulations were carried out with Vienna ab initio simulation package(Kresse and Furthmuller 1996)using the projector-augmented-wave method(Kresse and Joubert 1999).We focused on the local density approximation(LDA)in most simulations and will show below that the results in this study will be essentially independent from the choices of exchange–correlation functional.Limited simulations with the PBE form of generalized gradient approximation(GGA;Perdew et al. 1996)have been performed for the purpose of comparison. The core radii are 2.3 atomic units(a.u.)for calcium(with a neon core),1.5 a.u.for carbon(with a helium core),and 1.52 a.u.for oxygen(with a helium core).
We computed the thermodynamic and dynamical properties of molten CaCO3with extensive molecular dynamics (MD)simulations.At each time step(1 fs interval),the electronic structure was calculated at the Brillouin zone center with an energy cutoff of 500 eV and iteration convergence criterion of 10-6eV.The thermal equilibrium between ions and electrons is assumed via the Mermin functional(1965).MD trajectories were propagated in the NVT ensemble with the Nose´thermostat(1984)for 7 ps, with the frst 3 ps discarded as pre-equilibrium.Uncertainties in directly simulated quantities are determined using appropriate non-Gaussian statistics via the blocking method(Flyvbjerg and Petersen 1989).The primary cell is cubic with 160 atoms(32 formula units).The initial confgurations were prepared through melting the 2×2×2 aragonite supercells by increasing the temperature and homogeneously straining the cell to a cubic shape.Simulation results for most properties were found to be unchanged within statistical uncertainties in larger systems (240 atoms)and durations twice as long.
We have not applied the quantum corrections for high temperature MD simulation results since the temperatures (>900 K)are much higher than the Debye temperature (<500 K for aragonite)and quantum effects should be negligibly small(Kerley 1989).On the other hand,in order to have accurate comparisons with experimental measurements at ambient conditions for crystals,as described in the next section,we counted the effects of zero-point vibrations by computing the phonon frequencies through the small displacement method with the aid of Phonopy(Togo et al.2008).In these calculations,we relaxed the ionic structures with high precision(energy cutoff increased to 1,000 eV,iteration convergence criterion decreased to 10-8eV)and dense k-point mesh (5×3×4 and 6×5×6 for aragonite and post-aragonite,respectively). We used a 2×2×2 supercell in calculating the force constant matrix by confrming its convergence for thermodynamic properties.Non-analytical-term corrections have been applied for longitudinal-transverse optical phonon frequency splitting in the limit of small wave-vector (Wang et al.2010).
2.2 Systematic errors and corrections
Practical density functional theory(DFT)calculations rely on an approximation to the exchange–correlation functional.The two most widely used approximations:LDA and GGA,yield different predictions for quantities such as EOS.The main idea of a posteriori corrections to LDA and GGA is based on the observations that the correction to the energy should depend only on volume(van de Walle and Ceder 1999).A constant shift in pressure,named as the constant-shifting method hereafter,actually assumes the simplest possible volume-dependent form of correction to energy,i.e.,linear with volume.Although popular for its simplicity,this method has been found to be insuffcient to bring LDA and GGA predictions into agreement over a wide range of pressure.As discussed in Zhang et al.(2013), the alternative re-scaling method,achieved by counting the volumetric dependence of corrections in pressure,shows its superiority with high accuracy over the constant-shifting method.
A thermodynamic self-consistent derivation for the rescaling method can be found in Zhang et al.(2013).We only briefy summarize here the formula involved in this study.In the mean time,by noticing that the corrections should be equivalent for the same stoichiometric system,as also argued by van de Walle and Ceder(1999),we further slightly generalize this method for situations beyond single phase.
The fundamental relation of the re-scaling method lies in the correction to the Helmholtz free energy:
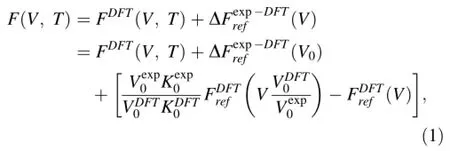
where subscript 0 refers to properties at zero pressure and an arbitrary reference temperature,K is the isothermal bulk modulus,andisthedisplacementofbasefreeenergyforthesakeof re-scaling and can be neglected since relative(rather than absolute)free energy is concerned.Free energies with subscript ref represent those of a reference phase.When the reference temperature is selected as athermal(static)and focusingonasinglephase,Eq.(1)isexactlythatproposedin Zhang et al.(2013).The re-arrangement and slight generalization of Eq.(1)make it convenient to correct results for phases with few or even no experimental data since we can choose an alternative more familiar phase with the same stoichiometry as the reference phase.We will show in the next section that this generalization for CaCO3-systems, though more or less empirical,is satisfactory for rendering DFT predictions independent of the form of the exchange–correlation functional and for agreeing with existing experimental measurements.
From the thermodynamic identitywe fnd from Eq.(1)
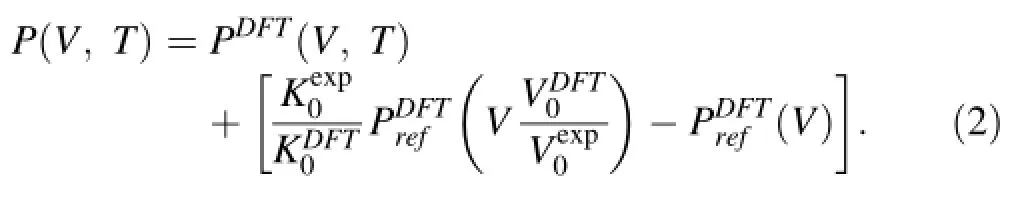
The constant-shifting method has also been applied to limited results to compare its performance with the abovementioned re-scaling method.The correction to pressure reads
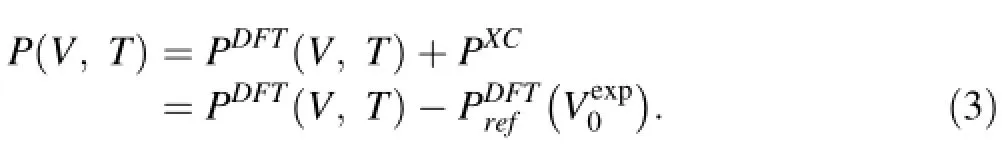
The choices of parameters in these formulas are described in the caption of Fig.4 in the next section.
3 Results and discussions
3.1 Structure
Finite sized MD simulations explore the phase space with constrained time and space scales.This somewhat hinders a quick downhill convergence to the global minimum,corresponding to the most stable phase,but on the other hand facilitates sampling meta-stable phase space and extends important information smoothly beyond the stable phases.When the energy barriers between local minima are appropriate,phase transitions or chemical reactions can be observed in the MD trajectories.As for the simulation of CaCO3-melts,we should ensure that in our sampling,(1) the melt has not crystallized at suffciently low temperatures,and(2)thehas not completely decomposed into separate ions at suffciently high temperatures.By inspecting the radial distribution function and the mean square displacement,we fnd the super-cooled CaCO3-melt can be well sampled even deep within the solid phase regime(at least to 1,500 K and 50 GPa).The monitoring of decomposition is more ambiguous since the structure of CaCO3-melt varies continuously over the temperatures and pressures.A frst order inspection can be derived from the density of states,which is defned as the Fourier transformation of the velocity auto-correlation function(Allen and Tildesley 1987).As shown in Fig.2,the crystalline phase of CaCO3(aragonite here)shows clear features in the high frequency region(>500 cm-1),which corresponds to that of normal modes of the carbonate group(Ni and Keppler 2013).The melting of the solid greatly destroys these features as revealed by the noticeable fattened spectra of super-cooled melt at the same temperature and volume. Increasing the temperature further blurs the characteristic peaks of frequency and at the temperature of 4,000–5,000 K it becomes essentially featureless.Therefore in the following discussions,we have not included the results at 4,000–5,000 K in order to eliminate any possible negative infuence on the accuracy of EOS proposed in this study.We noticed that this approximate choice of temperature upper limit is consistent with a recent experiment, which demonstrates congruent melting of CaCO3at 3,500 K and 10–22 GPa(Spivak et al.2011).
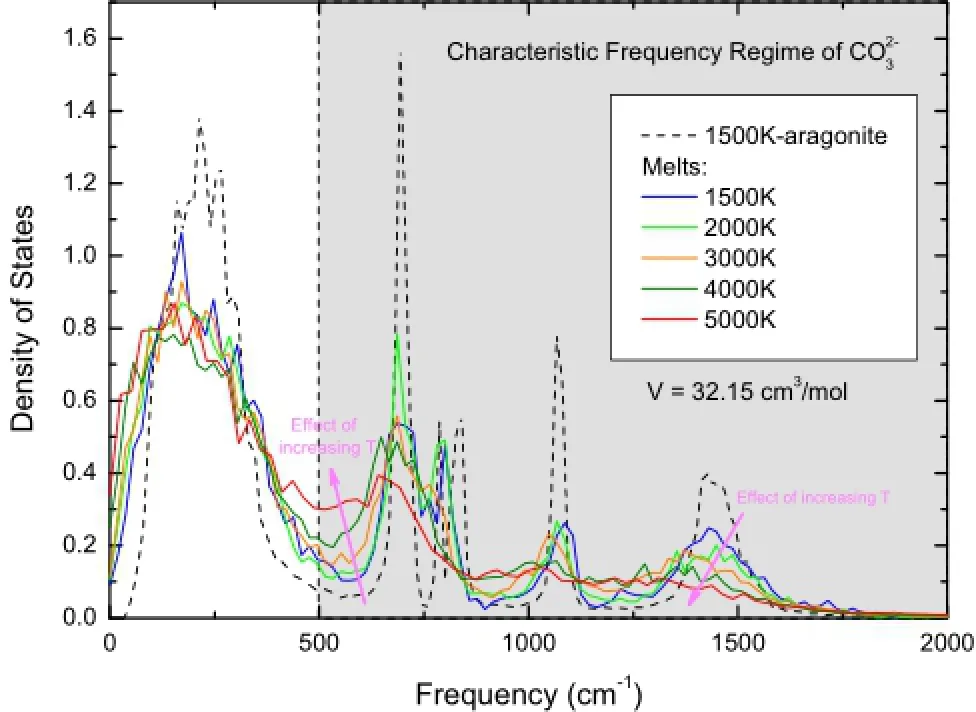
Fig.2 Density of states(through Fourier transformation of velocity auto-correlation functions)of CaCO3-melts at various temperatures with a volume of 32.15 cm3/mol.Shaded area represents the characteristic high frequency regime of carbonate anion.Aragonite at 1,500 K is included for comparison
It is interesting to inspect more closely the equilibrated melt structure over varying temperatures and pressures.As shown in Fig.3,we fnd signifcant effects on the local coordination environment from compressions,especially for Ca–O coordination.Over the pressures involved in this study,the structure varies continuously from calcite-like to post-aragonite-like,with Ca–O coordination increased from~6.7 to~10.3.This is inconsistent with that of the early classical simulations with force feld by Genge et al. (1995),which fnds a consistent similarity to calcite and may imply inaccuracy of their force feld at high pressures. Variations of C–O coordination over pressure reveal subtle effects of compression on the carbonate groups.In Fig.3a, we fnd the averaged C–O coordination number is generally equal to or slightly smaller than 3 except at extremehigh pressures.As shown in Fig.3b,although the threefold C–O coordination dominates throughout the compression, the lower-than-threefold coordination(twofold or even onefold coordination at the lowest pressures inspected) always appears with 5–20%.This feature is consistent with that proposed by Williams and Knittle(2003),who argued from their Raman spectroscopy that at least two anionic bonding environments exist in carbonate liquids with one carbonate-like bonding and the other singlebonded C–O units.At high pressures,the fourfold coordination gradually increases and the liquid structure is much more densely packed than solid phases,which only demonstratetetrahedral structures in the pyroxene-type phase with a pressure over 130 GPa(Oganov et al.2006).
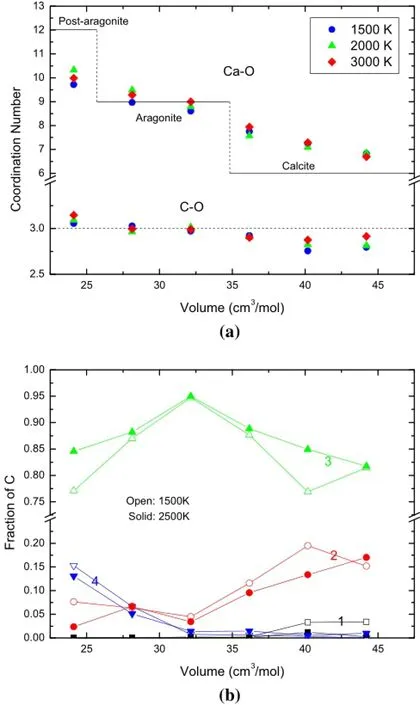
Fig.3 a Ca–O and C–O coordination number at 1500,2000,and 3000 K.The Ca–O coordination number of the crystalline phases with their approximate range of stability is shown for comparison. b Distribution of C–O coordination environments in CaCO3melts at 1,500 K(open symbols)and 2,500 K(solid symbols).Numbers denote the coordinated number of oxygen atoms around carbon
3.2 Corrections to the systematic DFT errors
We choose aragonite at 300 K as the reference phase and temperature for our re-scaling and also constant-shifting corrections,since we can fnd much more experimental data to show the accuracy of our corrections.Results for post-aragonite are included for comparison and to confrm our generalization of the re-scaling method proposed in this study for situations beyond the reference phase.
As shown in Fig.4a,the predictions of LDA and GGA deviate from the experimental pressure by 3–7 GPa.LDA underestimates while GGA overestimates the pressures by similar amounts,which is in contrast to the comparisons for silicates,for which experimental pressures are much closer to LDA predictions(Zhang et al.2013).The constantshifting method is obviously inadequate to correct the deviations:even at modest pressure,the shifted GGA is larger than that of LDA by over 5 GPa.
In the inset plot of Fig.4a and in Fig.4b,we show the accuracies of the re-scaling method generalized in this study toahightemperatureandadifferentphase,respectively.The corrections are unexpectedly extremely successful,with an almost exact match between re-scaled LDA and GGA predictions and perfect agreement with the available experimental data.The re-scaling method is demonstrated to be superior to the constant-shifting method with its high accuracy and independence of exchange–correlation functional, which isthe major uncertainty inDFTsimulations.Allthese comparisons convince us that we can also accurately predict PVT properties of CaCO3-melt with a similar approach,as discussed in the following section.
3.3 EOS for CaCO3-melt
After the re-scaling correction to the simulated results of melts,we established the EOS for CaCO3-melt with the Mie–Gruneisen equation:
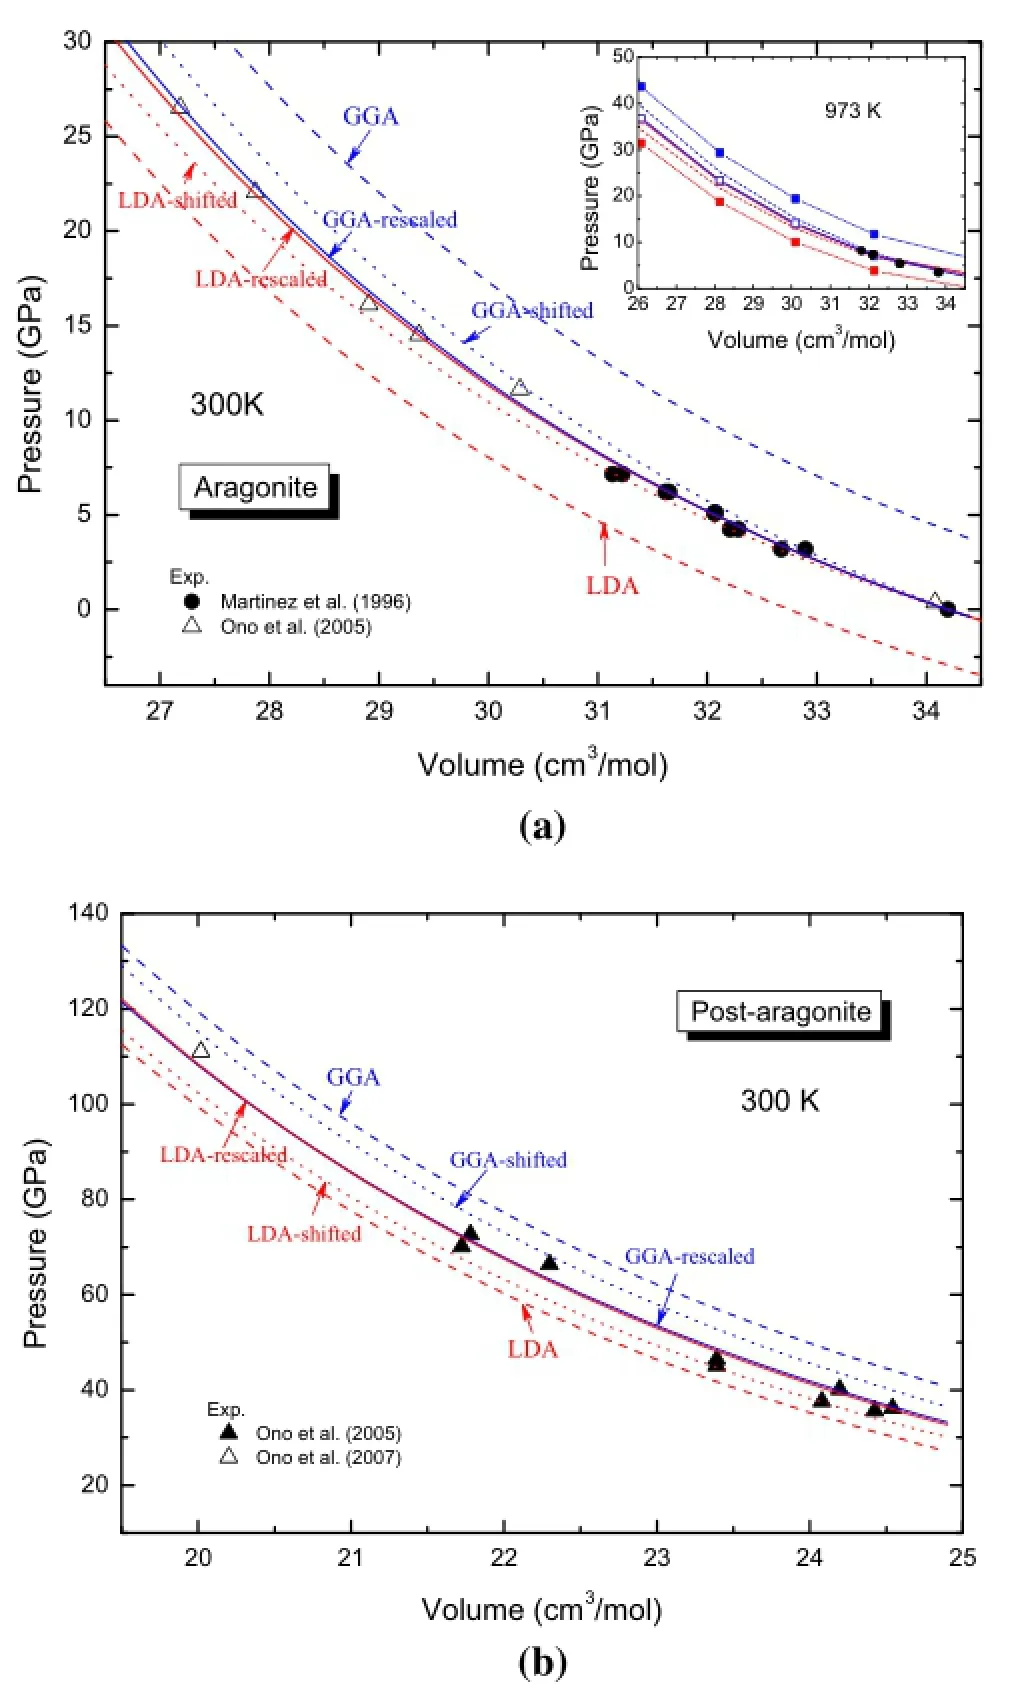
Fig.4 High accuracy of the re-scaling method proposed in this study as revealed by comparison with experiments,and the predictions with the constant-shifting method for aragonite and post-aragonite.The parameters forthe re-scaling are:and(from those reported by Ono et al.2005 for aragonite); GPa;For constant-pressure shifting,
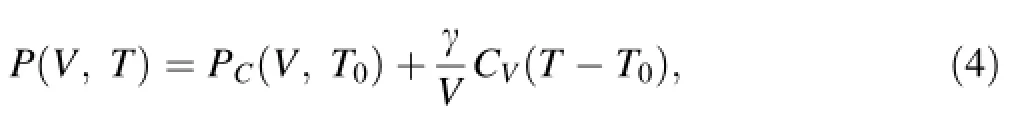
where PCis the reference isotherm at T0=1,500 K that can be accurately reproduced with a third-order Eulerian fnite strain equation(known as Birch–Murnaghan equation),γ is the Gruneisen parameter which we simplify to be linear with V by γ=γa+γb*(V-V0)/40.1873,and CVis the isochoric heat capacity.
The parameters for this EOS are determined from linear least-square ftting and listed in Table 1.As shown in Fig.5,the equation reproduces all the simulation resultsquite well,including PVT properties(errors within 1 GPa) and energetic properties(errors within 1%).
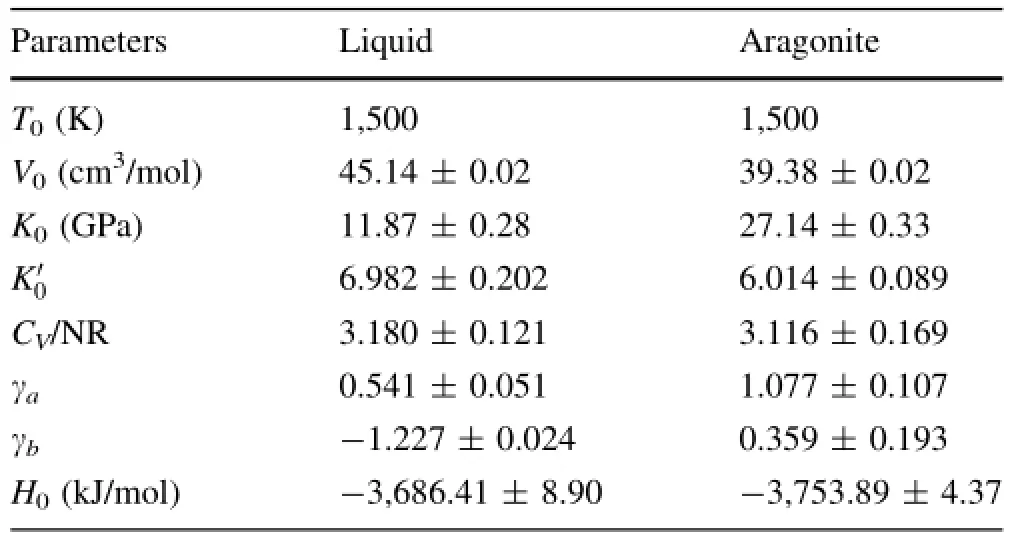
Table 1 Parameters for the equation of state(Eq.(4))for molten CaCO3and aragonite at high temperatures and pressures
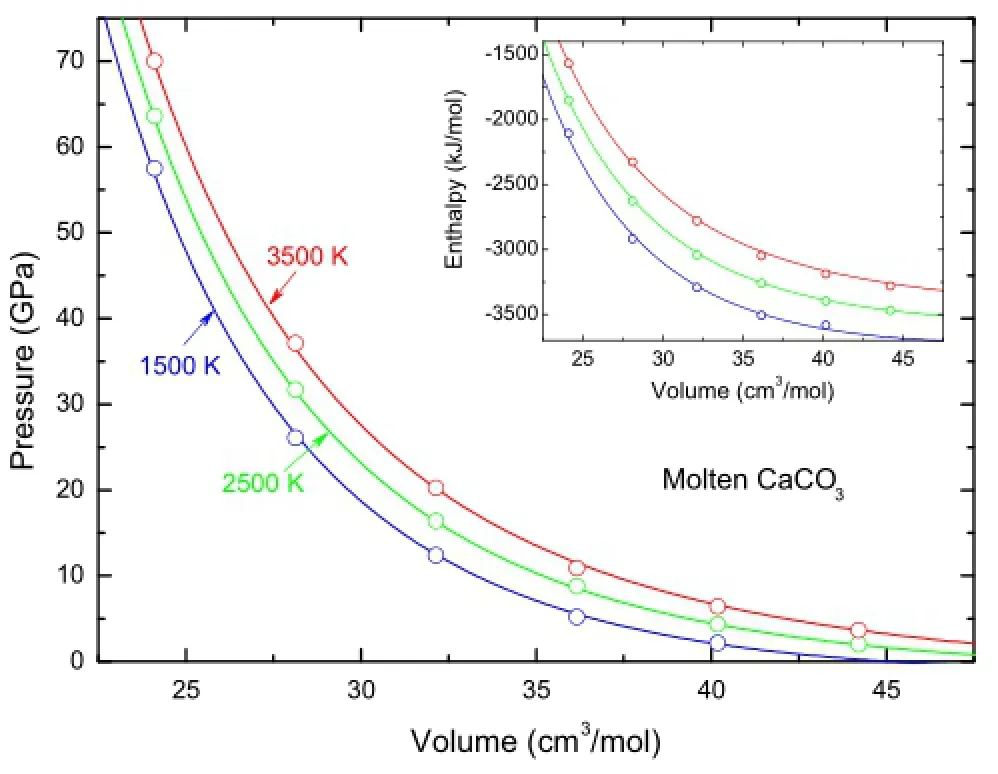
Fig.5 Equation of state for CaCO3melts.The simulated and corrected pressures and enthalpies(inset)at 1,500,2,500,and 3,500 K are shown as circles with uncertainties smaller than the size of the symbols.The lines are Mie–Gruneisen equation of state (Eq.(4))ftted to the simulation results with parameters listed in Table 1
In Fig.6,we show the predictability of this EOS by comparing it with experimental measurements.Although we can only fnd very limited experimental data about calcium-bearing carbonate melts relevant to this study (>1,500 K),some in-depth analyses may provide important information to assess the accuracy of this study.First,as argued by Liu and Lange(2003),carbonate components mix ideally,i.e.,the volumes of carbonate liquids vary linearly with respect to the end-members.Secondly, although some systematic deviations exist between the measured densities of K2Ca(CO3)2melt by Liu and Lange (2003)and those by Dobson et al.(1996)at lower temperatures,we fnd they reach agreement at 1,750 K with a density of~1.82 g/cm3.Then with the well-determined density of K2CO3melt at 1,750 K(1.67 g/cm3),we get the extrapolated density of CaCO3melt to be 2.15 g/cm3at ambient pressure and 1,750 K,which agrees with the prediction of our EOS in this study.In contrast,the predictions by classical MD simulations of Genge et al.(1995) systematically underestimate the densities overthe pressures.
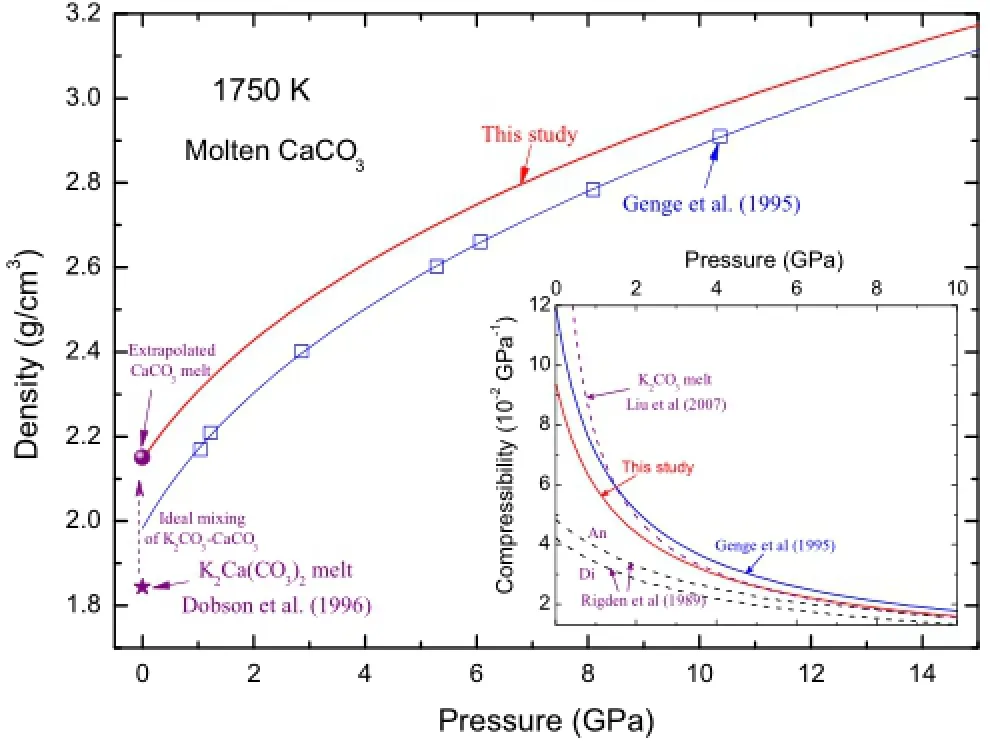
Fig.6 Density and isothermal compressibility of CaCO3-melts at 1,750 K from different studies.Blue lines and open squares are those simulated by Genge et al.(1995)with empirical force feld. Experimental measurement of K2Ca(CO3)2melt by Dobson et al. (1996)is shown a with purple star at the bottom-left corner of the plot.Assuming ideal mixing and utilizing density of K2CO3determined by Liu and Lange(2003)at the same temperature and pressure,we get the density of CaCO3melt indicated by the flled purple circle.In the inset plot,we include the compressibility of K2CO3-melt determined by Liu et al.(2007),and those of anorthite (CaAl2Si2O8)and diopside(CaMgSi2O6)melts measured by Rigden et al.(1989)for comparisons
In the inset plot of Fig.6,we computed the isothermal compressibility[defned as β=1/KT=-(dV/dP)T/V]of CaCO3melt at 1,750 K.The results from this study are slightly smaller than those calculated by Genge et al. (1995).At low pressures,similar to K2CO3(Liu et al. 2007),CaCO3melt can be more signifcantly compressed as compared with typical silicate melts such as anorthite (CaAl2Si2O8)and diopside(CaMgSi2O6)melts(Rigden et al.1989).With the increase of pressure to 10 GPa,the compressibility of carbonate melts rapidly decreases and all these melts interestingly show a similar magnitude of compressibility around 0.015 GPa-1.
3.4 Applications and implications
视高考如生命的北方人,早在那个年月里就变态地迫切追求升学率了。我初中时便有晚课,分两个班,一个叫补差,一个叫培优,月考分数排名靠前去培优,靠后则去补差。我和朋友的功课都属于中不溜阵营,上下随便一波动就波动去了隔壁班,两人一会儿培优一会儿补差,好不热闹。
The accurate EOS determined in this study has important applications related to calcium-bearing carbonatite melts. We only briefy introduce one as follows for the onset of melting CaCO3solids.For this purpose,we also calculated the EOS of CaCO3–aragonite with the same approach mentioned above.The parameters of the aragonite arelisted in Table 1.We can predict the melting curve of CaCO3by integrating the Clausius–Clapeyron equation:

Before the integration,we selected a converged experimental melting point at about 1,968 K and 5.5 GPa(Huang and Wyllie 1976;Suito et al.2001).It should be noted that this point lies beyond calcite phase as revealed in Fig.1 and mentioned by Irving and Wyllie(1973)and I-vanov and Deutsch(2002).From this fxed point and Eq.(4),we produced the melting curve of CaCO3over wide pressures in Fig.7,which is the frst curve from frst principles,as far as we know.Compared with the early prediction by Kerley(1989),which has often been cited as the only melting curve before this study,we believe our results should be much more accurate for the reasons discussed above.
Based on the new derived melting curve,almost the whole bulk mantle falls into the solid regime of the CaCO3phase diagram,which implies that the calcium-dominant carbonate systems would not be melted over the entire mantle.To fuel the CaCO3minerals,extremely high heat fow is needed,which is often unlikely according to analysis of the global records(Pollack et al.1993).The other possibility,which is more reasonable,would be eutectic melting through mixing with other components that have much lower melting temperatures.K2CO3,as an example, would be a good candidate to achieve the melting of CaCO3.Again,assumingidealmixing ofthetwo components,since the fusion curve of K2CO3approaches the geotherm(Liu et al.2007),we expect the carbonatite melts in the mantle should contain more alkali-bearing components than CaCO3.
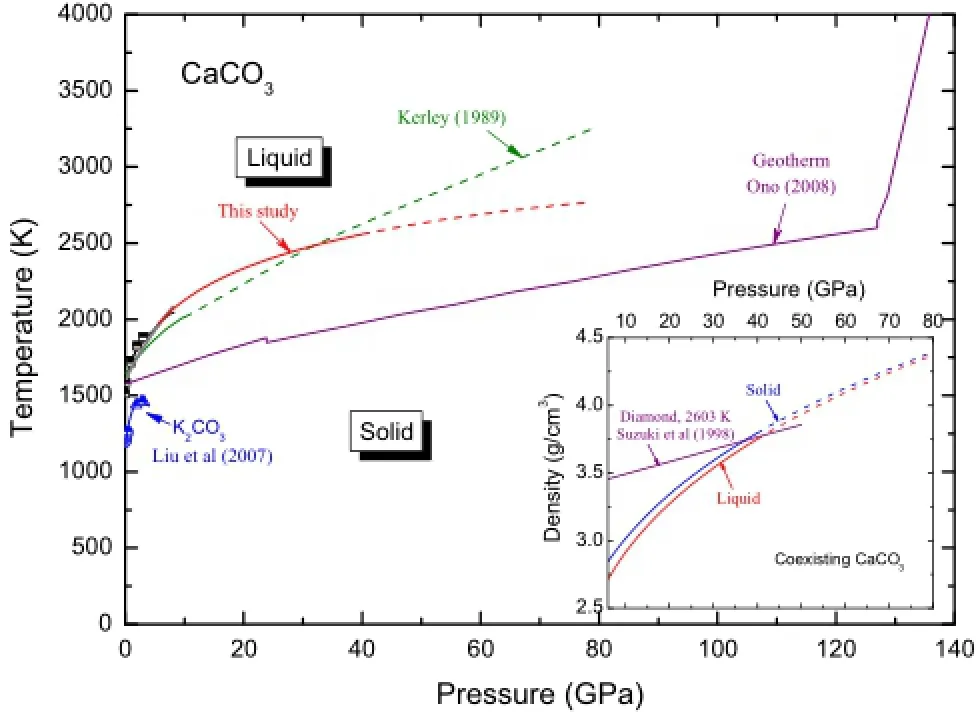
Fig.7 Melting curve predicted in this study and those by experimental measurements(Huang and Wyllie 1976;Suito et al.2001)and by thermodynamic model of Kerley(1989).Melting data of K2CO3by Liu et al.(2007)and Klement and Cohen(1975)are shown on the left-bottom of the diagram.Temperature profle over the mantle is picked from Ono(2008).In the inset plot,we compare the density of the coexisting solid and liquid densities and the density of diamond at 2,603 K(Suzuki et al.1998)is included for comparison
On the other hand,as shown in Fig.7,it is possible that the melting curve of CaCO3meets with the geotherm at two points.In addition,as revealed in the inset plot of Fig.7,we fnd the densities of CaCO3phases(liquid or solid)become even larger than that of diamond and the density contrast between the coexisting solid and liquid reduces signifcantly with increasing pressure.Oganov et al.(2008),by comparing the enthalpy change of relevant reactions,proposed that CaCO3becomes more prevalent in the lowermost part of the mantle.Combining all these factors,the most interesting speculation here is that we may fnd almost pure CaCO3-melt at the base of the mantle.Of course,we should be aware that the unexplored phases(e.g.,post-aragonite and pyroxene-type phase,as shown in Fig.1)may(or may not)remarkably change the plausible extrapolation of the melting curve at high pressures(>40 GPa).
4 Conclusions
In this study,we present PVT properties of CaCO3-melt at high temperatures and pressures(up to 3,500 K and 60 GPa)through extensive frst principles simulations.To improve the accuracy and reliability of our predictions as much as possible,we carefully inspect the structures of melts to ensure proper sampling of the MD trajectories and comprehensively correct the systematic errors in the simulation results.Based on these efforts,we propose a high quality EOS for CaCO3-melt at high pressures.From this equation,along with that of CaCO3–aragonite,a melting curve has been obtained by integrating the Clausius–Clapeyron equation from frst principles for the frst time and plausibly implies the existence of CaCO3-melt at the base of the mantle.
AcknowledgmentsWe acknowledge the funds from the key programs(#90914010 and#41020134003)granted by National Natural Science Foundation of China.All the simulations were carried out on the computational facilities in the Computer Simulation Lab of IGGCAS.
Allen MP,Tildesley DJ(1987)Computer simulation of liquids. Clarendon Press,Oxford
Church AA,Jones AP(1995)Silicate–carbonate immiscibility at Oldoinyo-Lengai.J Petrol 36:869–889
Dobson DP,Jones AP,Rabe R,Sekine T,Kurita K,Taniguchi T, Kondo T,Kato T,Shimomura O,Urakawa S(1996)In-situ measurement of viscosity and density of carbonate melts at high pressure.Earth Planet Sci Lett 143:207–215
Flyvbjerg H,Petersen HG(1989)Error-estimates on averages of correlated data.J Chem Phys 91:461–466
Gaillard F,Malki M,Iacono-Marziano G,Pichavant M,Scaillet B (2008)Carbonatite melts and electrical conductivity in the asthenosphere.Science 322:1363–1365
Genge MJ,Price GD,Jones AP(1995)Molecular-dynamics simulations of CaCO3melts to mantle pressures and temperatures—implications for carbonatite magmas.Earth Planet Sci Lett 131:225–238
Green DH,Wallace ME(1988)Mantle metasomatism by ephemeral carbonatite melts.Nature 336:459–462
Gudfnnsson GH,Presnall DC(2005)Continuous gradations among primary carbonatitic,kimberlitic,melilititic,basaltic,picritic, and komatiitic melts in equilibrium with garnet lherzolite at 3–8 GPa.J Petrol 46:1645–1659
Huang W-L,Wyllie PJ(1976)Melting relationships in the systems CaO–CO2and MgO–CO2to 33 kilobars.Geochim Cosmochim Acta 40:129–132
Irving AJ,Wyllie PJ(1973)Melting relationships in CaO–CO2and MgO–CO2to 36 kilobars with comments on CO2in the mantle. Earth Planet Sci Lett 20:220–225
Ivanov BA,Deutsch A(2002)The phase diagram of CaCO(3)in relation to shock compression and decomposition.Phys Earth Planet Inter 129:131–143
Jones AP,Genge M,Carmody L(2013)Carbonate melts and carbonatites.Carbon Earth 75:289–322
Kerley GI(1989)Equations of state for calcite minerals.I.Theoretical model for dry calcium carbonate.High Press Res 2:29–47
Klement W,Cohen LH(1975)Solid–solid and solid–liquid transitions in K2CO3,Na2CO3and Li2CO3—investigations to greater than-5 kbar by differential thermal-analysis—thermodynamics and structuralcorrelations.Ber Bunsenges Phys Chem 79:327–334
Kresse G,Furthmuller J(1996)Effcient iterative schemes for ab initio total-energy calculations using a plane-wave basis set. Phys Rev B 54:11169–11186
Kresse G,Joubert D(1999)From ultrasoft pseudopotentials to the projector augmented-wave method.Phys Rev B 59:1758–1775
Litvin Y,Spivak A,Solopova N,Dubrovinsky L(2014)On origin of lower-mantle diamonds and their primary inclusions.Phys Earth Planet Inter 228:176–185
Liu Q,Lange RA(2003)New density measurements on carbonate liquids and the partial molar volume of the CaCO3component. Contrib Mineral Petrol 146:370–381
Liu Q,Tenner TJ,Lange RA(2007)Do carbonate liquids become denser than silicate liquids at pressure?Constraints from the fusion curve of K2CO3to 3.2 GPa.Contrib Mineral Petrol 153:55–66
Martinez I,Deutsch A,Scharer U,Ildefonse P,Guyot F,Agrinier P (1995)Shock recovery experiments on dolomite and thermodynamical calculations of impact-induced decarbonation.J Geophys Res Solid Earth 100:15465–15476
Merlini M,Hanfand M,Crichton WA(2012)CaCO3-III and CaCO3-VI,high-pressure polymorphs of calcite:possible host structures for carbon in the Earth’s mantle.Earth Planet Sci Lett 333:265–271
Mermin ND(1965)Thermal properties of inhomogeneous electron gas.Phys Rev 137:1441
Ni HW,Keppler H(2013)Carbon in silicate melts.Rev Mineral Geochem 75:251–287
Nose´S(1984)A molecular-dynamics method for simulations in the canonical ensemble.Mol Phys 52:255–268
O’Keefe JD,Ahrens TJ(1989)Impact production of CO2by the Cretaceous/Tertiary extinction bolide and the resultant heating of the Earth.Nature 338:247–249
Oganov AR,Glass CW,Ono S(2006)High-pressure phases of CaCO3:crystal structure prediction and experiment.Earth Planet Sci Lett 241:95–103
Oganov AR,Ono S,Ma YM,Glass CW,Garcia A(2008)Novel highpressure structures of MgCO3,CaCO3and CO2and their role in Earth’s lower mantle.Earth Planet Sci Lett 273:38–47
Oganov AR,Hemley RJ,Hazen RM,Jones AP(2013)Structure, bonding,and mineralogy of carbon at extreme conditions. Carbon Earth 75:47–77
Ono S(2008)Experimental constraints on the temperature profle in the lower mantle.Phys Earth Planet Inter 170:267–273
Ono S,Kikegawa T,Ohishi Y,Tsuchiya J(2005)Post-aragonite phase transformation in CaCO3at 40 GPa.Am Mineral 90:667–671
Ono S,Kikegawa T,Ohishi Y(2007)High-pressure transition of CaCO3.Am Mineral 92:1246–1249
Perdew JP,Burke K,Ernzerhof M(1996)Generalized gradient approximation made simple.Phys Rev Lett 77:3865–3868
Pollack HN,Hurter SJ,Johnson JR(1993)Heat fow from the Earth’s interior:analysisofthe globaldata set.Rev Geophys 31:267–280
Rigden SM,Ahrens TJ,Stolper EM(1989)High-pressure equation of state of molten anorthite and diopside.J Geophys Res Solid Earth 94:9508–9522
Spivak AV,Dubrovinskii LS,Litvin YA(2011)Congruent melting of calcium carbonate in a static experiment at 3500 K and 10–22 GPa:its role in the genesis of ultradeep diamonds.Dokl Earth Sci 439:1171–1174
Suito K,Namba J,Horikawa T,Taniguchi Y,Sakurai N,Kobayashi M,Onodera A,Shimomura O,Kikegawa T(2001)Phase relations of CaCO3at high pressure and high temperature.Am Mineral 86:997–1002
Suzuki A,Ohtani E,Kato T(1998)Density and thermal expansion of a peridotite melt at high pressure.Phys Earth Planet Inter 107:53–61
Togo A,Oba F,Tanaka I(2008)First-principles calculations of the ferroelastic transition between rutile-type and CaCl(2)-type SiO(2)at high pressures.Phys Rev B 78:134106
van de Walle A,Ceder G(1999)Correcting overbinding in localdensity-approximation calculations.Phys Rev B 59:14992–15001
Wang Y,Wang JJ,Wang WY,Mei ZG,Shang SL,Chen LQ,Liu ZK (2010)A mixed-space approach to frst-principles calculations of phonon frequencies for polar materials.J Phys Condens Matter 22:202201
Williams Q,Knittle E(2003)Structural complexity in carbonatite liquid at high pressures.Geophys Res Lett 30:1022.doi:10.1029/ 2001GL013876
Yang XM,Yang XY,Zheng YF,Le Bas M(2003)A rare earth element-rich carbonatite dyke at Bayan Obo,Inner Mongolia, North China.Mineral Petrol 78:93–110
Zhang ZG,Duan ZH(2005)Prediction of the PVT properties of water over wide range of temperatures and pressures from molecular dynamics simulation.Phys Earth Planet Inter 149:335–354
Zhang ZG,Stixrude L,Brodholt J(2013)Elastic properties of MgSiO3-perovskite under lower mantle conditions and the composition of the deep Earth.Earth Planet Sci Lett 379:1–12
Received:5 January 2015/Revised:12 January 2015/Accepted:12 January 2015/Published online:31 January 2015 ©Science Press,Institute of Geochemistry,CAS and Springer-Verlag Berlin Heidelberg 2015
Z.Zhang(✉)·Z.Liu
Key Laboratory of Earth and Planetary Physics,Institute of Geology and Geophysics,Chinese Academy of Sciences, Beijing 100029,China
e-mail:zgzhang@mail.iggcas.ac.cn
猜你喜欢
当代水产(2021年5期)2021-07-21
科普童话·百科探秘(2020年3期)2020-05-11
启迪与智慧·下旬刊(2019年9期)2019-01-19
财讯(2018年6期)2018-05-14
考试周刊(2017年82期)2018-01-30
新课程·小学(2017年11期)2018-01-13
课程教育研究·下(2016年6期)2016-07-20
河南教育·基教版(2009年3期)2009-04-01
祝您健康(1991年1期)1991-12-30
中国青年(1981年21期)1981-08-20
- Acta Geochimica的其它文章
- Coupled alkali feldspar dissolution and secondary mineral precipitation in batch systems:5.Results of K-feldspar hydrolysis experiments
- Carbon–oxygen isotopic covariations of calcite from Langdu skarn copper deposit,China:implications for sulfde precipitation
- The O and H isotope characteristics of water from major rivers in China
- Spatial and temporal water quality characteristics of Poyang Lake Migratory Bird Sanctuary in China
- Some aspects of excellent marine source rock formation: implications on enrichment regularity of organic matter in continental margin basins
- Preparation of Mn3O4from low-grade rhodochrosite ore by chemical bath deposition method