
Research of the Visualization Temperature Field of the Communication Room Based on the Reconstruction of Three-dimensional Temperature Field
2015-02-20 05:04LIUXiaoyangYUYangSUNChengwei
沈阳理工大学学报 2015年2期
LIU Xiaoyang,YU Yang,SUN Chengwei
(Shenyang Ligong University,Shenyang 110159,China)
Research of the Visualization Temperature Field of the Communication Room Based on the Reconstruction of Three-dimensional Temperature Field
LIU Xiaoyang,YU Yang,SUN Chengwei
(Shenyang Ligong University,Shenyang 110159,China)
Whether the temperature of the communication room is high or not is the precondition of the fact that the servers in the cabinets work normally.The traditional method to control temperature is “equilibrium refrigeration”,which is high energy consumption and low efficiency.In order to solve such problems,the visualization system of the three-dimensional temperature field of the communication room based on calculation of the reconstruction of the three-dimensional temperature field by collecting the temperatures of the discrete points and on using specific data fitting algorithm is presented.The system uses Direct3D graphics library and designs under the frame of VB.NET,which could monitor the temperature of the communication room in real time and provide visual basis for the effective thermal management in the communication room.
communication room;numerical fitting;temperature field;visualization;Direct3D
The communication room is the center to store and exchange data.With the rapid development of communication industry and the promotion of the business,some communication rooms need to append equipments to store and exchange data constantly.Different heat losses are generated by operating equipments with different powers.The phenomenon causes the difference of the temperature distribution of the communication room,which is named as a heat island with high temperature.The vast majority of the traditional construction and management of the communication room are arranged simply without end-to-end integration solution,in which all cabinets use equilibrium refrigeration without automation management or intelligent platform one.This causes such phenomenon that the hot area with high power density is refrigerated inadequately and the low one with low power density wastes much cold air,which leads to the disadvantage with high energy consumption and low efficiency directly.
It is mainly to use the software for hydrodynamic calculation and to collect the data in the field to build the model in order to simulate the temperature field of the communication room.This could provide some basis for the design and energy saving of communication room,but the model built is short of intuition without a good man-machine interaction and it is difficult to monitor the change of the temperature of the operating communication room in real time.In order to further research the temperature,the paper uses Visual Reality technology to research the temperature field based on the reconstruction of the temperature field of the communication room,which is the visualization system of the temperature field of the communication room.
With the basic characteristics of immersion,interaction and imagination,Virtual Reality technology (Virtual Reality)[1]makes full use of computer graphics,simulation technology and multi-sensor technology to provide a real-time and three-dimensional virtual environment[2],which is realistic and vivid.
1 Introduction to Direct3D
Direct3D is the most popular programming interface of 3D graphics,of which the structure is designed based on the object of COM.Essentially,the 3D-effect display function is encapsulated to a set which is provided to the applications in the form of COM.When the Direct3D interface is called,the accessing mechanism of the COM must be followed by the applications which could not access the Direct3D interface object directly.The Direct3D interface object is a function set which could be called by the program.When the function set is called,the applications must access the interface pointer of the Direct3D object to execute the Direct3D interface object.Direct3D has a powerful function named graphics rendering of which the flow chart includes two lines for image processing.One is for the fixed functions (the fixed pattern process provided by the software) and the other is for the programmability (the program written by the user when necessary).At each stage,data pretreatment,vertex processing,graphics processing and pixel processing are executed in the two lines to complete geometric transformation,vertex processing and light treatment and so on for the model.
2 Visualization temperature field of communication room
Visualization temperature field of the communication room is based on the reconstruction of temperature field[3].The overall design is shown in figure 1.

Figure 1 The overall design of visualization temperature
The overall design includes data collecting from the temperature field,data fitting and reducing display.Data fitting[4]is complex and takes long time.Firstly,the discrete data is read from the database which stores the data collected from temperature sensors.Secondly,the reconstruction of the temperature field is calculated by the data fitting program.Then,the three-dimensional data are transformed from the data from temperature field and are displayed in the three-dimensional scene of the communication room.This is visualization temperature field of the communication room based on the reconstruction of the temperature field.
2.1 Data collecting and Fitting
The huge data of temperature field of the communication room are unrealistic to finish collecting continuously and those of the relative three-dimensional temperature field are large and irregular.The temperatures of the communication room are mainly from the operating equipments in the cabinets,so the temperatures collected are concentrated in the cabinets.The data from the temperature sensors are transported through RS485 and then communicate with the PC through RS232,which is the data collecting.After this,the real-time data are processed and stored.SQL2000 is widely used to store the data.The inspection storage module and the system configuration module are need to complete collection and storage.The former is used to communicate between PC and peripheral circuits.The latter is used to configure the parameters of the serial port and to refresh or store the port and baud rate of the communication.The flow chart of data collecting by PC is shown in figure 2.

Figure 2 The flow chart of data collecting
The data of the temperature field of the communication room are collected from the discrete test-points,the majority of which are limited、discrete and irregularly distributed.The actual data are continuous.In this paper,multi-point interval measurement is adopted and different height of the cabinet is measured.The aim to measure the temperature is to test the accuracy of the physical model established and the simulated calculation of the temperature,in order to establish the approximate temperature distribution of the cabinet.The detecting equipment uses six points to collect data[3]to ensure the correctness of the data of the cabinet in the room.The three different heights of every cabinet are selected and two points are laid symmetrically on the left side and the right one of the each height.The very bottoms selected are that Z is 0.5m,Z is 1.5m,Z is 3.5m.The probes of the temperature sensors are laid in the around of the cabinet and the directions of the probes of the temperature sensors are shown by the first uppercase letter of the directions in English.F0.5,F1.5,F3.5 are shown that 0.5,1.5,3.5 are the heights of the temperature sensors respectively laid on the left of the cabinet.And those of the back are B0.5,B1.5,B3.5.The plan view of the distributing points and the setup view of the detecting equipments of the temperature in the field are shown in figure 3 respectively.

Figure 3 The plan view of the distributing points
The discrete data of every cabinet is shown in table 1.
The limited and discrete temperature data are converted to the three-dimensional database by data fitting program to prepare for the visual model of the reconstruction of the temperature field.The flow chart of the data fitting is shown in figure 4.
2.2 Data Simulating and Comparing
The displaying renderings of the temperature of the cabinet is shown in figure 5.

Table 1 The discrete data table of the cabinet temperature
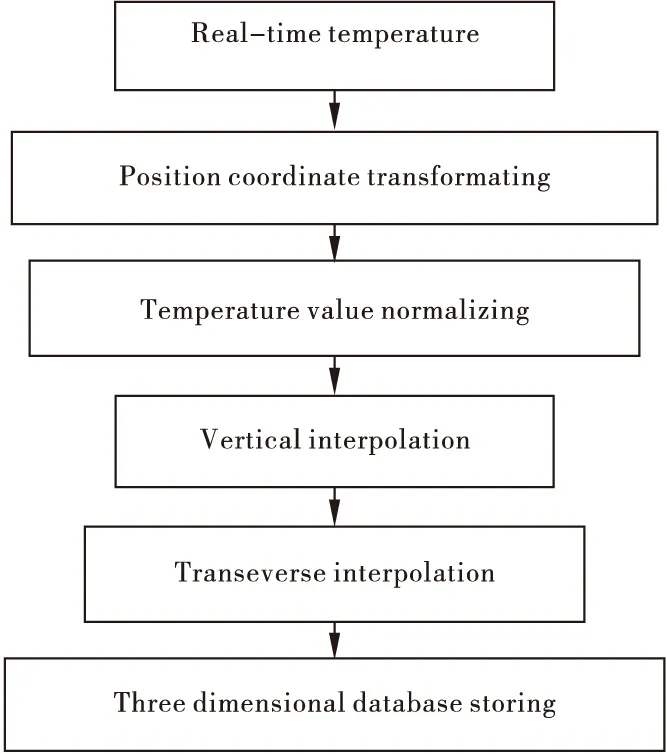
Figure 4 The flow chart of data fitting program


Figure 5 The displaying renderings of the temperature
After 200 iterative calculations,the convergence criterion of the residuals of the energy is 1.2799×10⁻⁷and the residuals of the other variables are all lower than 10-3and the value of all points donot change following the calculation,which is considered to be convergence.
Because there are the many measured points,the representative points are selected in the paper to test the precision of the model.So,the temperature(℃) of No.4~6 Cabinet (far from the return air inlet) and that of No.10~12 Cabinet(near to the return air inlet) are selected to be compared.The data are shown in figure 2~3.

Table 3 The comparison of the measured value and the analog value of the temperature in the front and the back in the No.7~12 Cabinet
From the Table 2 and the Table 3,the most of analog values of the detecting points in the back of the cabinet are higher than the measured values and those of the front are lower.The actual cabinet in the room is provided with the front door and the back one.The back of the cabinet is the inlet of the air and the front is the outlet in the most conditions.The temperature of the exhausting air is higher than that of the inlet air.And the fans are equipped in some cabinets to strengthen exchanging heat actually.The cabinet is simplified to ignore the influence of the exchanging heat when simulation is done in the paper.Based on the above tables,the absolute value of the measured values and the reconstruction one is concentrated between 0.2 and 0.4℃.The collecting values of the temperature of the cabinet are relatively coincided with the analog values,which is enough to obtain the temperature distribution of the macro environment of the room and to verify the accuracy of the model established.
2.3 Three-dimensional scene displaying
The three-dimensional displaying includes three-dimensional scene establishment,man-machine interaction and temperature field displaying.The actual communication room is mainly composed of computer cabinets,air-conditionings and floor and so on.Direct3D function library is called to establish the proportion of object model according to the size of the actual object.Instruction function for triangle unit is used to combine into the surfaces of the cabinets,which is provided by Direct3D.Then,the global model is combined according to the actual position of the cabinets.The flow chart of modeling the communication room is shown in figure 6.
In order to simulate accurately,rendering function should be called to process the texture of the surface and the light intensity and so on[5].
The global temperature field of the communication room and that of the front and rear of the cabinets should be displayed.The surface of the cabinets and the overall space of the communication room are divided into a lot of grids.The node of the grid contains the coordinates and the temperature value which are stored in the database.Color mapping algorithm is used to show whether the temperature is high or low,of which the foundation is a visible color model.The key to reconstruct is that different colors represent nephograms with different field.
Quantities,which sets some different colors by color mapping algorithm (such as green,yellow or red) and then makes the color values uniform according to whether the field changes violently or not.This is shown in figure 7.
The focus on monitoring the temperature of the communication room is how the surface hotpots of the cabinets distribute,so the real-time monitoring standard is high.The visualization system would automatically refresh the temperature field of the front and rear of the cabinets every 10 seconds,which means that the relative data of the temperature field are automatically read from the database every 10 seconds on that time and that the temperature field is refreshed and displayed in the three-dimensional scene.The temperature of the communication room is refreshed every 10 minutes.So the temperatures of the communication room and the cabinets are refreshed and displayed.

Figure 6 The flow chart of modeling the communication

Figure 7 Linear color mapping method
2.4 Interface between VB.NET and Direct3D and Interactive Screen
Direct3D is provided with the strong capacity to process three-dimensional image without the capacity to establish data model and to write interface programmer.VB in Visual Studio 2005 is provided with the simply capacity to program and the strong superiority to develop interface.It is practical significance to reconstruct temperature field and to develop visual system and to monitor the change of the temperature distribution in the room and the cabinet if the superiorities of Direct3D and VB are combined[6].
The steps to make Direct3D work in the environment of VB.NET is the following.
Step1:to right-click on “References” in Solution Explorer and to choose “Add Reference”;
Step2:to scroll down the tap of NET and to search the component named “Microsoft.DirectX”;
Step3:to hold down the CTRL key and to choose the component named Microsoft.DirectX,Microsoft.DirectX.Direct3D and to click OK;
Step4:to open the document named dxmutmisc.cs and to comment out the codes which are not in the area of Native Methods and Timer;
Step5:to press F6 to build the solutions.
The system adopts VB.NET to build good man-machine interface.Direct3D provides the functions to scale,to pan and to rotate the model.The relative functions are called to rotate and move the three-dimension room in order to monitor the room in the different directions.The displaying effect of the temperature of the cabinet is shown in figure 8.

Figure 8 The displaying effect chart of the temperature
The data of the real communication room are detected by the temperature sensors and are transported to the database.Those data in the database are read by the module to calculate the temperature field and the result is stored in the database.The result is called to realize the temperature field visibly displaying and interacting with the client by Direct3D.The temperature displaying of the whole communication room is shown in figure 9.

Figure 9 Visible picture of the communication room
3 Summary
The visualization of three-dimensional temperature field of the communication room is realized with the Direct3D graphics library and the VB.NET platform.Compared with the temperature values measured in the field,the visualization system reflects the temperature distribution of the cabinets’ surface and that of the space of the communication room correctly.The system realizes to monitor the temperature of the communication room in real time with a good man-machine interface and provides the basis to solve the problems of the hotspots.There are some problems to solve,such as how to draw the contour lines、vector graphics and scatter diagram of the temperature field,which are the focus to research in the future.
[1]Houjun Lu,Huiqiang Zhen,Daofang Chang,et al.The Key Techniques to Design Model Repository for Container Terminal Virtual Reality System[J].JDCTA:International Journal of Digital Content Technology and its Applications,2013,7(7):331-338.
[2]Mangxian Qiu,Xiaolin Wang.The Research of Human Motion Capture Technology in Virtual Environment[J].JCIT:Journal of Convergence Information Technology,2013,8(4):1015-1020.
[3]Hongxiang Wang.Simulation and Analysis of the Temperature Field in EACVD Integration System[J].IJACT:International Journal of Advancements in Computing Technology,2013,5(1):785-791.
[4]Shaohui Deng,Guozhao Wang.Error Estimation of a New Graphic Fitting Method[J].JDCTA:International Journal of Digital Content Technology and its Applications,2012,6(20):420-428.
[5]Shouwen Pang,Haijian Qi.Visualization Realization of Temperature Field of Diesel Engine Cylinder Based on OpenGL[J].Journal of Shandong University,2010,18(1):10-12.
[6]Yanfang Xu.based on virtual reality human-computer interaction techniques In the remote rehabilitative training robot system[D].Nanjing,Southeast University,2008.
(责任编辑:马金发)
1003-1251(2015)02-0084-07
TP216 Document code: A
Received date: 2013-12-13
Foundation: Project Supported by Education Department of Liaoning Province (LT2012005)
Biography: LIU Xiaoyang(1979—),female,lecturer,Research fields:networked measurement and control system and the computer process control technology.
猜你喜欢
Chinese Physics B(2019年2期)2019-02-25
暨南学报(哲学社会科学版)(2017年5期)2017-11-14
暨南学报(哲学社会科学版)(2015年5期)2015-11-14
暨南学报(哲学社会科学版)(2015年2期)2015-11-14
暨南学报(哲学社会科学版)(2015年3期)2015-11-14
暨南学报(哲学社会科学版)(2015年1期)2015-11-14
暨南学报(哲学社会科学版)(2015年6期)2015-11-14
英语学习·阳光英语(2013年2期)2013-07-04
