
Unicast Network Topology Inference Algorithm Based on Hierarchical Clustering
2015-03-21 03:36肖甫是晨航黄凯祥
(肖甫), (是晨航), (黄凯祥),
1.College of Computer, Nanjing University of Posts and Telecommunications, Nanjing 210003, P.R.China; 2.Jiangsu High Technology Research Key Laboratory for Wireless Sensor Networks, Nanjing University of Posts and Telecommunications, Nanjing 210003, P.R.China (Received 16 December 2014; revised 17 August 2015; accepted 8 October 2015)
Unicast Network Topology Inference Algorithm Based on Hierarchical Clustering
XiaoFu(肖甫)1,2*,ShiChenhang(是晨航)1,HuangKaixiang(黄凯祥)1,
WangRuchuan(王汝传)1,2
1.College of Computer, Nanjing University of Posts and Telecommunications, Nanjing 210003, P.R.China; 2.Jiangsu High Technology Research Key Laboratory for Wireless Sensor Networks, Nanjing University of Posts and Telecommunications, Nanjing 210003, P.R.China (Received 16 December 2014; revised 17 August 2015; accepted 8 October 2015)
Network topology inference is one of the important applications of network tomography. Traditional network topology inference may impact network normal operation due to its generation of huge data traffic. A unicast network topology inference is proposed to use time to live (TTL) for layering and classify nodes layer by layer based on the similarity of node pairs. Finally,the method infers logical network topology effectively with self-adaptive combination of previous results. Simulation results show that the proposed method holds a high accuracy of topology inference while decreasing network measuring flow, thus improves measurement efficiency.
network topology inference; network tomography; hierarchical clustering; time to live(TTL)
0 Introduction
Network topology inference is to identify the logical connection relationships between network elements using a variety of measurements and then to speculate the network topology. As the key technology in the field of network measurement,it is of great significance for network management, network operations and network security. Traditional network topology inference methods, including active measurement method like Traceroute[1,2], usually need collaboration of intermediate nodes and protocol support. With an expanding network size and an increasing security requirements, the collaboration between nodes has become more and more difficult, resulting in difficult implement of traditional network topology inference method . Therefore, network topology inference based on end-to-end measurement, also known as network topology inference based on network tomography, has been the focus of scholars.
Network tomography can obtain network internal characteristics based on end-to-end measurement and does not need the collaboration among network internal nodes. In the tree structure network, the corresponding characteristics will be more relevant with the increasing shared link of nodes[3]. Network topology inference, as a typical application of network tomography, can infer the network topology according to the relevance of the performance characteristics of network nodes. Network topology inference based on network tomography was first applied to the multicast network. Tian et al.[4]proposed a method based on hamming distance and hop count to infer multicast network topology, where hop count was used to obtain topology level information, while hamming distance was used to identify multicast network topology. However, this algorithm can be applied only to the network with lighter load, and the need for clock synchronization between nodes is also the restriction for this method to practical applications. Due to the less equipment support muticast in actual network, this results in the research on unicast network topology inference have become more practical and valuable. Zhao et al.[5]proposed a ″transport train″ measurement which just needed one measurement source without clock synchronization and inferred network topology based on queuing delay. In order to decrease restrict of single parameter in network topology, another multi-parameter topology inference algorithm was developed by combining time delay with packet loss rate[6]. Su et al.[7]divided leaf nodes into mutually disjoint groups through fan-out attenuation mechanism, then inferred the general structure of network topology based on SBA sorting method.Brian et al. clustered terminal nodes through depth first ordering, and reconstructed the logical topology on the basis of depth-first-search (DFS) ordering[8]. Recently, Brett et al.[9.10]proposed a prototype iTop, an algorithm for inferring the network topology when only partial information was available, by construcing a virtual topology, and then repeatedly merged links in this topology toward true network structure. Zhang[11]proposed a novel binary tree pruning algorithm based on t-test to infer the network topology and a lower bound on the correctly identified probability of the proposed method as well. However, network topology inference based on network tomography assumes that the intermediate router nodes are all cooperative, and that it will cause excessive probe packets and large network measuring flow seriously affecting normal operation of the network. Therefore, how to decrease the measuring flow without influencing the accuracy of topology inference deserves our exploration.
A unicast network topology inference based on hierarchical clustering is proposed. This method uses TTL field of probe packets for layering on leaf nodes at first, and then clusters leaf nodes on each layer based on similarity clustering algorithm. Finally, it infers the whole network topology based on hierarchical clustering results and the changing TTL value.
1 Measurement of Network Topology Inference
1.1Related definition

1.2Sandwich probe measurement method

Fig.1 Sandwich probe packets
Sandwich probe measurement method was first proposed by Castro et al.[12]Each sandwich probe packet is composed of two short packets, and a long packet and the length of the long packet has to be considerably longer than that of the short ones. The long packet is located in the middle of the two short packets with a same destination address, but the destination address of the long packet is differ from that of the short ones. As shown in Fig.1, short packetsp1,p2haveasamedestinationaddresswhichisnode3,whilethedestinationaddressofthelongpacketqisnode5.Theinitialintervalbetweentwoshortpacketsisd.Duetothequeuedelayoflongpacketbyrouter,thetimeintervalbetweentwoshortpacketsreachingthedestinationbecomeslarge.InFig. 1,longpacketqgeneratesqueuingdelaywhenbeingforwardedbynode1,whichresultsinincreaseofdtod+Δdeventually.Themoresharedlinkswhichtheshortpacketsandthelongpacketgothrough,thelongerqueuingdelaywillbegeneratedbythelongpacket,andthelargertheintervalbetweenp1andp2comes.
1.3Calculation for similarity of node pair
2 Network Topology Inference Based on Hierarchical Clustering
Network topology inference algorithm based on hierarchical clustering consists of the following three steps: First, the source node sends probe packets to all leaf nodes, and the leaf nodes are layered by time to live (TTL) fields of the received packets; Then each layer of leaf nodes is clustered by similarity clustering algorithm; Finally, according to the result of hierarchical clustering and the changing TTL value, the network topology is inferred.
2.1TTL hierarchical algorithm
TTL field of 8 bit in IP datagram header is mainly used in TTL hierarchical algorithm. TTL indicates the amount of routers through which the packet passes at most, and it is also the lifetime of the packet in the network. As stipulated in IP protocol, router subtracts 1 from TTL field of the packet before forwarding it. If the TTL value is 0, the router will discard the packet and never forward it. TTL field is set by source point to prevent the waste of network resources caused by undeliverable packet forwarding indefinitely in the Internet. In practice, most OSes, including Microsoft Windows, Linux, and Unix systems,only select a few figures,including 32, 64,128 and 255, as initial TTL value. The difference between an initial TTL value and its final TTL value is the number of routers which the packet goes through in the network, also known as the hop count. Since the differences between the above initial TTL values are large, and practically few Internet hosts are apart by more than 30 hops[13], one can determine the initial TTL value of a packet as the smallest one in the above set but larger than its final TTL. Therefore, firstly the source node sends probe packets to all leaf nodes with a set initial TTL values. And then final TTL fields of received packets in leaf nodes are recorded. Finally, leaf nodes are stratified according to the hop count between source node and the destination node.
2.2Similarity clustering algorithm
Leaf nodes are divided into different layers according to the TTL hierarchical algorithm. Then leaf nodes are clustered by similarity layer by layer. First of all, the similarities of all node pairs in a certain layer are obtained by sandwich probe measurement and sorted ascendingly. Then minimum similarity set is calculated by variance ratio. The incompatible K-Bucket is built. Finally, leaf nodes are clustered.
2.2.1Minimum similarity set
For a set of similarity values in ascending order, the first element is the lower bound of the minimum similarity set and the key is to find the upper bound of the minimum similarity set. Variance is used to measure the volatility of a batch of data. By analyzing experimental data, we discovered that the difference between elements in the minimum similarity set and other elements was generally large. Therefore, variance ratio is selected to obtain minimum similarity set.
The definition of variance is as

Input:Thenumberofleafnodesonlayeri:n
Similarity set of all node pairs on layeri:
ThesizeofthesetSi:L=n×(n-1)/2
The threshold of variance ratio:R=K
Minimumsimilaritysetofleafnodesonlayeri:Mi=Φ
Output:Mi
Begin
SortsimilarityinSiascendinglyandgetsimilaritysetinascendingorderSA={sa,b,sc,d,se,f,…},wherea,b,c,d,e,f∈[1,n].
SelectthefirstandthesecondsmallestsimilaritiesfromSA(thatissa,b,sc,d)tocalculatetheirvarianceV2accordingtothevarianceformula;InthesamewayselectthefirstthreesmallestsimilaritiesfromSA(thatissa,b,sc,d,se,f)tocalculatetheirvarianceV3;
IfV2≠0
Forj={4,5,…,L}do
Begin
IfRj-1,j-2≥Kthen
Begin
Takej-2astheupperboundoftheminimumsimilaritysetofleafnodesonlayeri;
Addthefirstj-2smallestsimilaritiesfromSAtosetMi;
Break;
End
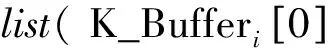
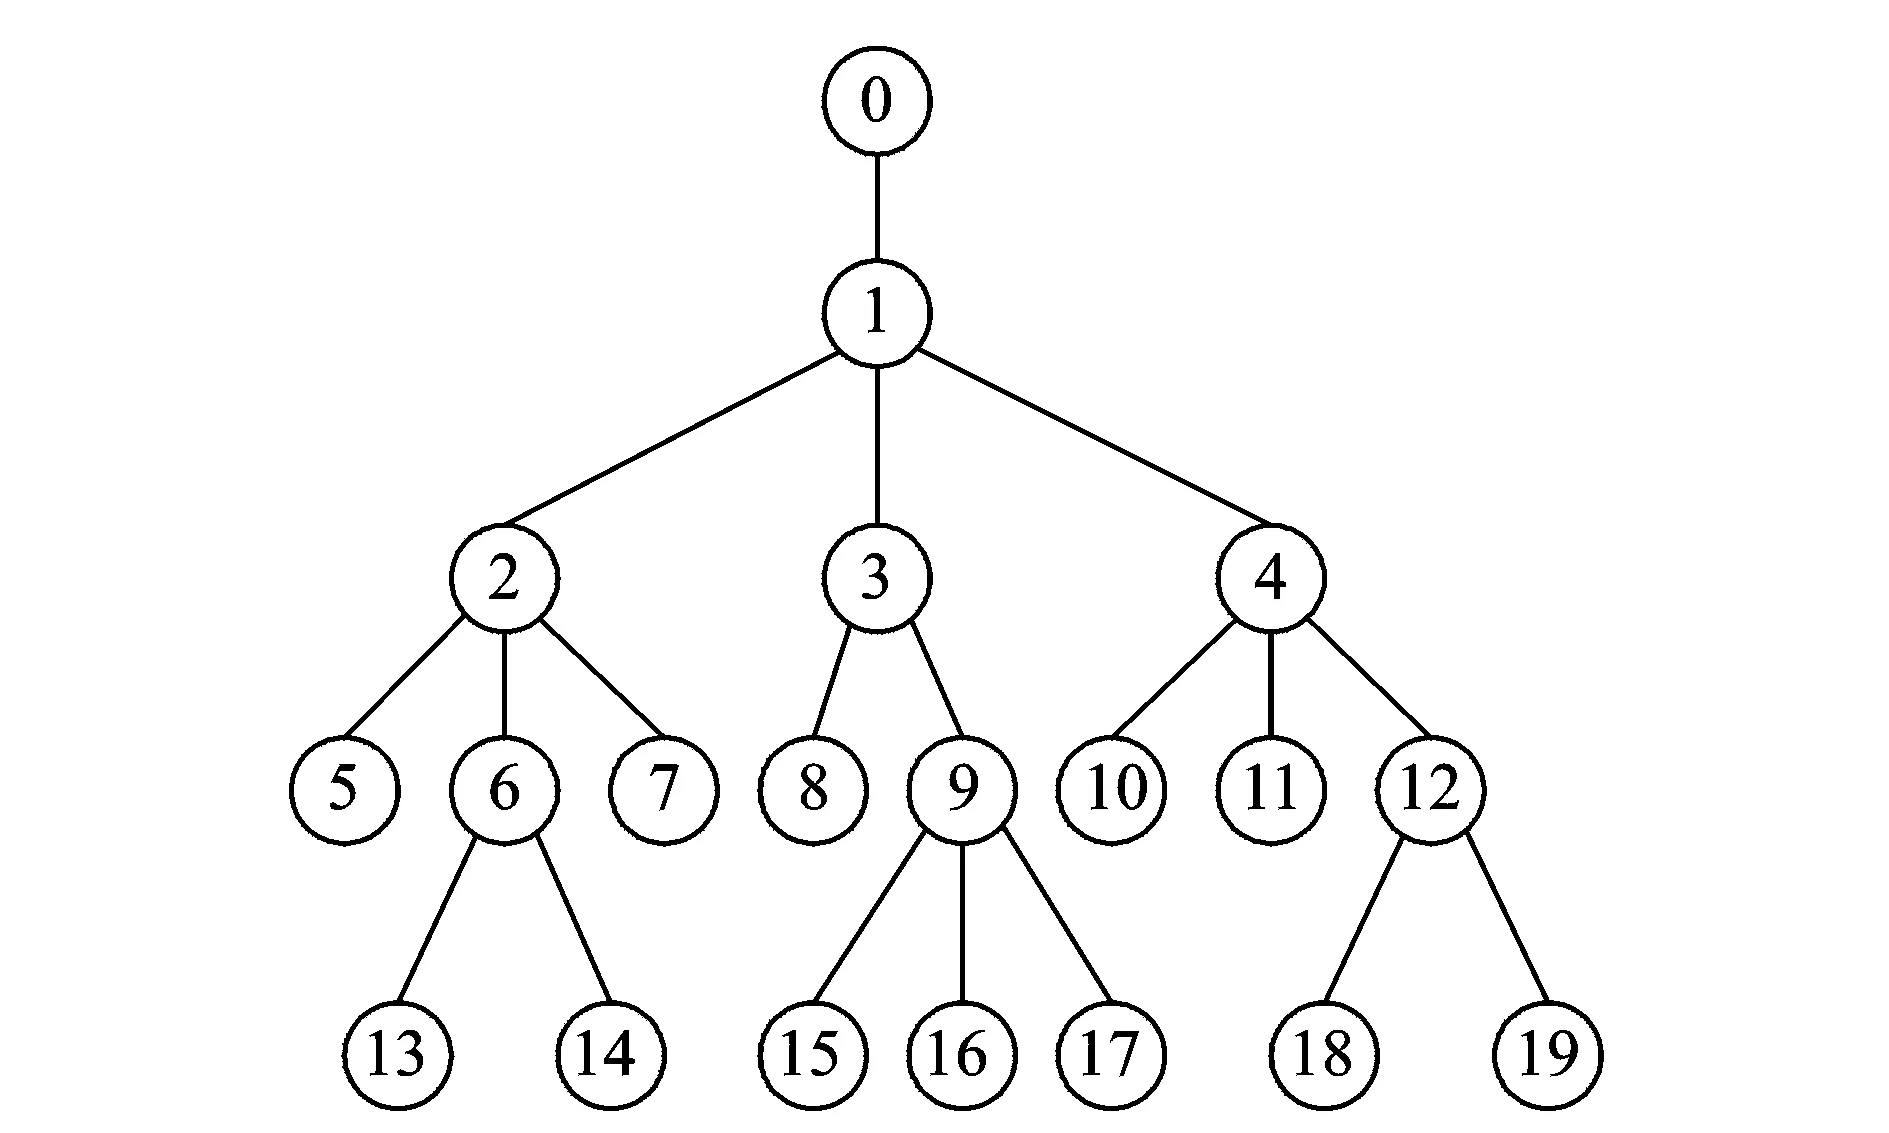
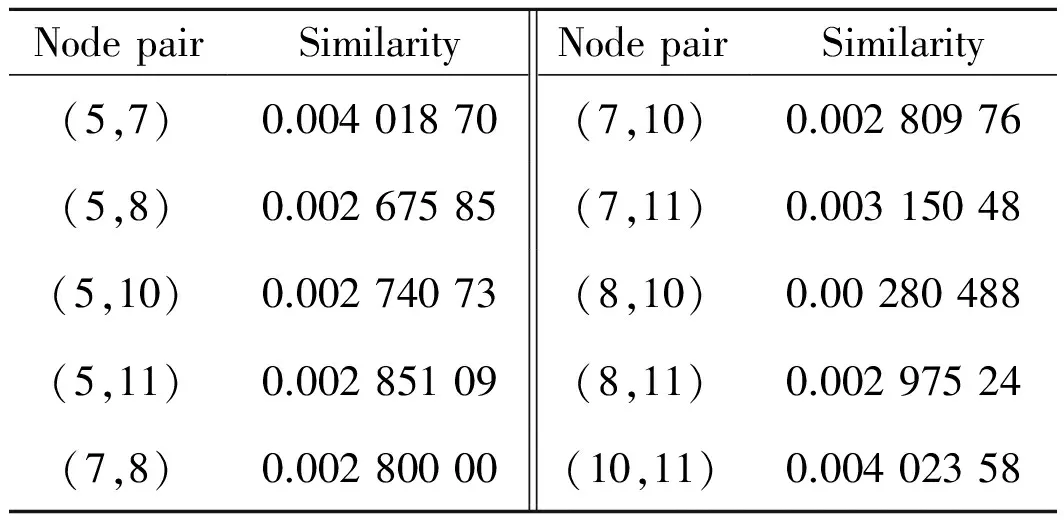
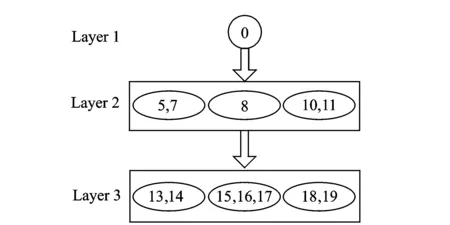
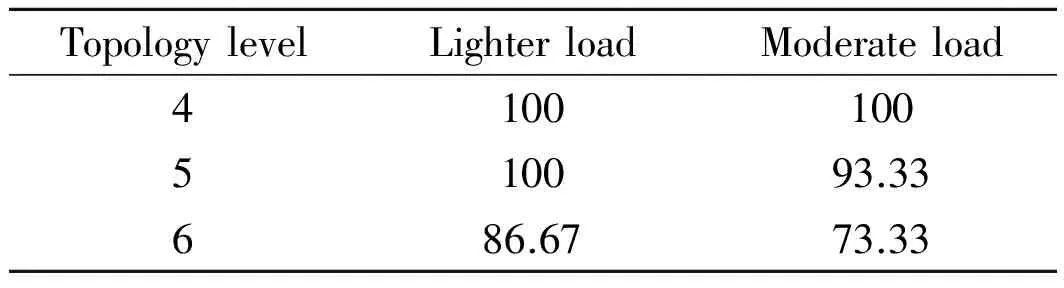
IfRj-1,j-2 Begin CalculatethevarianceVjofthefirstjsmallestsimilaritiesfromSAto; IfVj-1≠0 thencalculatevarianceratiosVjandVj-1: End; End; End; 2.2.2IncompatibleK-Bucket IncompatibleK-Bucketisanarrayoflinkedlistsbasedontheminimumsimilarityset.Theleafnodepairsintheminimumsimilaritysetuniformlymaptotheincompatiblerelationsbetweenthefirstnodeanditssubsequentnodesineachlinkedlist,whilethefirstnodeineachlinkedlistconstitutesthesetofleafnodesinlayeri. Take the set of leaf nodes in a certain layer {5,7,8,10,11} for example. Firstly, build initial incompatible K-Bucket and only one node leads each linked list, as shown in Fig.2 (a). Assume that the minimum similarity set is {(5, 8),(5, 10),(7, 8),(8, 10),(7, 10),(5, 11),(8, 11),(7, 11)}. For the first node pair(5, 8),add incompatible node 8 to the linked list with the first node of 5, and add incompatible node 5 to the linked list with the first node of 8, as shown in Fig.2(b). Similarly,add the rest node pairs in the minimum similarity to the lists and the final incompatible K-Bucket is shown in Fig.2(c). Fig.2 Establishment of incompatible K-Bucket 2.2.3Leaf node clustering algorithm Leaf nodes in layeriare clustered based on incompatible K-Bucket. First, suppose the leaf nodes in layeriare divided into two categories, set 1 and set 2, whose representative elements are the first and the second nodes of the first linked list in incompatible K-Bucket, respectively. For the leaf node in addition to the two representative elements, its incompatible nodes in incompatible K-Bucket(that is all subsequent nodes of the linked list where it is the first node) are compared with all the elements in set 1. If they are all different, then add the leaf node to set 1. If there is at least one same node, then compare its incompatible nodes with all the elements in set 2. If they are all different, then add the leaf node to set 2, otherwise build a new category set 3 and add the leaf node to set 3. By that analogy, we finally get the clustering sets of leaf nodes in layeri. The specific algorithm in pseudo-code is described as follows. Leaf node clustering algorithm based on incompatible K-Bucket. Input: the number of leaf nodes in layeri:n Set of leaf nodes in layeri:Ni={x1,x2,…,xn}. IncompatibleK-Bucketofleafnodesinlayeri:K_Bufferi,wheretheorderofthefirstnodeineachlinkedlistissameassetNi,thatisx1,x2,…,xn. Output:clusteringsetsofleafnodesinlayeri:Set1,Set2,…. Forj={1,2,…,n}do Begin Ifxj≠aandxj≠bthen Begin Fork={1,2,…,SetNum}do Begin Compareincompatiblenodesofthefirstnodexjofthejthlinkedlist(K_Bufferi[j-1])inincompatibleK-Bucket(thatisallsubsequentnodesafterxjofthejthlinkedlist)withalltheelementsinSetkonebyone; IfincompatiblenodesofxjandalltheelementsinSetkarealldifferentthen Begin addxjto Setk, that is xj∈Setk; Break; End IfthereisatleastonenodeinSetksamewithxjand incompatible nodes ofxjthen Continue; End IfincompatiblenodesofxjandtheelementsinexistingSetNumcategoriesallhavethesamethen Begin SetNum=SetNum+1; BuildanewcategorySetSetNum; AddxjtoSetSetNum,thatisxj∈SetSetNum; End; End; End; 2.3Inference of hierarchical clustering network topology with changing TTL Now a layered network topology which is clustered in each layer is obtained by TTL hierarchical algorithm and similarity clustering algorithm. It is essential that how to merge and connect the lower clustering set and the upper clustering set to obtain a complete network topology. For instance, Fig.3 shows a hierarchical clustering network topology. The first layer is source node. The second layer contains two clustering setsAandBwhile the third layer contains setsCandD. There are 9 solutions to merge and connect the lower and the upper clustering sets together. Suppose it is corresponding to an unordered tree. There are 6 merge connection solutions which are shown in Fig.4. Through analyzing the network topology structure in these solutions, we find that the number of shared links and shared routers are not the same between each clustering set in each solution. On basis of this and the traceroute method, we obtain the number of shared routers between each clustering sets through changing the TTL value of long sandwich probe packets to infer the network topology. Fig.3 Hierarchical clustering network topology Fig.4 Merge connection solutions to hierarchical clustering network The sandwich probe measurement method shows that the queuing delay is generated by store-and-forward when the long packets pass through the routers, which is related with the number of shared routers. As long as the long packet and the short packets still share links, queuing delay will increase with an increasing number of shared routers. Once the long packet is separated from the short packets, queuing delay will remain unchanged as the second short packet is no long affected by long packet. In our method, the source node sends sandwich probe. TTL value of the long packet starts from 1 and pluses one by one to two different clustering sets. Meanwhile, the similarity of the two clustering sets is calculated. The TTL value at the turning point where the similarity stops rising and begins to be unchanged equals to the number of shared routers of the two clustering sets. Since the TTL value of the long packet is no larger than hop count of nodes in clustering sets, with limited sandwich probe packets we can get the number of shared routers among all clustering sets and then infer the complete network topology. In order to verify network topology inference method based on hierarchical clustering, we conducted simulations with lighter and moderate network load based on NS-2.26 by controlling the size of background traffic. The simulation topology is shown in Fig.5. Simulation results in the case of moderate network load are as follows. Fig.5 The simulation network topology The initial TTL value of the probe packet was set as 128 based on the TTL hierarchical algorithm. The final TTL value was recorded in leaf nodes. Thus the hop count was calculated. The layering result based on hop count is shown in Table 1 and the source node 0 was set as layer 1. Table 1 Layering result of leaf nodes We sent sandwich probe packets to all node pairs in each layer and the similarity of node pairs are shown in Tables 2, 3. Then we clustered the leaf nodes in each layer based on similarity clustering algorithm, and the clustering result is shown as follows(Fig.6). Table 2 Similarity of node pairs in layer 2 Table 3 Similarity of node pairs in layer 3 Fig.6 Hierarchical clustering network topology Each clustering set was represented by a capital letter, namelyA={5,7},B={8},C={10,11},D={13,14},E={15,16,17},F={18,19}. After successively sending sandwich probe packets with changing TTL value to the clustering sets, we obtained the similarity of each two cluster sets, as shown in Fig. 7. The number of shared routers between clustering setsAandD,BandE,CandFwas two while the number of shared routers between the other clustering sets was one. It is easy to infer the whole network topology, as shown in Fig. 8, the number of shared routers. Fig.7 Variation of similarity between clustering sets and changing TTL Fig.8 Network topology inference based on hierarchical clustering network topology Compare Fig.8 with Fig.5, the network topology inferred from network topology inference method based on hierarchical clustering is exactly the same with origin network topology. And topology inference method based on hierarchical clustering for 4-layer network topology can be verified. In order to verify inference algorithm when increase the level of network topology, different simulations were conducted for 5-layer and 6-layer network topology under lighter and moderate network loads, and the simulation results are shown in Table 4. Table 4 Topology inference accuracy rate with different topology levels under different network loads Accuracy rate of hierarchical clustering network topology inference algorithm in lighter load case was higher than that of moderate load case. We infered that the algorithm works well in lighter load network environment. Table 4 also shows that as the network level increases, accuracy rate of the algorithm will be slightly reduced, but still relatively high. While in Refs.[9, 10], the complexity is dominated by the calculation of the merging options, which corresponding toO(|EVT|2×|VVT|3),where|VVT|thenumberofnodesinthenetworkvirtualtopologyand|EVT|thenumberoflinksconnectingthem. |VVT|equalstoN.Comparedwiththesenetworktopologyinferencebasedonnetworktomography,ourmethodcanbasicallyensurehighaccuracyoftopologyinferencewitheffectivelydecreasingmeasuringflow,thusimprovestheefficiencyoftopologyinference. A unicast network topology inference algorithm based on hierarchical clustering is proposed and the simulation test is conducted on the NS-2. The experiment result shows that the network topology inference can basically ensure high accuracy of topology inference while effectively decreases measuring flow, thus improves efficiency of topology inference. How to further infer the physical topology of network is our future work. Acknowledgements This work was supported by the National Natural Science Foundation of China (Nos. 61373137, 61373017, 61373139), the Major Program of Jiangsu Higher Education Institutions (No.14KJA520002), the Six Industries Talent Peaks Plan of Jiangsu(No.2013-DZXX-014), and the Jiangsu Qinglan Project. [1]Luckie M, Hyun Y, Huffaker B. Traceroute probe method and forward IP path inference[C]// Proceeding of the 8th ACM SIGCOMM. New York, USA: ACM, 2008: 311-324. [2]Jin X, Tu W, Chan S H G. Traceroute-based topology inference without network coordinate estimation[C]// IEEE International Conference on Communications. Washington, DC, USA: IEEE, 2008: 1615-1619. [3]Zhao Honghua, Chen Ming. Topology Inference Based on Network Tomography [J]. Journal of Software, 2010, 21(1):133-146 .(in Chinese) [4]Tian H, Shen H. Hamming distance and hop count based classificcation for multicast network topology inference[C]// 19th International Conference on Advanced Information Networking and Applications. Washington DC, USA: IEEE, 2005 (1): 267-272. [5]Zhao Honghua, Ding Ke, Chen Ming. Topology inference algorithm by using one measuring node [J]. Journal of University of Electronic Science and Technology of China, 2010, 39(2): 275-278.(in Chinese) [6]Zhao Honghua, Chen Ming, Qiu Xiaofeng, et al. Multiple parameters network topology inference based on tomography [J]. Journal of Beijing University of Posts and Telecommunications, 2008, 31(4): 24-28. (in Chinese) [7]Su H B, Li Y, Lin S J, et al. A sort-based approach to infer the network topology[C]// 2010 IEEE International Conference on Communications. Washington, DC, USA: IEEE, 2010: 1-6. [8]Eriksson B, Dasarathy G, Barford P, et al. Efficient network tomography for internet topology discovery [J]. IEEE Transactions on Networking, 2012, 20(3): 931-943. [9]Holbert B, Tati S, Silvestri S, et al. Network topology inference with partial information [J].IEEE Transactions on Network and Service Management, 2015, 12(3):406-419. [10]Holbert B, Tati S, Silvestri S, et al. Network topology inference with partial information[C]// International Conference on Computing, Networking and Communications, Network Algorithm & Performance Evaluation Symposium. Washington, DC, USA: IEEE, 2015:796-802. [11]Zhang Runsheng, Li Yanbin, Li Xiaotian. Topology inference with network tomography based on t-Test [J]. IEEE Communications Letters, 2014, 18(6):921-924. [12]Castro R, Coates M, Liang G, et al. Network tomography: Recent developments [J]. Statistical Science, 2003, 19(3): 499-517. [13]Wang H, Ding W, Zhu H. A method of tree network topology inference based on hierarchical host table[C]∥ Systems and Informatics (ICSAI), 2012 International Conference on. USA:IEEE, 2012: 1477-1481. (Executive Editor: Zhang Bei) TP393Document code:AArticle ID:1005-1120(2015)06-0591-09 *Corresponding author: Xiao Fu, Professor, E-mail:xiaof@njupt.edu.cn. How to cite this article: Xiao Fu, Shi Chenhang, Huang Kaixiang,et al. Unicast network topology inference algorithm based on hierarchical clustering[J]. Trans. Nanjing U. Aero. Astro., 2015,32(6):591-599. http://dx.doi.org/10.16356/j.1005-1120.2015.06.591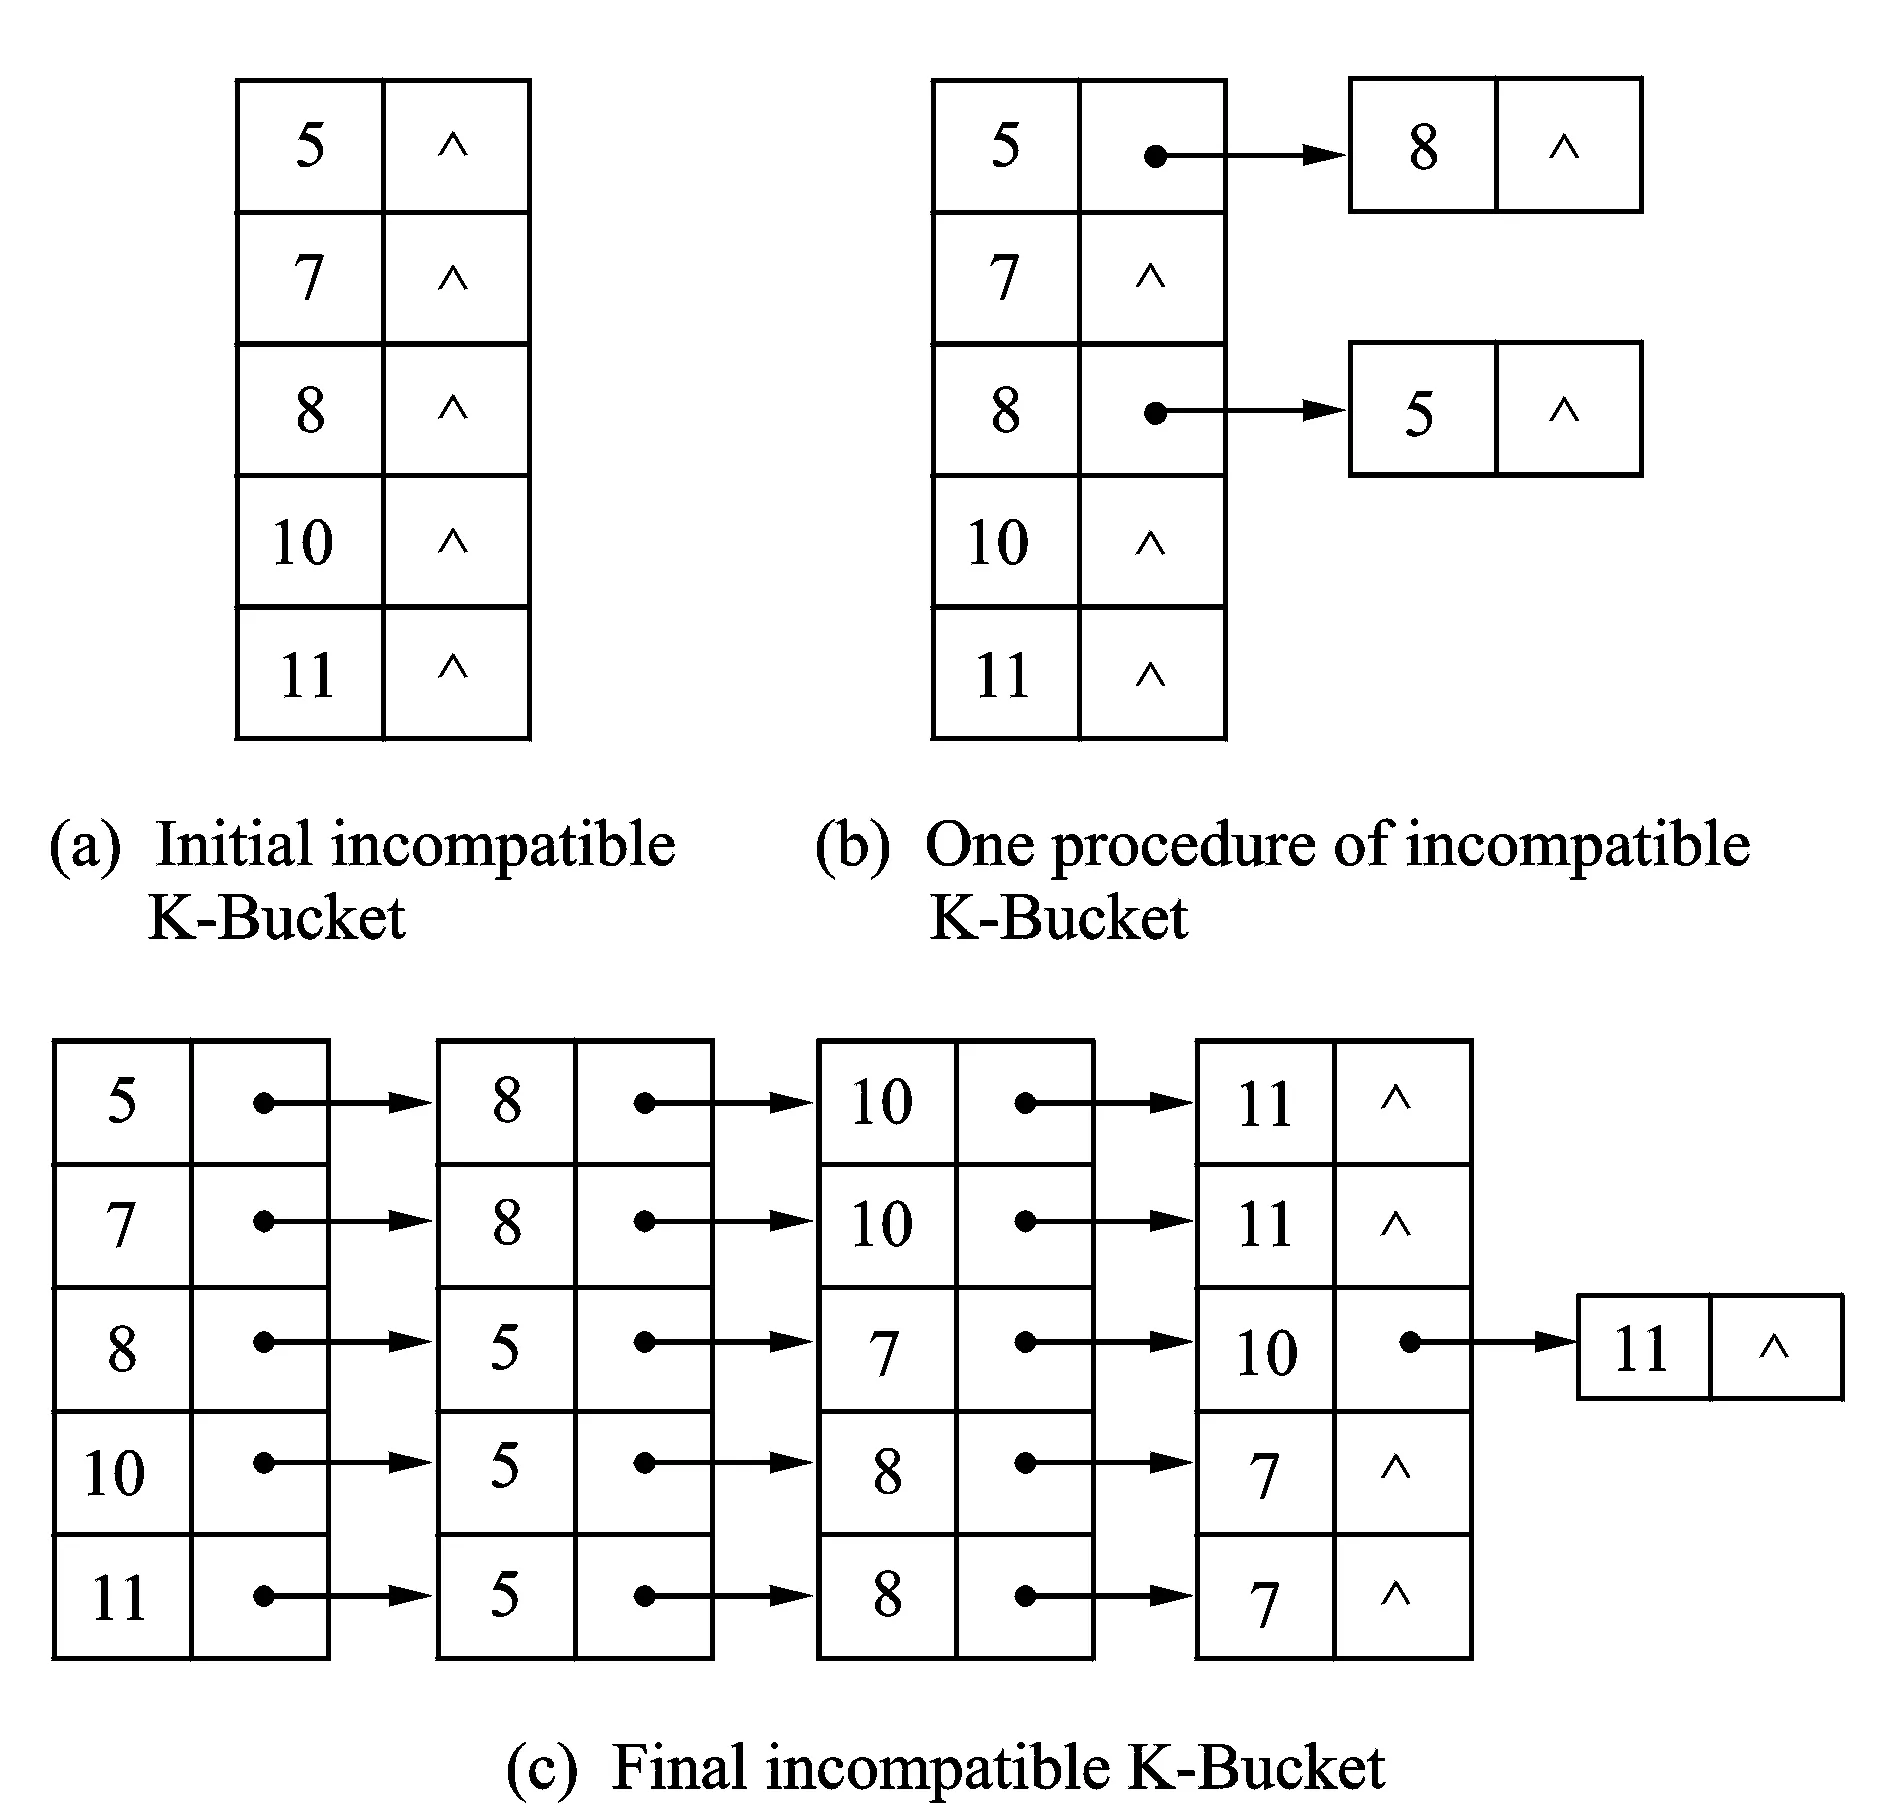


3 Experimental Evaluations


4 Conclusions
 Transactions of Nanjing University of Aeronautics and Astronautics2015年6期
- Transactions of Nanjing University of Aeronautics and Astronautics的其它文章
- Structure Design of Shaped Charge for Requirements of Concrete Crater Diameter
- Fault Detection Based on Incremental Locally Linear Embedding for Satellite TX-I
- Deformation Analysis on Shear-Bending of Ring-Shaped Piezoelectric Actuator
- Mechanical Behavior of Bistable Bump Surface for Morphing Inlet
- Effect of Tip-Blade Cutting on the Performance of Large Scale Axial Fan
- Infrared Heating Technology for Automated Fiber Placement