
Effect of precipitation condition on photosynthesis and biomass accumulation and referring to splash erosion status in five typical evergreen tree species in humid monsoon climatic region of subtropical hill-land
2015-04-15 11:46YUWeiqing余蔚青WANGYunqi王云琦WANGYujie王玉杰ZHANGHuilan张会兰WANGBin王彬LIUYong刘勇
Journal of Central South University 2015年10期
YU Wei-qing(余蔚青) ,WANG Yun-qi(王云琦) ,WANG Yu-jie(王玉杰) ,ZHANG Hui-lan(张会兰),WANG Bin(王彬),LIU Yong(刘勇)
1.School of Soil and Water Conservation,Beijing Forestry University,Beijing 100083,China;2.Key Laboratory of Soil and Water Conservation and Desertification Control of Ministry of Education(Beijing Forestry University),Beijing 100083,China
1 Introduction
Subtropical zone in China,influenced by the combined effect of the monsoon circulation and Tibetan Plateau,has its own unique characteristics in the world.As the rest of the world on the same latitude most becomes extremely arid desert due to subsidence warming of air and huge saturation deficit of water vapor caused by the existence of subtropical high pressure belt,China’s subtropical zone has wide area and complex natural conditions [1-2].In the forest ecosystem of the mountainous regions in the southwestern part of subtropical zone in China,evergreen broad-leaved forest is one of the typical forest communities which is also widely distributed in some other areas including the southeastern of Australia,Florida of the United States,Chile and Argentina in South America,the northwestern of Africa,and some other parts of East Asia [3-4].Some of the dominant tree species are also the main species of man-made forest in South China because of their preferable function of water conservation [5-6].Water loss and soil erosion have been effectively controlled with extensive construction of shelter forest since the 80’s of last century,but a bottleneck of this protection of soil water came out in recent years.The most possibility including human disturbance and climate change,as a consequence,forest productivity has been reduced [7-9].
Atmospheric acid deposition,accompanied with the development of industry,has been increasing rapidly all over the world [10].The ecosystems of forest are driven mainly by precipitation,which is not only a key determinant of forest productivity but also the major approaches of wet deposition of acid [11-12].In the usual case,a positive correlation exists between net primary productivity (NPP) of forest and precipitation[13],and with the establishment of a synchronous relationship between plant photosynthesis and net primary productivity [14-15],photosynthesis is well known as a beneficiary of precipitation as well.But followed researches pointed that excessive rainfall reduces stomatal conductance (gs),and further decreases both transpiration rate (E) and net photosynthetic rate (Pn)as different degrees of water stress [16],besides that severe water stress will destroy the entire photosynthetic system of plant which may even cause the reduction of forest productivity [17].Tall arbors tend to grow in the regions with more adequate rainfall,and with larger leaf areas for the requirement of transpiration,the nonnecessity of moisture absorption from deeper soil by roots results in a concentration of biomass to their stems and branches [18].On the contrary,an increment in biomass enrichment to roots for those plants in the habitats with less precipitation [19].
Leaf is the main organ of photosynthetic products manufacture.Meanwhile,it is also considered to be the organ for carbon uptake.The amount of carbon contribution through leaf to plant is the organics synthesized via photosynthesis in leaves minus carbon consumption used for respiration and morphogenesis in the perspective on carbon balance [20-21].In addition,leaf is the very place where the first contact of precipitation with plant was taken place in,characteristics of which tend to be affected by precipitation easily [22].A most direct influence brought by rainfall is the changing of leaf wetness status,which not only suppresses the photosynthesis instantaneously,but also harms the photosynthetic apparatus chronically[23],soil compaction and moisture as indirect factors of plant photosynthesis through the exudates and respiration of roots would be altered by splash erosion and soil pH variation that caused by rainfall events were found as well [24-26].
As we all know,splash erosion is caused by precipitation,and performs high synchronization with precipitation therefore [27].Researches in Midwestern United States and Central European regions verified this high positive correlation between precipitation and splash erosion [28-29].Based on this,this work aims to explore the possibility of iteration by using splash erosion as a reference of the plant photosynthetic response to precipitation.Furthermore,it can provide a new idea to estimate the influence of precipitation on forest NPP,especially in those hilly regions where it is difficult to calculate NPP for the entire forest ecosystem neither through field measurements nor via remote sensing information.
Artificial plant and simulated precipitation were common used for its convenience in easy-restricted variables mentioned in some related researches before[30-31].However,few studies have been taken out by using plant cultivating device in real precipitation conditions.This work chose to simulate natural environment possibly with parts of setting factors (air temperature,vapor pressure deficit,CO2concentration,photosynthetically active radiation,soil moisture,etc.)under control with real plants and natural precipitation events.The objective of this work is to evaluate differences in growth of five typical evergreen species(one coniferous plant,one lanceleaf plant,and three broad-leaved plants) in response to precipitation conditions,which is necessary to be considered for the leading contribution of biological characteristics of dominant species to the biological properties of the community and even the entire ecosystem.Therefore,the measurements of parameters of photosynthetic characteristics and biomass accumulation during the experimental period were finished,and the adaptability of local phytobiocoenose to current stress brought by environmental change was discussed.
2 Materials and methods
2.1 Experimental area
The work was performed in workstation close to the water conservation forest which located in the watershed of Wentang Gorge next to Jialing River on Jinyun Mountain,about 14 km north of Beibei District in the City of Chongqing,China (N 29°49´81″,E 106°22´74″).This watershed is an important vegetation restoration and soil conservation demonstration zone for Yangtze River valley in the Chinese Grain for Green Project.The mean annual air temperature is 13.6 °C and annual precipitation is 1611.8 mm.Yearly rainfalls were mainly concentrated from May to September,and the growing season for plants was from May to November with a 27.3 °C average air temperature during this period.The annual sunshine hours is shorter than 1500 h because of the foggy weather,this number dropped to beneath 1300 h in 2012 [32].A point worth noting is that the tendency of acid rain in this area was found aggravated in recent years from meteorological data,pH of the rainfalls decreased from 5.23 in 2005 to 4.17 in 2011 [33-34].Soil in the study area is called yellow soil which is classified as a kind of orthic acrisols [35].
2.2 Experimental design
Materials in this work were five local typical evergreen species of young plants which were transplanted from the wild (Fig.1).Fifteen individual plants with similar morphologies (height,leaf area,number of leaves,etc.) and fresh weight were selected as repeats for each species and divided into three groups,named as group 1,group 2,and group 3,respectively.Group 1 was picked out as control group (without experiencing precipitation over the entire period but only subjected by artificial irrigation).Ten cubic containers of stainless steel in dimensions of 40 cm×40 cm×40 cm
were designed with no cover for indoor cultivation of group 1 and group 2 in the following experiments.Moreover,in each container a round notch was cut at the bottom and was completely overlaid with wire mesh and cardboard so as to make the moisture flow out of the container smoothly without causing too much loss of soil particles.Besides,each container was assigned with a number and placed on a plastic sheet with sufficient hardness (the size of plastic sheet is big enough to ensure that it could fully hang on the wooden frame with dimensions of 100 cm×100 cm×150 cm);plastic sheets were marked with the same number to the ten containers(Fig.2).

Fig.1 Species and morphology of plants sampled in this work:(a) Plant 1,Cunninghamia lanceolata;(b) Plant 2,Phyllostachys pubescens;(c) Plant 3,Gordonia acuminate;(d)Plant 4,Neolitsea aurata;(e) Plant 5,Symplocos setchuensis

Fig.2 Experimental set-up for plant cultivation
All plants were transplanted into the container with corresponding number.Soil used for filling was the topsoil dug from the place around the sampled plants and then was filled into the container naturally till the height was flush with the upper edge of the container,and some detail information of the soil is listed in Table 1.After the transplantation,the whole equipment was moved indoors,and four weeks’ continuous thermostatic culture under the condition with constant CO2concentration ((750±20)μmol/mol) and vapor pressure deficit (0.5 kPa) at the temperature of 27 °C was utilized for all plants.Two samples withered in the third week (one forPhyllostachys pubescens,and one forNeolitsea aurata).Thus,averages of follow measurements of the left four single plants of these two species were used as corresponding results.
Photosynthetic characteristics including stomatal conductance,transpiration rate,dark respiration rate,and net photosynthetic rate of these plants were measured(LI-6400XT portable photosynthesis system,6400-02BLED light source;Li-Cor Inc.,Lincoln,Nebraska,USA)for three single leaves at the height of 80 cm under 27 °C with the same air CO2concentration ((750±20) μmol/mol)and vapor pressure deficit (0.5 kPa) in six different gradients of photosynthetically active radiation (RPA=100,200,300,400,500,750,1000,1300,1600,1750,1900 and 2000 μmol/(m2·s) both before and after precipitation.Each measurement was carried out 30 min later when the photosynthetically active radiation (PAR) changed and recorded as control group.After that,the equipment was moved out into the rain,rainfall acceptance was broken off after 12 h since the precipitation began by making the equipment lidded.Water on the plastic sheet was removed,and then soil particles detached from the container were collected and dried in an oven at 105 °C for 8 h before weighing.Precipitation during 12 h was recorded by self-recording tipping bucket rain-gauges(Radio Controlled Rain-gauge;STEP Systems GmbH,Nuremberg,Bavaria,Germany) which were emplaced in corners of the workstation.Based on a hypothesis that effects of precipitation on plant photosynthesis were part irreversible;those photosynthetic parameters were continually measured in every 60 min and lasted for 48 h after the step of precipitation acceptance while all the plants were moved back indoors.Thus the effects of each single rainfall on photosynthesis of plants were determined by comparing the differences of the results before and after the very single rain.The maximum value of the difference between before and after precipitation within 48 h of plant leaf net photosynthetic rater for each single precipitation event was identified as variation of leaf net photosynthetic rate.Except that,all measurements were under the condition without runoff occurring in the purpose to ensure that soil particles detachment was caused by splash erosion as much as possible.Data of 76 precipitation events from June 1st to November 30th in 2013 were recorded and analyzed without any cleaning up of wilt-leaf to approach the best simulation effects.

Table 1 Main characteristics associated with plant photosynthesis of soil filled into container
Although soil moisture is one of the most affective factors of plant photosynthetic characteristics [36-37],the measurements in this work chose to ignore this as it is one of the variables that brought about by precipitation.Precipitation and related variables generated by which a black-box system were considered because this work was to discuss the entire impact of precipitation on plant photosynthesis.Meanwhile,the culture of plants in constantly conditions is helpful to lower the influence of humidity and temperature in the atmosphere on the result[38-39].
As many researches did before,weighing method was also used in this work to determine the dry matter content that enriched in every single plant [40-41].Besides,plant dry matter content (PDMC,CPDM) is defined as the ratio of plant dry mass to fresh mass which refers to leaf dry matter content (LDMC) that GANIER et al [42]have used.

whereWis plant fresh matter (g),and it was measured after removal of soil from each single plant;Wdis plant dry mass (g),and was measured with plant dried for 24 h under 85 °C.
All plants in group 3 were mutilated without leaves and divided into two parts of underground and aboveground before the work of weighing,and the same works were repeated to the left individual plants in the left two groups at the end of this work [43].It should be emphasized that the works of drying and weighing of roots and shoots were carried out separately.Followed,plant dry matter accumulation ratio (PDMAR,RPDMA) is used to determine the dry matter accumulation (DMA)status during the entire experiment period.

whereCPDM,B(%) andCPDM,A(%) are plant dry matter content before and after experiment,respectively;andCPDM,BwasCPDMof those plants in group 3 in this work.Dry matter accumulation of each whole plant was calculated by comparing those average variations in unit time.
2.3 Statistical analysis
The effects of precipitation on variations of plant photosynthesis for five species were analyzed using one-way ANOVA.Data of photosynthetic characteristics of each single leaf on all plants are presented as the average plus standard deviations.Differences were considered significant atP<0.05.Pearson’s linear correlation was used to evaluate the relationships between precipitation and net photosynthetic rate.Meanwhile,both linear and non-linear regression analyses were performed to determine the effect of precipitation on leaf photosynthetic rate variation for all five selected species in this study.For statistical analysis of data,OriginPro 8 (OriginLab Corporation,Northampton,Massachusetts,USA) and SPSS statistics version 17.0 (SPSS Inc.,Chicago,Illinois,USA)packages were used.Moreover,level of significance referred to in the results of this paper isP<0.05 unless otherwise stated.
3 Results and discussion
3.1 Frequency of photosynthetically active radiation over months and light response characteristics of physiological indices of selected plant species under natural conditions
Photosynthetically active radiation for each month was calculated by the average of daily PARs.Daily PAR in each month performed single peak regulation (Fig.3),and all peaks mostly concentrated in the time period from 12:00 to 14:00 (grey shaded in Fig.3).The maximum average of PAR was found in July,and all the peak values were less than 1700 μmol/(m2·s),which supplied the exact reason for PAR gradient setting of indoor experiments of this work.
Four physiological parameters,including net photosynthetic rate,stomatal conductance,transpiration rate and intercellular CO2concentration (Ci),were measured under the setting PARs indoor with controlled environmental factors.Single-peak values were also found in almost all five net photosynthetic rate curves when PAR was 1000 μmol/(m2·s) andPnunder the condition of PAR ranged from 800 μmol/(m2·s) to 1600 μmol/(m2·s) varied slower than that beyond this range for five species.Besides,three broad-leaved plants(plants 3,4,and 5) were found to have the higher net photosynthetic rate than coniferous plant (plant 1) and lanceleaf plant (plant 2) (Fig.4).
Response curves ofgsandEwere more irregular,although peaks can still be found in most cases.Instead,some of these peak values were not found in the condition with PAR equal to 1000 μmol/(m2·s),or even more than one peak appearing.Ciis the only physiological index that decreased with the increase of PAR,and its minimum concentrated under the condition when PAR was about 1000 μmol/(m2·s),and showed little differences overall.
Unimodal curves of net photosynthetic rate of five species of plants under five setting PAR magnitudes are similar as the daily variation curve of plant canopy net photosynthetic rate from 8:00 to 14:00 under sunny condition [44],yet the natural variation has larger extent.Even though plants always have another peak of net photosynthetic rate at 16:00,it could be ignored for the reason that the second peak is much smaller than the first one [45].In addition,effects of soil moisture on the results also tended to be overlooked due to the fact that measurements of photosynthetic characteristics of each group were carried out in the case of near-continuous.Therefore,the modified maximum of net photosynthetic rate of each plant normally occurred when the PAR (RPA)was 1000 μmol/(m2·s) is persuasive.The little variation of photosynthetic rate probably results in the controlling of other environmental factors.Among species,plant 3 has the highest net photosynthetic rate as a broad-leaved plant with the largest single leaf area of all,which matches the results of POORTER and REMKES [46].

Fig.3 Monthly photosynthetically active radiation from 8:00 to 18:00 for six months during the entire experiment period between June and November:(a) June;(b) July;(c) August;(d) September;(e) October;(f) November
3.2 Precipitation and splash erosion
The amount of splash erosion was little and was significantly correlated with the precipitation (Fig.5).Splash erosion under the five species of plants increased with the increment of precipitation.Fitting results showed that soil under plant 1 supplied the maximum splash erosion in the condition of precipitation,while splash erosion of plant 4is the least of all through precipitation;But overall,the differences of splash erosion among five species are close to each other.
3.3 Response of leaf net photosynthetic rate in different precipitation events
Obvious changes of plant photosynthesis did not appear immediately (Fig.6).The bottom values of them came out 10-16 h later and returned to their normal values before the 40th hour since the beginning of our measurement.Plants 1 and 2 had larger bottom values than the other three species;and they turned back slower too,although the bottom of them came almost simultaneously;the recovery times of the left three species were nearly 10 h in advance.
Analyses of the relationship between precipitation and variations of leaf net photosynthetic rate were carried out in the condition withRPA=1000 μmol/(m2·s).The net photosynthetic rate reached a relatively stable peak in this very condition,and the results could represent enrichment process of the single plant dry matter more exactly.

Fig.4 Light response curves of plant physiological indices of select species:(a) Net photosynthetic rate;(b) Stomatal conductance;(c) Transpiration rate;(d) Intercellular CO2concentration (1—Cunninghamia lanceolata;2—Phyllostachys pubescens;3—Gordonia acuminate;4—Neolitsea aurata;5—Symplocos setchuensis)

Fig.5 Effect of precipitation on extent of splash erosion of different plant species
The effects of precipitation on leaf net photosynthetic rate of five different species plants were substantially the same (Fig.7).The net photosynthetic rate decreased more obviously in more intense precipitation events.Net photosynthetic rate of coniferous plant and lanceleaf plant were affected more pronounced and values of their reductions reached about 1 μmol/(m2·s).
Comparison through linear fitting and logarithmic fitting of net photosynthetic rate variations with precipitation indicated that differences emerged in the correlation between net photosynthetic rate variation and precipitation;linear fitting of the correlation was better in coniferous plant and lanceleaf plant,and logarithmic fitting was more applicable for the correlation in broadleaved plants.Moreover,from the overall results,net photosynthetic rate variation in coniferous plant was the largest and the opposite situation appeared in those broad-leaved plants.Among three broad-leaved plants,plants 4 and 5 with smaller single leaf area were less affected than plant 3 with larger single leaf area by precipitation.
Further investigation on the relevance between net photosynthetic rate variation and precipitation was evaluated through a calculation of variation threshold in the logarithmic fitting curve that net photosynthetic rate changes with precipitation in each species of plant,and to find out the point at which the linear fitting curve and the logarithmic fitting curve are tangent (Table 2).The thresholds of the effect of precipitation on coniferous and lanceleaf plants (-17.00 mm) were lower than those on broad-leaved plants;they are about 11.00 mm for plant 3 and approximately 9.00 mm for plant 4 and plant 5.

Fig.6 Dynamic variations of 48 h of leaf net photosynthetic rate of five species of plant after 76 precipitation events:(a) June;(b) July;(c) August;(d) September;(e) October

Fig.7 Relationship between precipitation and variation of leaf net photosynthetic rate for five plant species when RPA=1000 μmol/(m2·s) and two kinds of fitting were applied for analysis:(a) Linear fitting;(b) Logarithmic fitting

Table 2 Threshold of variations of plant leaf net photosynthetic rate accompanied with precipitation increased
The threshold of the influence of precipitation on plant leaf net photosynthetic rate is helpful to judge the flexibility and stability of plant photosynthesis to precipitation.For these five species of plants,reduction of net photosynthetic rate gradually decreased when the extent of precipitation exceeded the threshold,which means that the net photosynthetic rate began to stabilize when rainfall reached the threshold (Table 3).Therefore,getting the threshold is of particular significance,because it could serve as an indicator of resistance of different species on precipitation.In our opinion,the lower the threshold is,the better the of tolerance corresponding species that has to adapt to the circumstances of different intensities of precipitation.

Table 3 Linear fitting of relationship between plant leaf net photosynthetic rate variations and precipitation increment by using threshold for boundary (A larger absolute value of the slope of linear fitting line represents a faster decline trend of plant net photosynthetic rate)
3.4 Dry matter accumulation of single plant
Influence of precipitation on entire single plant dry matter accumulation status of five species was analyzed by comparing the differences of dry matter accumulation ratio between group 1 (controlled group) and group 2(Fig.8).
Plant dry matter accumulation in shoots was far greater than that in roots.In this work,precipitation was proved to make negative impacts on young plant dry accumulation.Dry matter accumulation in roots ofplant 2almost halved due to the effects of precipitation;moreover,roots dry matter accumulation ofplant1 reduced by nearly two-thirds,and shoots of them were influenced relatively large as well.However,the influence of precipitation on dry matter accumulation of shoots and roots of three broad-leaved species of plants was much less than the two species previously mentioned.
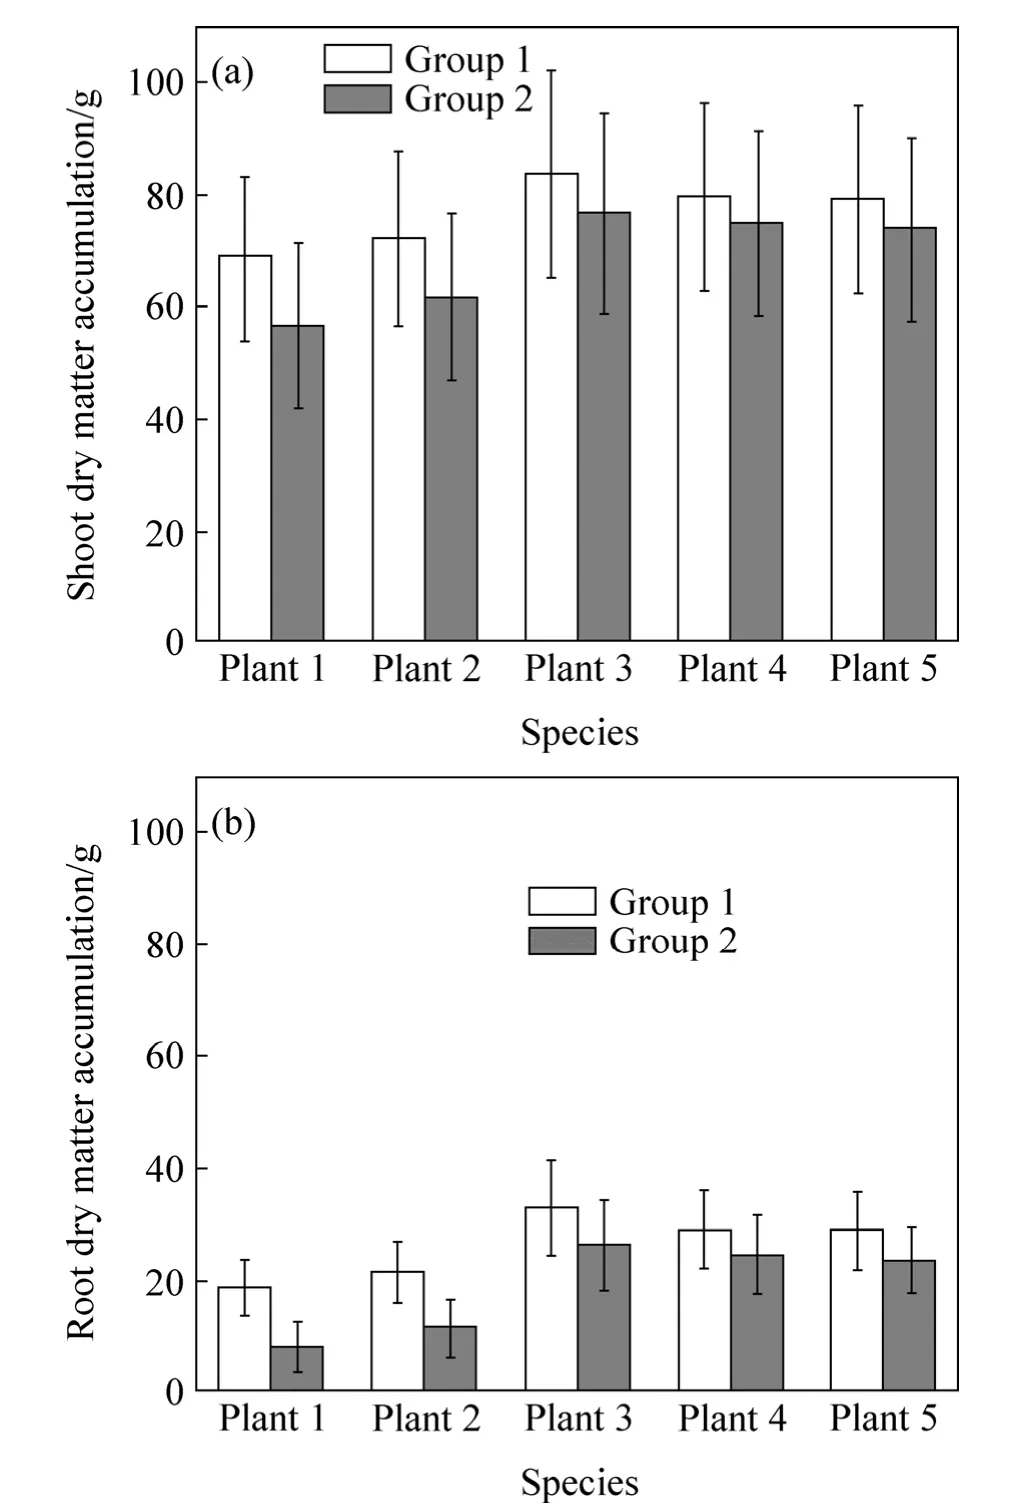
Fig.8 Comparison of dry matter accumulation under conditions of both non-precipitation (Group 1) and precipitation (Group 2)of shoots and roots of five species
3.5 Improving estimation of forest biomass accumulation status by using precipitation and soil erosion within forest itself
Dry matter accumulation was found varied with photosynthesis when plant was influenced by some external conditions,such as,water environment,nutrient adequacy [47-49].In this work,the status of dry matter accumulation of single plant looked like to be related to precipitation conditions,that is the less dry mass in Group 2.In the forest,a traditional way to calculate net primary productivity is to use some ecological models[50-51].We cannot deny the validity of them,but they ignored the negative effects of precipitation at least.If our hypothesis is true,we can use the data of precipitation and soil splash erosion to add a section,which could improve the accuracy of the abovementioned estimates.
The estimation of plant dry matter accumulation that added new section was closer to the actual value in all five species (Fig.9).The differences of these two estimation methods were small except in plant 3.We prefer to believe the estimation results because the accumulation rate of plant dry matter in summer was bigger than that in autumn,which meets the laws of nature;but we are still lack of data on interannual scale to prove our statement furthermore,which requires continued study and data.
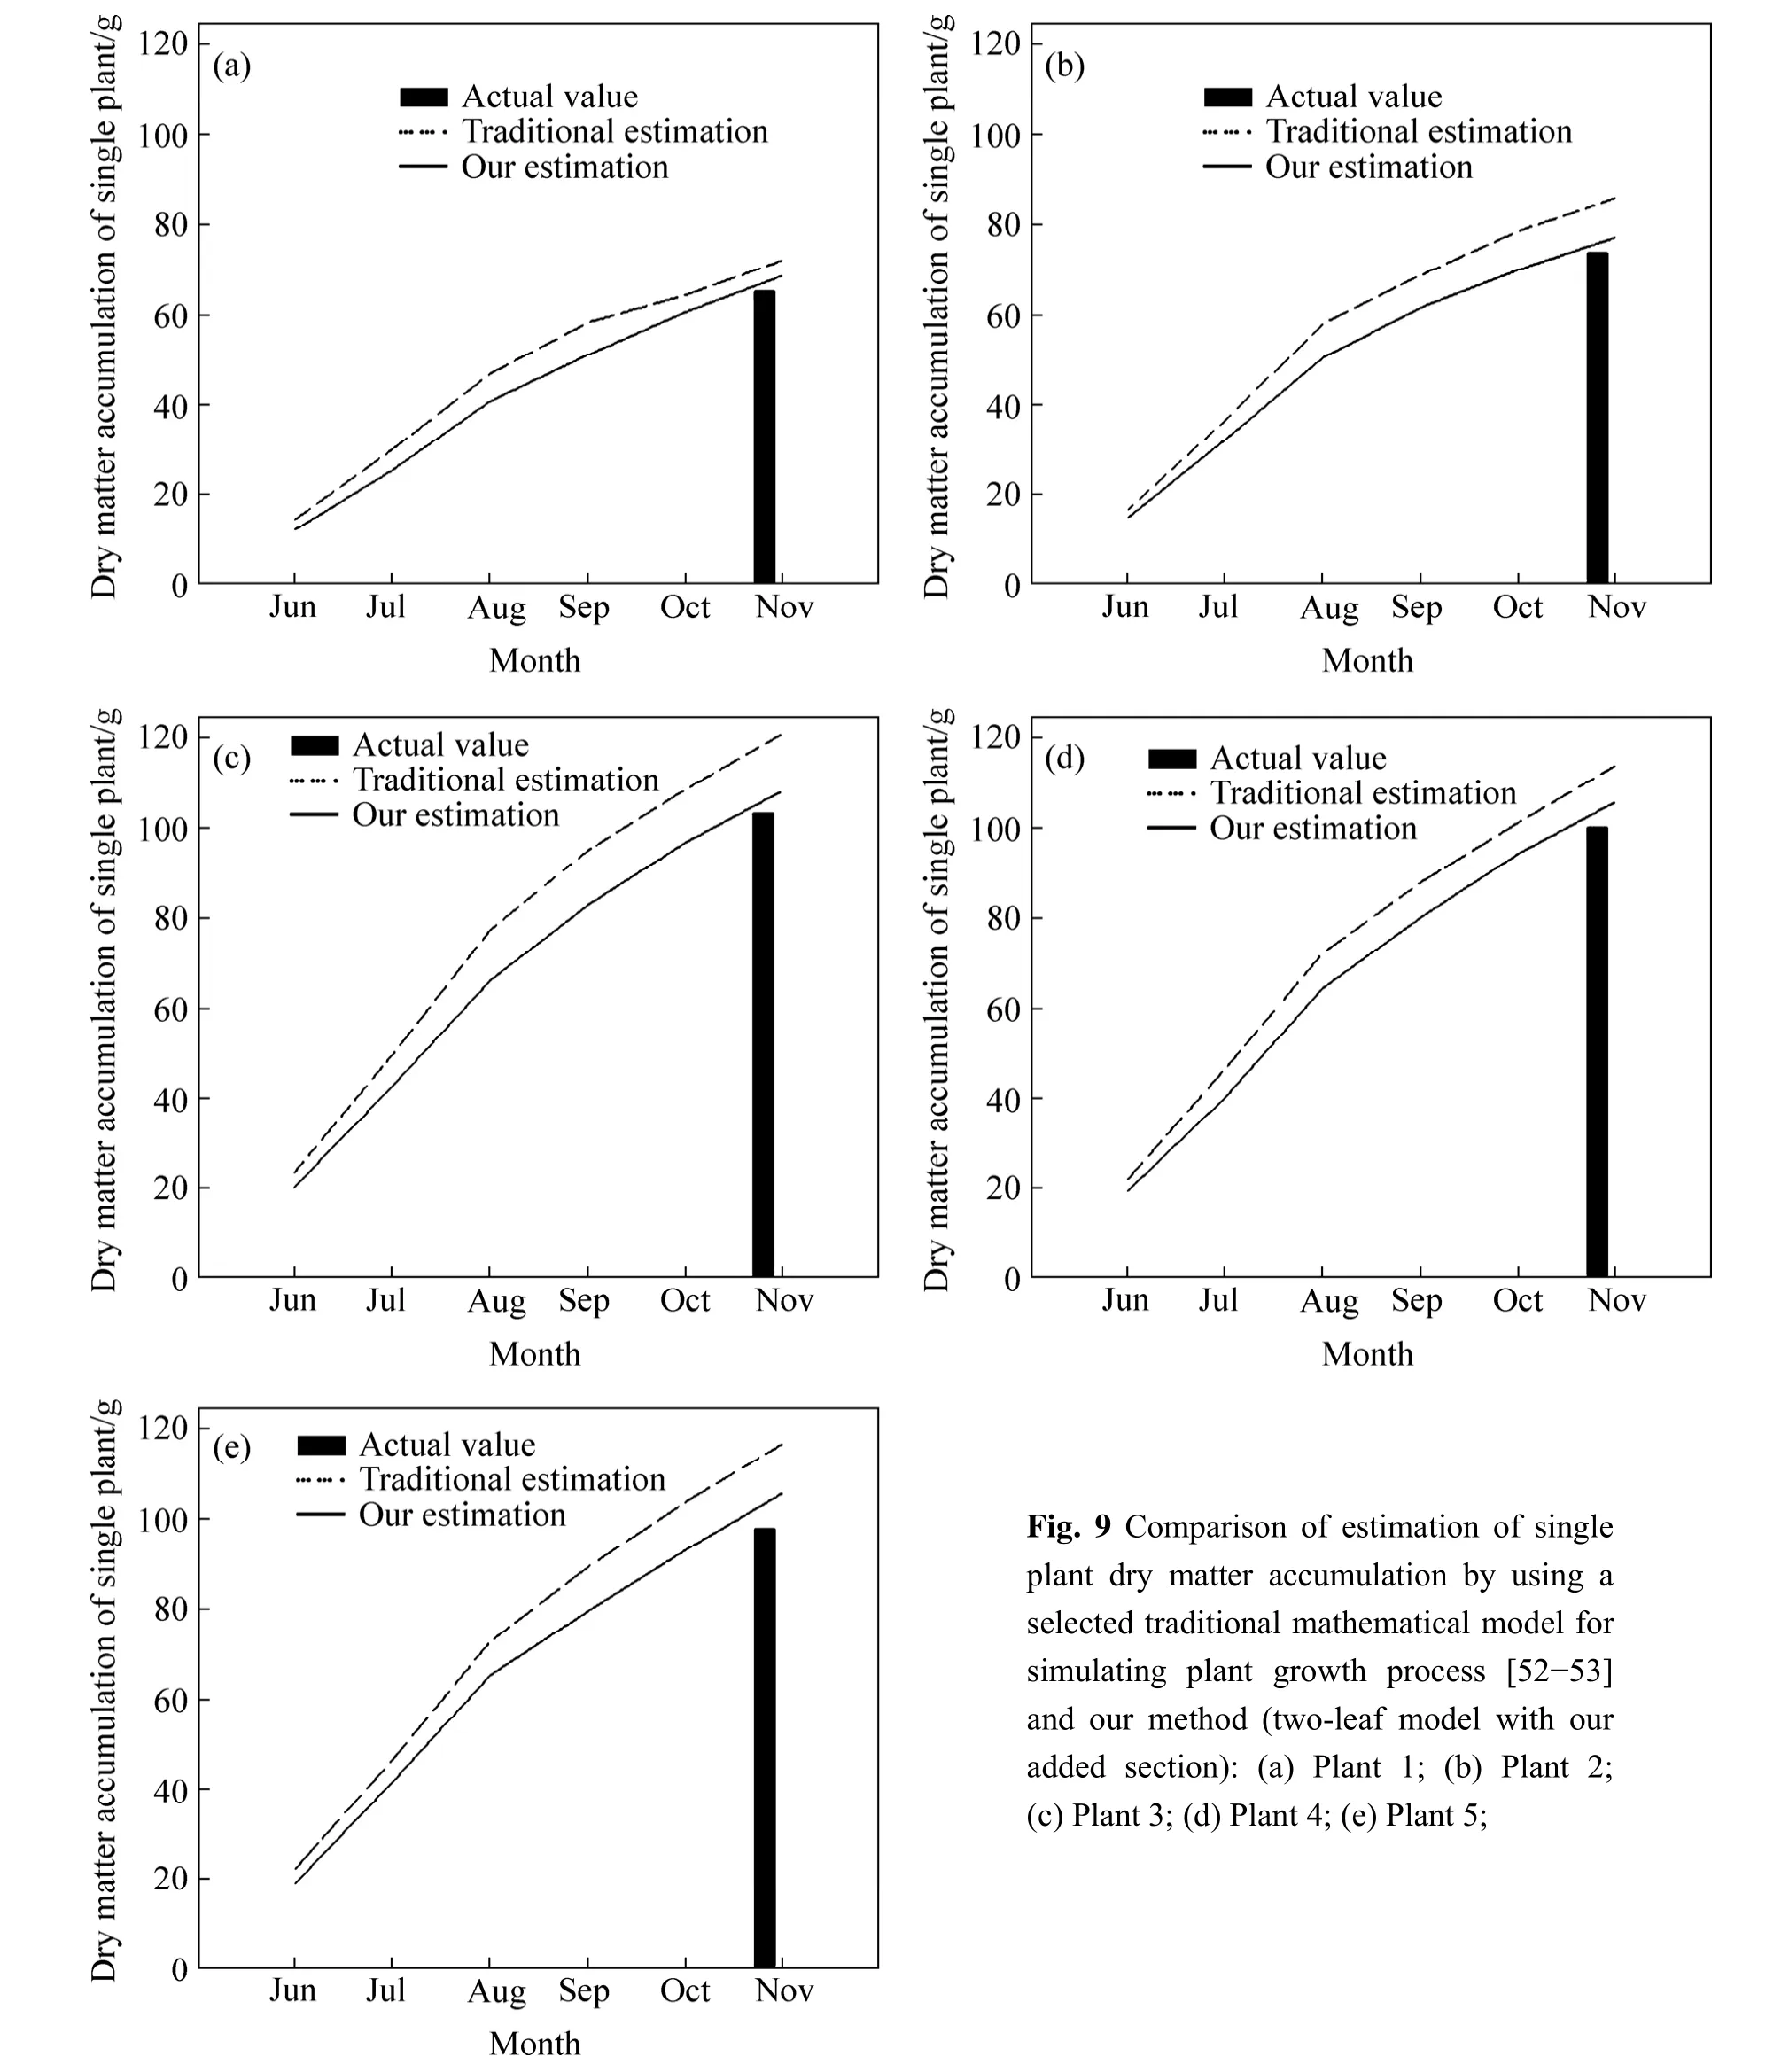
Fig.9 Comparison of estimation of single plant dry matter accumulation by using a selected traditional mathematical model for simulating plant growth process [52-53]and our method (two-leaf model with our added section):(a) Plant 1;(b) Plant 2;(c) Plant 3;(d) Plant 4;(e) Plant 5;
4 Conclusions
Precipitation has negative impact on the photosynthesis of plants to some extent,and this influence is different for each species.Although we haven’t found a convincing evidence to prove of that it is related with plant leaf shape or something else,broad-leaved species seemed to be affected less than coniferous and lanceleaf species,and net photosynthetic rate of them varied less and returned back faster to the normal level.Moreover,the statistical results show that the precipitation impacts the dry matter accumulation of these young plants.Based on this,we assume a section boldly,and add this to the traditional method of estimation of plant dry mass.Preliminary calculations suggest that our work play a role in a certain degree of correction to the traditional approach.
Acknowledgements
We are grateful to Chongqing Forestry Administration for the permission of our sampling and transplanting in Jinyunshan National Nature Reserve,to Bureau of Jinyunshan National Nature Reserve for the venues supplement and logistical support during our research.Moreover,we thank Dr.John S.Richardson and his lab team,Canada,for their help of this work.
[1]WANG Hui,LIU Shi-rong,MO Jiang-ming,WANG Jing-xin,MAKESCHIN F,WOLFF M.Soil organic carbon stock and chemical composition in four plantations of indigenous tree species in subtropical China [J].Ecological Research,2010,25(6):1071-1079.
[2]SVOMA B M,KRAHENBUHL D S,BUSH C E,MALLOY J W,WHITE J R,WAGNER M A,PACE M B,DEBIASSE K,SELOVER N J,BALLING R C Jr,CERVENY R S.Expansion of the northern hemisphere subtropical high pressure belt:Trends and linkages to precipitation and drought [J].Physical Geography,2013,34(3):174-187.
[3]ENOKI T,ABE A.Saplings distribution in relation to topography and canopy openness in an evergreen broad-leaved forest [J].Plant Ecology,2004,173(2):283-291.
[4]ZHU Wan-ze,CHENG Song,CAI Xiao-hu,HE Fei,WANG Jin-xi.Changes in plant species diversity along a chronosequence of vegetation restoration in the humid evergreen broad-leaved forest in the Rainy Zone of West China [J].Ecological Research,2009,24(2):315-325.
[5]WANG Zhen-hong,YANG Cheng-bo,YANG Li-mei,ZHOU Zi-zong,RAO Jing,YUAN Li,LI Ju.Relationship and its ecological significance between plant species diversity and ecosystem function of soil conservation in semi-humid evergreen forests,Yunnan Province,China [J].Frontiers of Forestry in China,2007,2(1):18-27.
[6]LI Yang,WANG Bai-tian,RAO Liang-yi,WANG Yu-jie.Research on water conservation function of typical forests in Jinyun Mountain[J].Agricultural Science &Technology,2012,13(1):181-188.
[7]WANG Xun-ming,ZHANG Cai-xia,HASI E,DONG Zhi-bao.Has the Three Norths Forest Shelterbelt Program solved the desertification and dust storm problems in arid and semiarid China[J].Journal of Arid Environments,2010,74(1):13-22.
[8]TOROMO A K,KIPKORIR E C,SHITOTE S M,KIBIIY J K.Can shelterbelts improve sprinkler irrigation performance under windy semi arid conditions [J].Irrigation and Drainage Systems,2011,25(4):335-345.
[9]KORT J,BANK G,POMEROY J,FANG Xing.Effects of shelterbelts on snow distribution and sublimation [J].Agroforestry Systems,2012,86(3):335-344.
[10]WHELPDALE D M,SUMMERS P W,SANHUEZA E.A global overview of atmospheric acid deposition fluxes [J].Environmental Monitoring and Assessment,1997,48(3):217-247.
[11]DORE A J,MOUSAVI-BAYGI M,SMITH R I,HALL J,FOWLER D,CHOULARTON T W.A model of annual orographic precipitation and acid deposition and its application to Snowdonia [J].Atmospheric Environment,2006,40(18):3316-3326.
[12]RAO L E,ALLEN E B.Combined effects of precipitation and nitrogen deposition on native and invasive winter annual production in California deserts [J].Oecologia,2010,162(4):1035-1046.
[13]EWE S M L,GAISER E E,CHILDERS D L,IWANIEC D,RIVERA-MONROY V H,TWILLEY R R.Spatial and temporal patterns of aboveground net primary productivity (ANPP) along two freshwater-estuarine transects in the Florida Coastal Everglades [J].Hydrobiologia,2006,569(1):459-474.
[14]LLOYD J,SHIBISTOVA O,ZOLOTOUKHINE D,KOLLE O,ARNETH A,WIRTH C,STYLES J M,TCHEBAKOVA N M,SCHULZE E D.Seasonal and annual variations in the photosynthetic productivity and carbon balance of a central Siberian pine forest [J].Tellus Series B-Chemical and Physical Meteorology,2002,54(5):590-610.
[15]OGUTU B O,DASH J,DAWSON T P.Developing a diagnostic model for estimating terrestrial vegetation gross primary productivity using the photosynthetic quantum yield and earth observation data [J].Global Change Biology,2013,19(9):2878-2892.
[16]FLEXAS J,MEDRANO H.Drought-inhibition of photosynthesis in C3 plants:Stomatal and non-stomatal limitations revisited [J].Annuals of Botany,2002,89(2):183-189.
[17]SILVA E N,RIBEIRO R V,FERREIRA-SILVA S L,VIÉGAS R A,SILVEIRA J A G.Comparative effects of salinity and water stress on photosynthesis,water relations and growth ofJatropha curcasplant[J].Journal of Arid Environment,2010,74(10):1130-1137.
[18]POORTER H,NIKLAS K J,REICH P B,OLEKSYN J,POOT P,MOMMER L.Biomass allocation to leaves,stems and roots:Meta-analyses of interspecific variation and environmental control[J].New Phytologist,2012,193(1):30-50.
[19]GIBBS J,GREENWAY H.The role of biomass allocation in the growth response of plants to different levels of light,CO2,nutrients and water:a quantitative review [J].Functional Plant Biology,2003,1(1):1-47.
[20]TERASHIMA I,HANBA Y T,THOLEN D,NIINEMETS Ü.Leaf functional anatomy in relation to photosynthesis [J].Plant Physiology,2011,155 (1):108-116.
[21]TOBITA H,UTSUGI H,KITAO M,KAYAMA M,UEMURA A,KITAOKA S,MARUYAMA Y.Variation in photoinhibition amongSasa senanensis,Quercus mongolica,andAcer monoin the understory of a deciduous broad-leaved forest exposed to canopy gaps caused by typhoons [J].Trees-Structure and Function,2010,24(2):307-319.
[22]MEIER I C,LEUSCHNER C.Leaf size and leaf area index inFagus sylvaticaForests:competing effects of precipitation,temperature,and nitrogen availability [J].Ecosystems,2008,11(5):655-669.
[23]ISHIBASHI M,TERASHIMA I.Effects of continuous leaf wetness on photosynthesis:adverse aspects of rainfall [J].Plant Cell and Environment,1995,18(4):431-438.
[24]GRIGAL D F.Effects of extensive forest management on soil productivity [J].Forest Ecology and Management,2000,138(1):167-185.
[25]EKBLAD A,HOGBERG P.Natural abundance of13C in CO2respired from forest soils reveals speed of link between tree photosynthesis and root respiration [J].Oecologia,2001,127(3):305-308.
[26]LI Shu-wen,PEZESHKI S R,GOODWIN S.Effects of soil moisture regimes on photosynthesis and growth in cattail (Typha latifolia) [J].Acta Oecologica-International Journal of Ecology,2004,25(1):17-22.
[27]REGÜÉS D,GALLART F.Seasonal patterns of runoff and erosion responses to simulated rainfall in a badland area in Mediterranean mountain conditions (Vallcebre,southeastern Pyrenees) [J].Earth Surface Processes and Landforms,2004,29(6):755-767.
[28]O’NEAL M R,NEARING M A,VINING R C,SOUTHWORTH J,PFEIFER R A.Climate change impacts on soil erosion in Midwest United States with changes in crop management [J].Catena,2005,61(2):165-184.
[29]SCHOLZ G,QUINTON J N,STRAUSS P.Soil erosion from sugar beet in Central Europe in response to climate change induced seasonal precipitation variations [J].Catena,2008,72(1):91-105.
[30]FOOT K,MORGAN R P C.The role of leaf inclination,leaf orientation and plant canopy architecture in soil particle detachment by raindrops [J].Earth Surface Processes and Landforms,2005,30(12):1509-1520.
[31]CHEN Shu-tao,SHEN Xiao-shuai,HU Zheng-hua,CHEN Hai-shan,SHI Yan-shu,LIU Yan.Effects of simulated acid rain on soil CO2emission in a secondary forest in subtropical China [J].Geoderma,2012,189(11):65-71.
[32]China meteorological administration.China Climate Bulletin of 2012[EB/OL].[2013-11-28].http://zwgk.cma.gov.cn/web/index_2.jsp?sid=101/.
[33]Ministry of environmental protection the People’s Republic of China.Three Gorges Project Ecological and Environmental Monitoring Bulletin of 2005 [EB/OL].[2013-11-28].http://www.mep.gov.cn/gzfw/xzzx/wdxz/200506/P02008011822993524 6591.pdf/.
[34]Ministry of environmental protection the People’s Republic of China.Three Gorges Project Ecological and Environmental Monitoring Bulletin of 2011 [EB/OL].[2013-11-28].http://www.mep.gov.cn/gzfw/xzzx/wdxz/201206/P0201206135432573 46492.pdf/.
[35]FAO/ISRIC/ISSS.World reference base for soil resources [R].Rome:ISSS-ISRIC-FAO,1998.
[36]SCHNEIDER G W,CHILDERS N F.Influence of soil moisture on photosynthesis,respiration,and transpiration of apple leaves [J].Plant Physiology,1941,16(3):565-583.
[37]SHIMSHI D.Effect of soil moisture and phenylmercuric acetate upon stomatal aperture,transpiration,and photosynthesis [J].Plant Physiology,1963,38(2),713-721.
[38]EL-SHARKAWY M A.International research on cassava photosynthesis,productivity,eco-physiology,and responses to environmental stresses in the tropics [J].Photosynthetica,2007,45(3):399.
[39]YAMORI W,HIKOSAKA K,WAY D A.Temperature response of photosynthesis in C3,C4,and CAM plants:Temperature acclimation and temperature adaptation [J].Photosynthesis Research,2014,119(1):101-117.
[40]DASHTI N,ZHANG F,HYNES R,SMITH D L.Application of plant growth-promoting rhizobacteria to soybean (Glycine max[L]Merr.) increases protein and dry matter yield under short-season conditions [J].Plant and Soil,1997,188(1):33-41.
[41]WILSON P J,TOMPSON K,HODGSON J G.Specific leaf area and leaf dry matter content as alternative predictors of plant strategies [J].New Phytologist,1999,143(1):155-162.
[42]GANIER E,SHIPLEY B,ROUMET C,LAURENT G.A standardized protocol for the determination of specific leaf area and leaf dry matter content [J].Functional Ecology,2001,15(5):688-695.
[43]HEUVELINK E.Dry matter partitioning in a tomato plant:One common assimilate pool [J].Journal of Experimental Botany,1995,46(8):1025-1033.
[44]HOLLINGER D Y.Canopy organization and foliage photosynthetic capacity in a broad-leaved evergreen montane forest [J].Functional Ecology,1989,3(1):53-62.
[45]JOHNSON I R,THORNLEY J H M.A model of instantaneous and daily canopy photosynthesis [J].Journal of Theoretical Biology,1984,107(4):531-545.
[46]POORTER H,REMKES C.Leaf area ratio and net assimilation rate of 24 wild species differing in relative growth rate [J].Oecologia,1990,83(4):553-559.
[47]CHARTZOULAKIS K,NOTISAKIS B,THERIOS I.Photosynthesis,plant growth and dry matter distribution in kiwifruit as influenced by water deficits [J].Irrigation Science,1993,14(1):1-5.
[48]MANDEL K G,SINHA A C.Nutrient management effects on light interception,photosynthesis,growth,dry-matter production and yield of Indian mustard (Brassica juncea) [J].Journal of Agronomy and Crop Science,2004,190(2):119-129.
[49]SOBRADO M A,TURNER N C.Photosynthesis,dry matter accumulation and distribution in the wild sunflowerHelianthus petiolarisand the cultivated sunflowerHelianthus annuusas influenced by water deficits [J].Oecologia,1986,69(2):181-187.
[50]CHEN J M.Optically-based methods for measuring seasonal variation of leaf area index in boreal conifer stands [J].Agricultural Forest Meteorology,1996,80(2):135-163.
[51]DAI Yong-jiu,DICKINSON R E,WANG Y P.A two-big-leaf model for canopy temperature,photosynthesis,and stomatal conductance[J].Journal of Climate,2004,17(12):2281-2299.
[52]OVERMAN A R.Model for accumulation of dry matter and plant nutrient elements by tobacco [J].Journal of Plant Nutrition,1999,22(1):81-92.
[53]OVERMAN A R,SCHOLTZ R V.Model for accumulation of dry matter and plant nutrients by corn [J].Communications in Soil Science and Plant Analysis,1999,30(15):2059-2081.
猜你喜欢
Chinese Physics B(2022年8期)2022-08-31
Plasma Science and Technology(2022年1期)2022-02-15
山西教育·招考(2021年5期)2021-11-30
山西教育·招考(2021年5期)2021-11-30
艺术评论(2017年7期)2017-09-07
做人与处世(2016年17期)2016-10-24
纺织服装流行趋势展望(2016年6期)2016-05-04
微型小说选刊(2015年35期)2015-11-18
三月三(2015年9期)2015-09-12
民间文学(2014年12期)2015-02-03
 Journal of Central South University2015年10期
- Journal of Central South University的其它文章
- Effect of wall temperature and random distribution of micro organic dust particles on their combustion parameters
- Structural features of substituted triazole-linked chalcone derivatives as antimalarial activities against D10 strains of Plasmodium falciparum:A QSAR approach