Simultaneous Determination of Six Banned Azo-Dyes in Soybean Products by HPLC-MS/MS
2015-04-18 02:43LIJuanDINGXiaomingLIUHongminZHANGYanbing
质谱学报 2015年3期
LI Juan, DING Xiao-ming, LIU Hong-min, ZHANG Yan-bing
(1.School of Pharmaceutical Sciences, Zhengzhou University, Zhengzhou 450001, China;2.New Drug Research&Development Center, Zhengzhou University, Zhengzhou 450001, China)
Simultaneous Determination of Six Banned Azo-Dyes in Soybean Products by HPLC-MS/MS
LI Juan1,2, DING Xiao-ming1, LIU Hong-min1,2, ZHANG Yan-bing1,2
(1.SchoolofPharmaceuticalSciences,ZhengzhouUniversity,Zhengzhou450001,China;2.NewDrugResearch&DevelopmentCenter,ZhengzhouUniversity,Zhengzhou450001,China)
A sensitive and efficient method was developed for the simultaneous determination of six azo-dyes (Chrysoidin, Para Red, Sudan I, SudanⅡ, SudanⅢ and Sudan Ⅳ) in soybean products using high performance liquid chromatography-tandem mass spectrometry (HPLC-MS/MS). The samples were extracted with a simple procedure using acetonitrile. The supernatant was directly analyzed by LC-MS/MS after centrifugation. The sample was separated on a Waters XTerra C18 column, and detected by MS/MS with the multiple reaction monitoring (MRM) mode. Matrix calibration was used for quantitative testing of the method. Good linearity is obtained over the range of 2-100 μg/L with a correlation coefficientR2>0.99. The recoveries are 93.9%-110.6% with good coefficients of variation of 3.1%-14.8%. Limit of detection (LOD) and limit of quantification (LOQ) for the six dyes are in the ranges of 0.03-0.75 μg/kg and 0.1-2.0 μg/kg, respectively. This method has been applied successfully for the determination of the six azo dyes in soybean products.
azo dyes; food analysis; high performance liquid chromatography-tandem mass spectrometry(HPLC-MS/MS); soybean products
Color is the first notable characteristic for food industries. Colorants are thereby often added to food for enhancing its visual aesthetics and promoting sales[1]. The use of synthetic organic dyes has been recognized as the most reliable and economical method of restoring or providing color to a processed product. Azo dyes are by far the most widely used synthetic colorants, characterized by chromophoric azo groups (-N=N-)[2]. Currently, there are over 3 000 azo dyes in use worldwide and they offer a wide spectrum of colors[2-3]. Examples of azo dyes include Sudan Ⅰ-Ⅳ, Para Red and Chrysoidin. Some azo dyes, especially the Sudan dyes and their degradation products, have been recognized to be carcinogens[4]and their presence at any level is not safe for the human.
Many analytical methods have been proposed for the quantitative determination of azo-dyes in foodstuffs. Such as, liquid chromatography with spectrophotometric[5], fluorimetric detection[6]and diode array detector[7]. Due to its high sensitivity, selectivity and minimal sample treatment required, liquid chromatography coupled to mass spectrometry (LC/MS) has become the preferred method for confirmatory analysis[8-10]. Liquid chromatography-tandem mass spectrometry(LC-MS/MS) combined with isotope dilution methods were described for the determination of Sudan dyes in foodstuff[11-12]. Some authors used internal standards[13-14]or standard addition techniques[15]in the analysis of Sudan dyes in order to improve their quantification.
Prior to the detection of the synthetic dyes, pretreatment of the real samples was necessary. Recently, one-step extraction by organic solvents was imported in the pretreatment of chilli products and spices before HPLC detection of synthetic dyes[16-17]. The determination of dye residues in chili products was studied using acetonitrile/H2O as the extraction solvent[18]. So far, most of the reported LC based methods focused on the determination of synthetic dyes in chili and spice samples. However, these methods are not suitable for determining dyes in bean matrix owing to the high protein content.
In this paper, an HPLC-MS/MS method was developed with one-step extraction procedure for the determination of six azo dyes in soybean products. The acetonitrile extraction method provided an efficient and convenient way of removing protein and other interferences from the sample. The extract solution can be analyzed directly with LC-MS/MS, thus, eliminate the complicated solid-phase extraction (SPE) cleanup step.
1 Experimental
1.1 Chemicals and Reagents
HPLC grade methanol and acetonitrile were purchased from J. T. Baker (USA). HPLC grade formic acid and ammonium acetate were from Sigma-Aldrich Co. Ltd. (Poole, UK). The water was purified and deionized by a water purify system (Millipore, Bedford, MA, USA). The solvents for HPLC were filtered by 0.45 μm nylon membrane (Whatman, UK) and degassed in an ultrasonic bath. Standards of Sudan Ⅰ-Ⅳ, Para Red and Chrysoidin were purchased from Sigma (St. Louis, MO, USA). The purities of all standards were more than 98%. The molecular structures of six azo-dyes are shown in Table 1.

Table 1 Chemical structures and tandem mass spectrometry parameters of the six dyes tested
* Qualifier ions
Stock solutions of all standard dyes were individually prepared in acetonitrile at 100 mg/L and stored at approximately -20 ℃ in the dark. Spiking and calibration standard mixtures at various concentrations were prepared by combining aliquots of individual stock solutions followed by dilution with acetonitrile-H2O (50∶50,V/V).
1.2 Sample Preparation
Sample treatment was as follows. Dye-spiked samples were prepared in a 15 mL centrifuge tube by mixing 2 g of each matrix with a series of the 6-dye mixed standard solutions at various concentrations, and 6 mL of acetonitrile were added. The tube was shaken by hand for 30 s in order to allow the sample to mix thoroughly with the solvent, and the extraction continued for 30 min in an ultrasonic bath. The extraction solution was centrifuged at 12 000 r/min for 10 min to sediment the solids. An aliquot (0.5 mL) of the extraction solution was filtered through a 0.22 μm nylon membrane syringe, then 5 μL of the solution was injected for detection.
1.3 Liquid Chromatography Conditions
Waters HPLC system (Milford, MA, USA) including a 2 695 separation module was controlled by Micromass Masslynx V4.1 software. Chromatographic separation was carried out by a Waters XTerra C18 RP column (2.1 mm × 150 mm×5 μm) and a binary gradient which included 5 mmol/L ammonium acetate buffer solution at pH 3.0 (mobile phase A) and methanol (mobile phase B). The linear gradient elution was programmed as follows: 0-2 min, 45%-100% B; 2%-10 min, 100% B; 10-15 min, 100%-45% B. The flow rate was set at 0.2 mL/min while the column temperature was maintained at 35 ℃. The injection volume was 5 μL.
1.4 Mass Spectrometry Conditions
A triple quadrupole mass spectrometer (Quattro-Micro, Waters, Manchester, UK) equipped with an electrospray source was used for detection in positive ion mode. The optimum conditions of the ESI interface for all target analytes were as follows: a capillary voltage of 3.0 kV, a source temperature of 120 ℃, and a dry temperature of 300 ℃. High purity nitrogen (N2) was used as both drying gas with a flow rate of 50 L/h and as nebulizing gas with a flow rate of 450 L/h. Argon was used as the collision gas during MS/MS analysis, and the pressure of the collision chamber was kept at 0.35 Pa. Multiple reaction monitoring (MRM) mode was used to monitor two fragment ions for each compound.
2 Results and Discussion
2.1 Optimization of Sample Pretreatment
The development of an efficient extraction procedure is the most important step for accurate determination of dyes in soybean products. Two organic solvents (methanol and acetonitrile) were evaluated in this experiment based on chemical properties of the six dyes. For bean curd and bean sauce, the efficiencies of methanol extraction for Sudan Ⅲ and Sudan Ⅳ were very low (their recoveries less than 35%), and acetonitrile showed good extraction efficiency in terms of recovery and reproducibility for the six dyes.
In this experiment, further purification of the extract solution with solid-phase extraction (Waters Oasis HLB cartridge) was also considered. With the extra SPE purification step, the chromatograms showed little improvement. These six dyes possess different chemical characteristics, especially Chrysoidin, which belongs to highly polar colorants, no single SPE column can achieve satisfactory retention and recovery performance for each dye. Thus, acetonitrile was chosen as the extraction solvent, and without SPE, the whole pretreatment process is very convenient and effective.
2.2 LC-MS/MS Analysis
The chromatographic behaviors were investigated using different mobile phases, including methanol/0.1% formic acid aqueous solution (a) and methanol/5 mmol/L ammonium acetate (pH 3.0) (b). The result showed that the signal of the analytes (especially Chrysoidin) obtained with methanol/5 mmol/L ammonium acetate (pH 3.0) was higher than that obtained with methanol/0.1% formic acid aqueous solution. Satisfactory separation and responses for all analytes were obtained under the gradient elution conditions described above. The cone voltages and collision energies used for MRM transitions of each compound were optimized to increase sensitivity, and the results have been listed in Table 1. MRM chromatograms of the analytes in a spiked bean curd are shown in Fig.1. The daughter-ion mass spectra of the analytes are shown in Fig.2. In our experiments, the daughter ions havingm/z121.0, 247.1, 127.9, 156.0, 196.2 and 224.2 were used for qualifier ions.
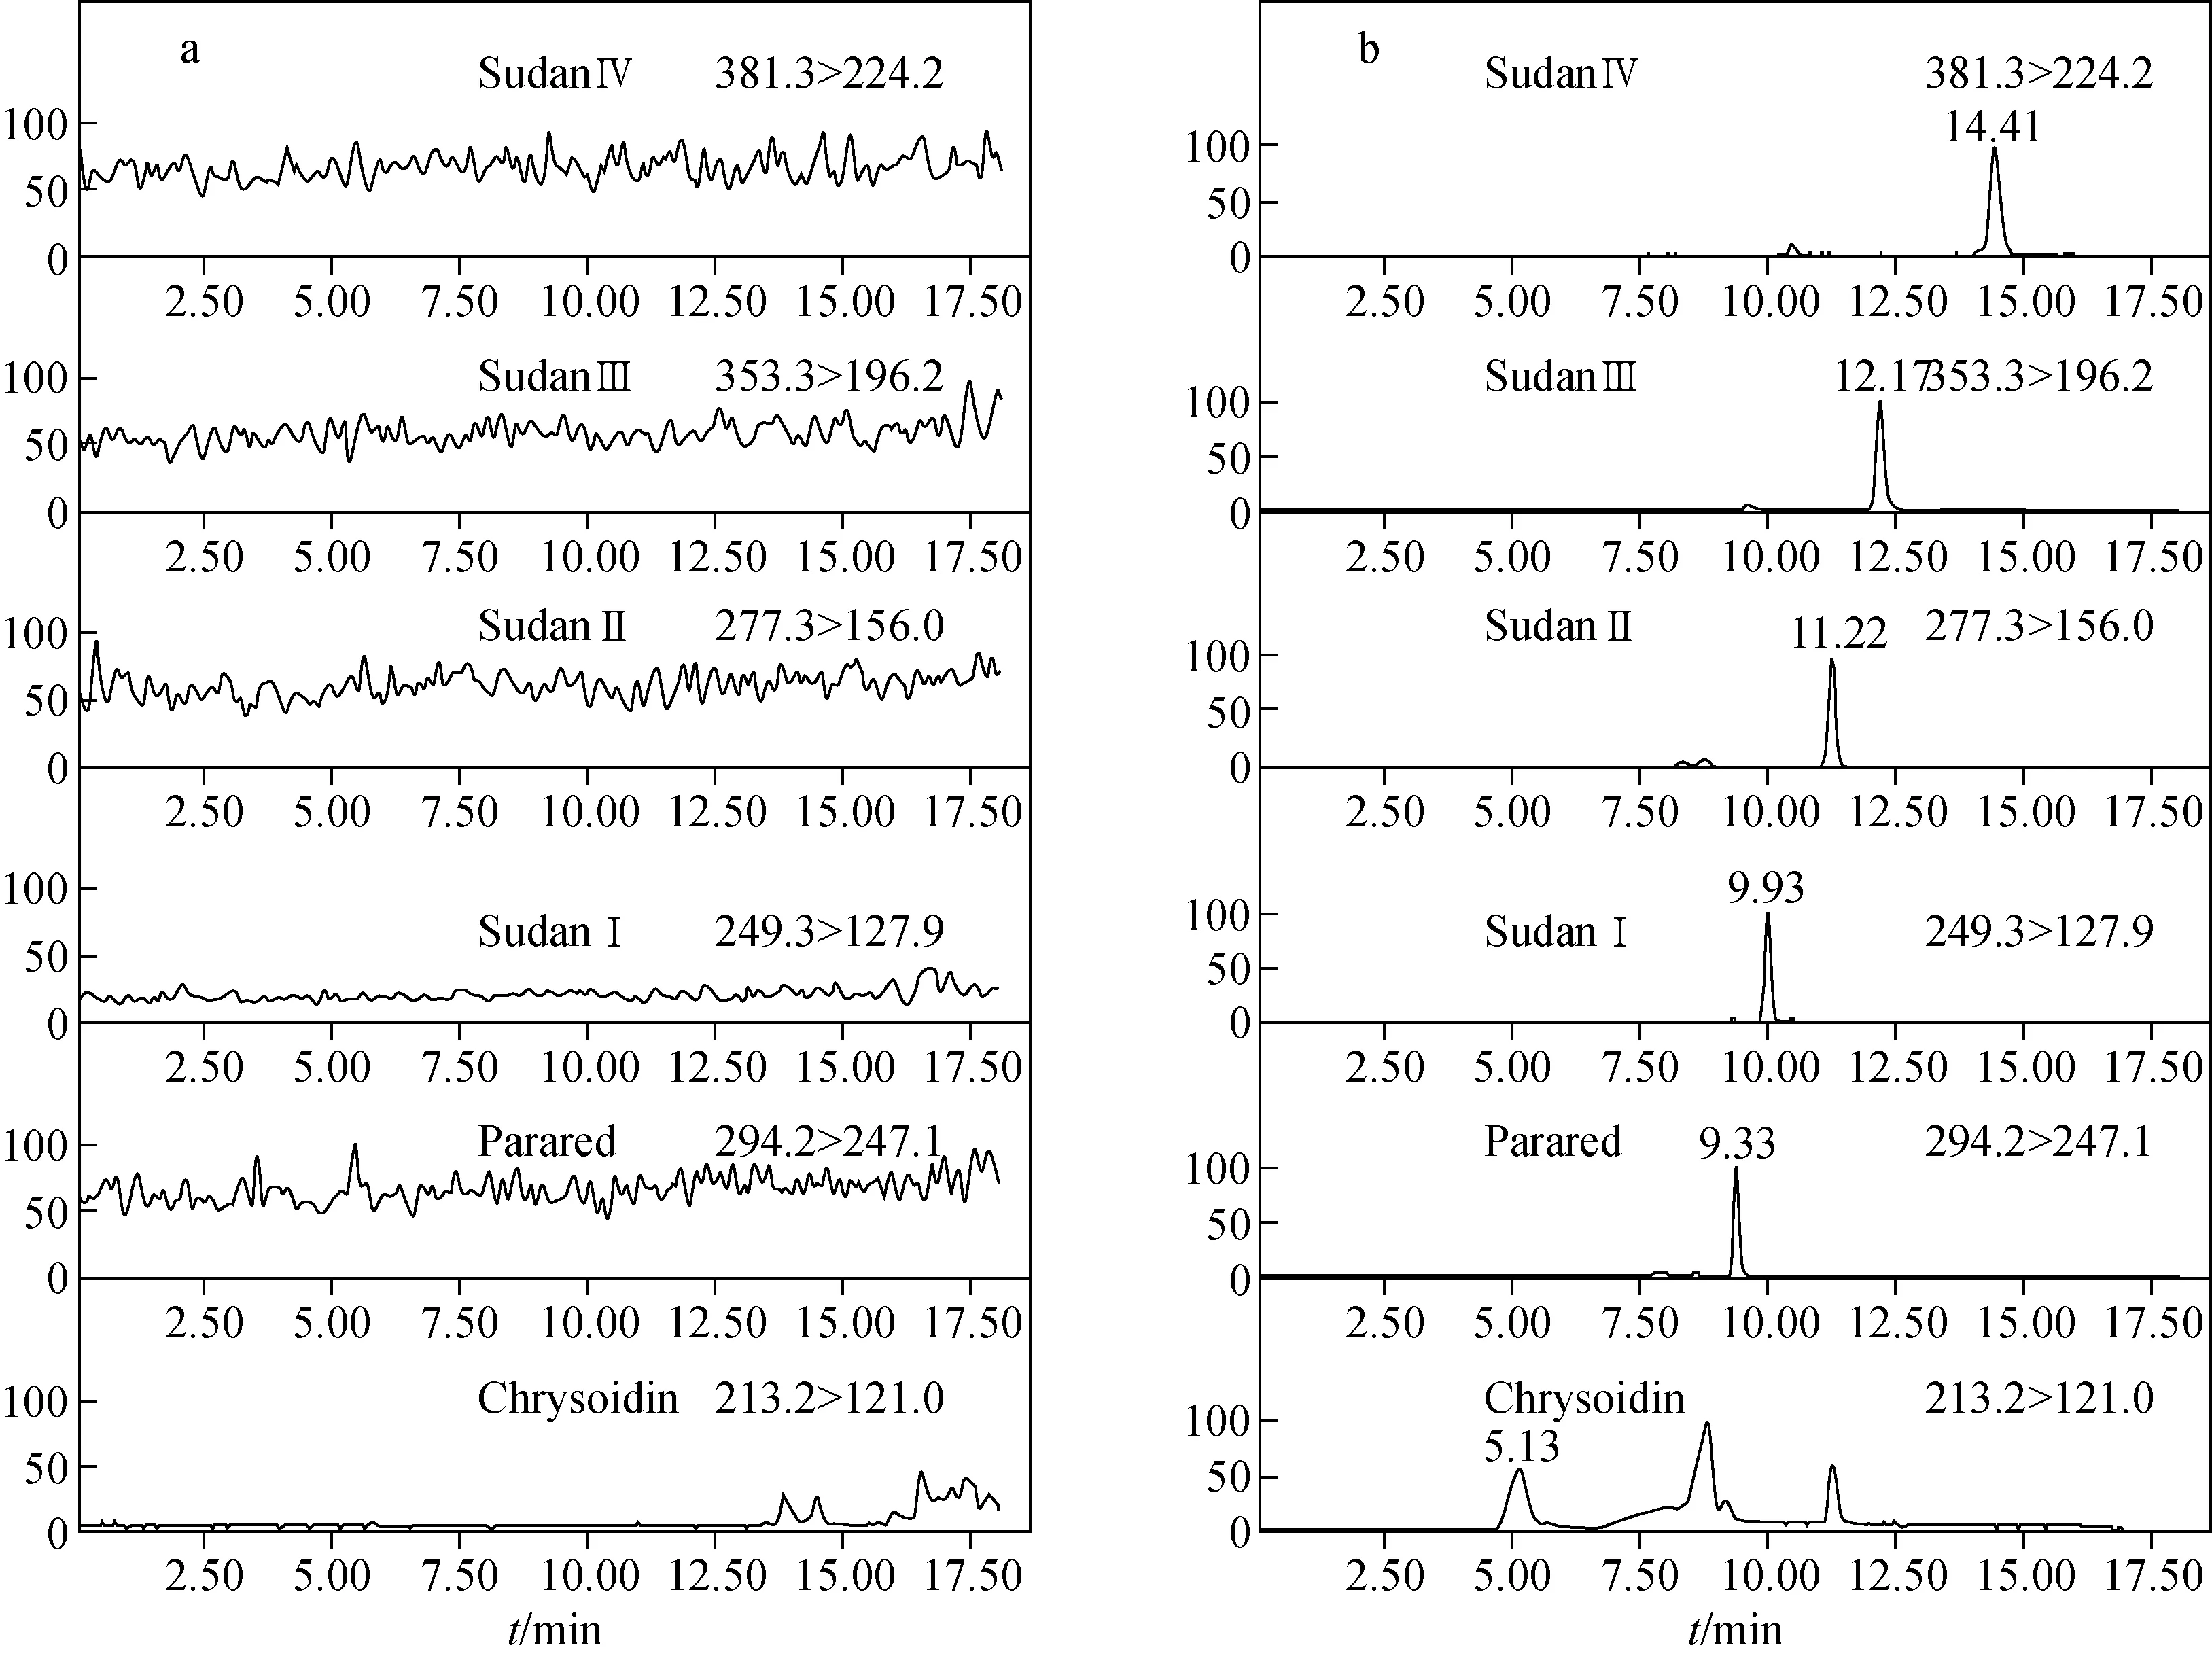
Fig.1 MRM chromatograms of blank bean sample (a) and bean curd spiked with dyes at 30 μg/kg (b)
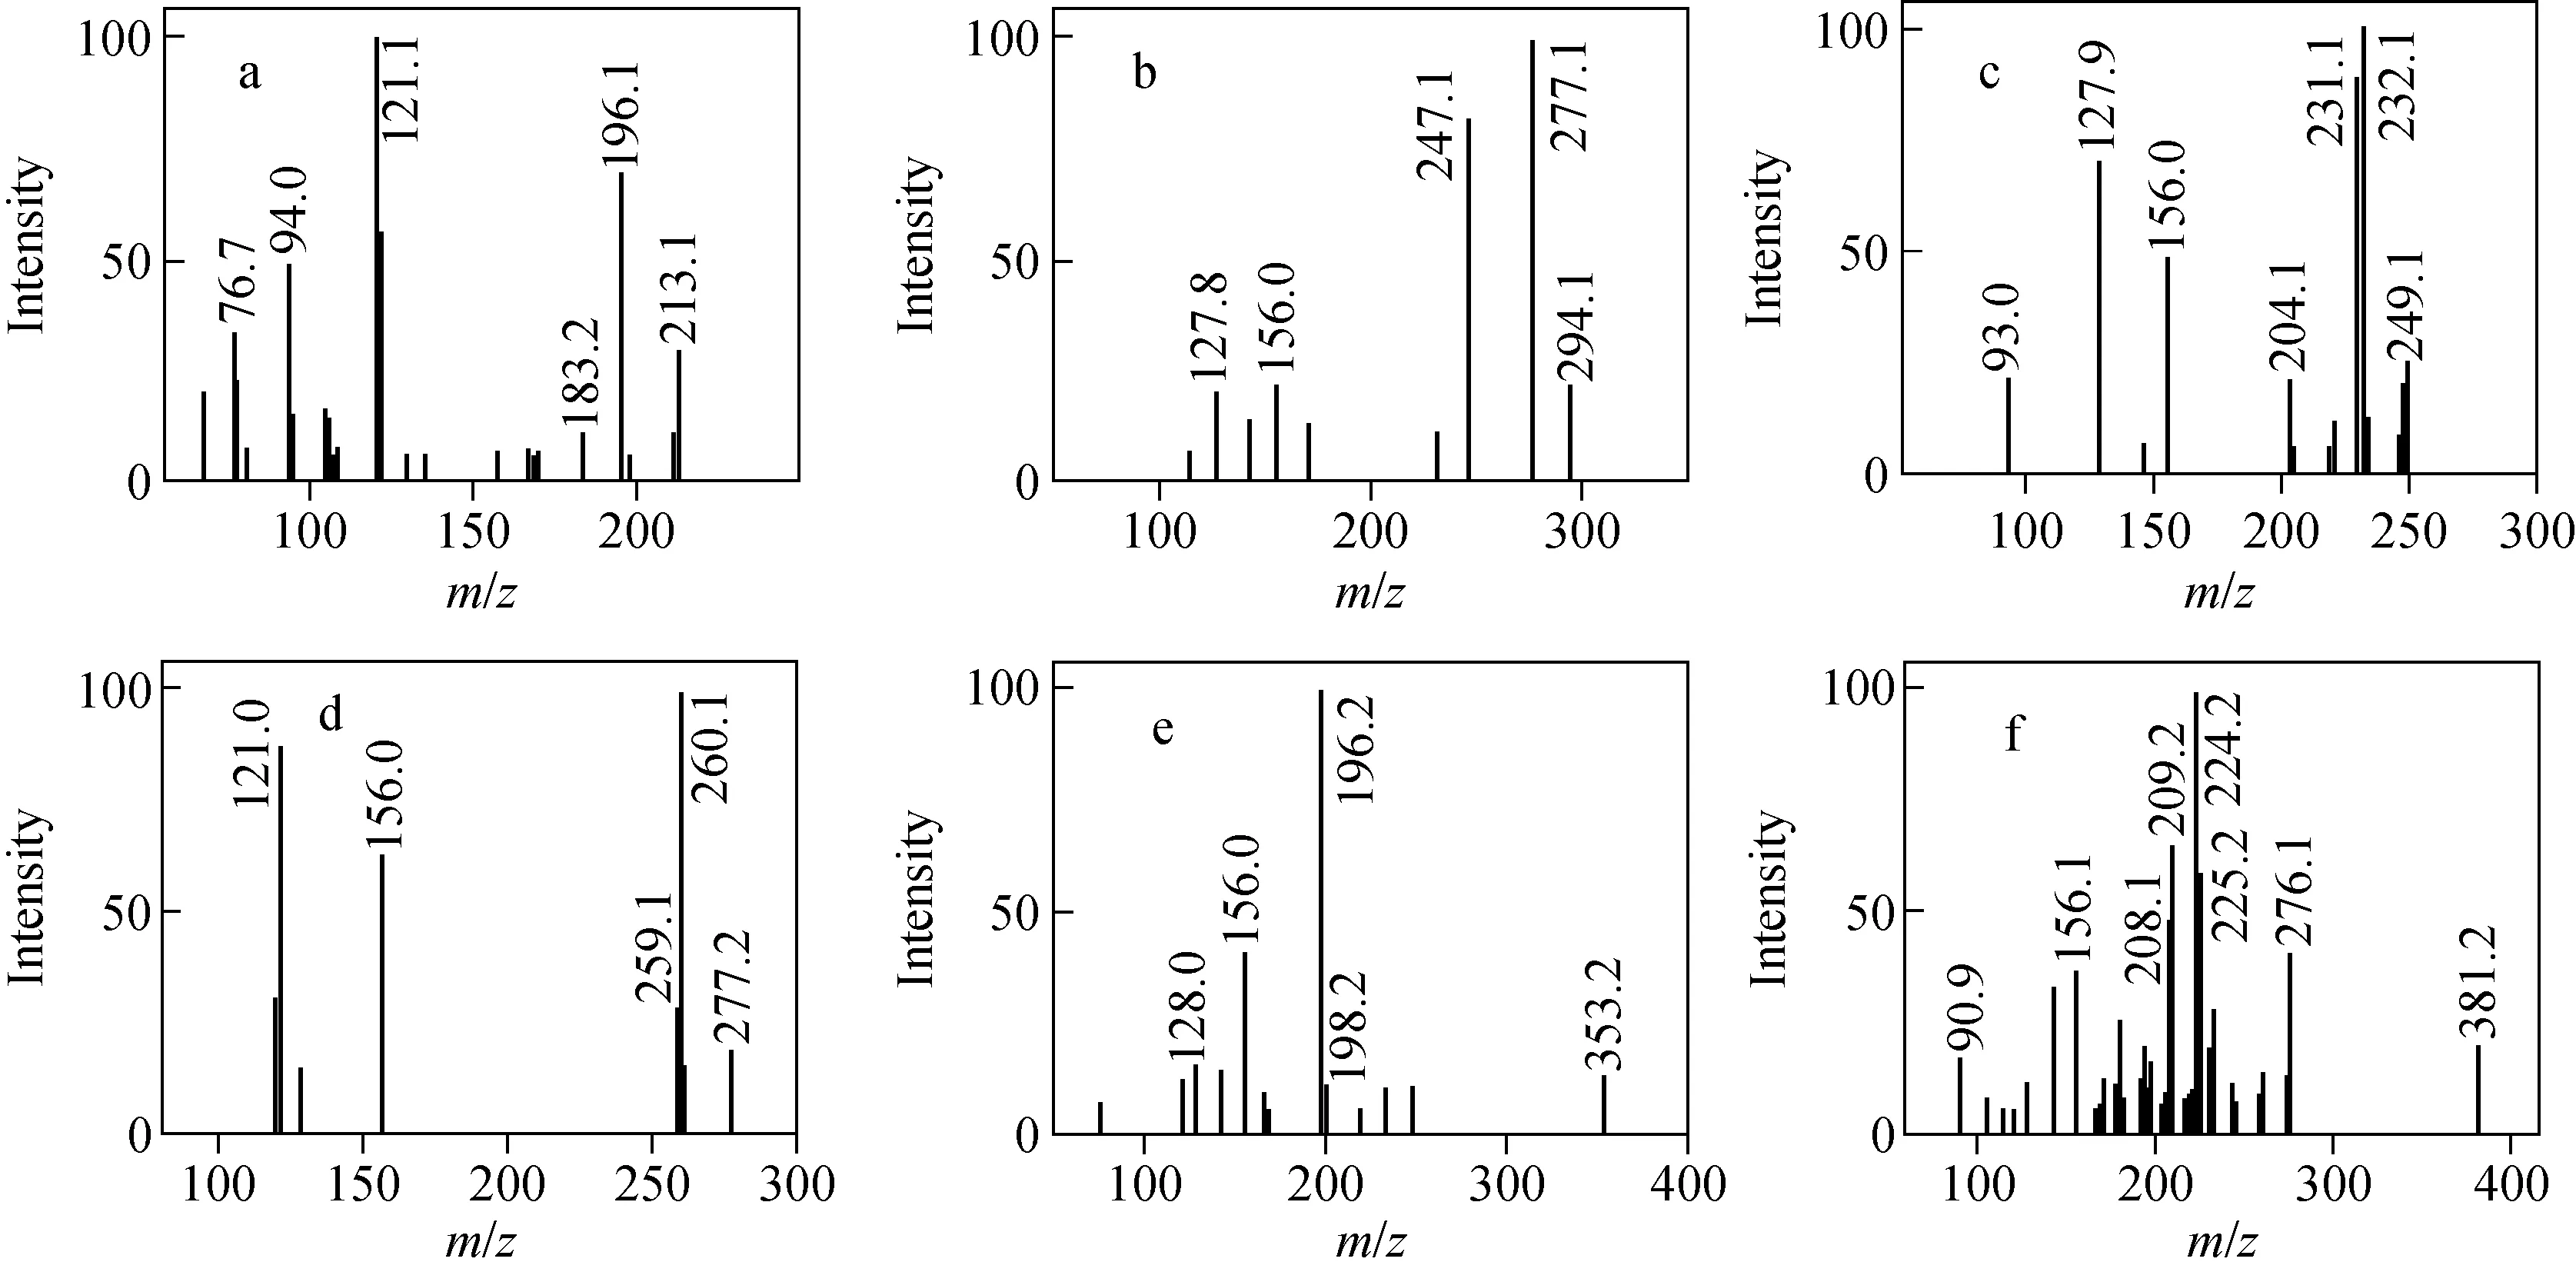
Fig.2 The daughter-ion mass spectra of Chrysoidin (a), Para Red (b), SudanⅠ (c), SudanⅡ (d), Sudan Ⅲ (e) and Sudan Ⅳ (f)
2.3 Method Validation
The selectivity of the method was investigated by observing potential interferences between the analytes and impurities in the sample extracts. Bean curd spiked at 30 μg/kg for all studied compounds were analyzed, and no significant interferences were observed at the corresponding retention time of the target analytes. The results shown in Fig.1 indicate that the present method has high selectivity for the six azo-dyes.
Linearity was evaluated using solvent and matrix matched calibration curves at six concentration levels (2, 5, 10, 20, 50 and 100 μg/L for Sudan (Ⅰ-Ⅳ), Para Red and Chrysoidin), based on linear regression and squared correlation coefficient (R2). Matrix-matched calibration curves were constructed by adding different concentrations of standards into bean curd. The linearity of the analytical response for all studied compounds was very good, with correlation coefficients higher than 0.99 in all cases. The linear ranges and matrix effects for each azo dye are listed in Table 2.
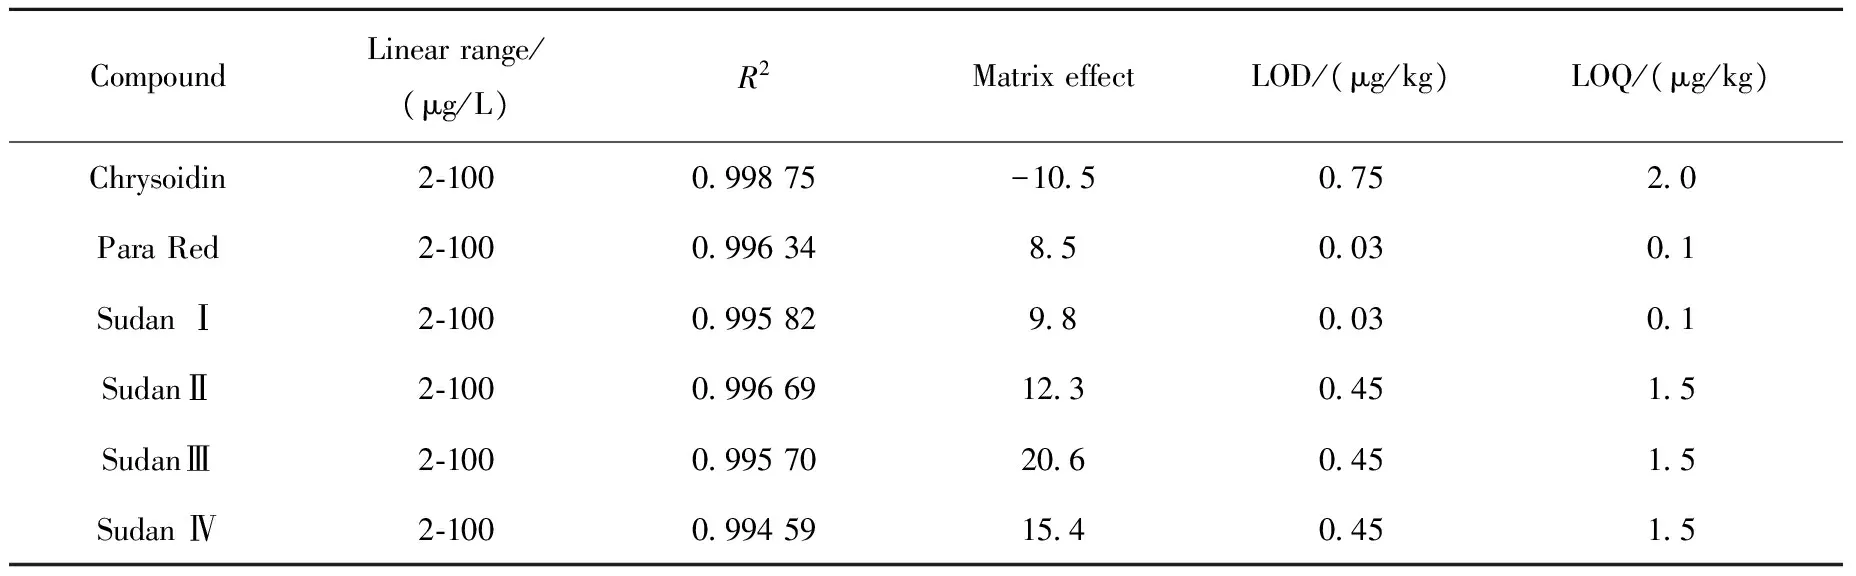
Table 2 Linear range, correlation coefficients (R2), matrix effect, LOD and LOQ for six dyes in bean curd
The matrix effect can suppress or enhance the signal and severely interfere with quantitative analysis of targets in trace levels and method reproducibility. Matrix effects were studied by comparing the slopes of solvent calibration curves and matrix-matched calibration curves. The percentage of the difference between these slopes is positive in case of signal enhancement, whereas a negative value is indicative for signal suppression[17]. In this study, the matrix effects of bean curd were within 20.6%, implying soft or medium signal enhancement. Only Chrysoidin had soft signal suppression with -10.5% matrix effects. In view of these results, it can be confirmed that these distributions depend not only on the matrix but also on the combination of the compound and the matrix. This fact highlights the importance of performing quantification with matrix-matched calibration curves.
The limit of detection (LOD) was determined as the sample concentration that produces a peak with a height three times the level of the baseline noise, and the limit of quantification (LOQ) was calculated as the sample concentration that produces a peak with 10 times the ratio of signal to noise. The determined LOD and LOQ values for the studied dyes in bean curd are shown in Table 2, which were in the ranges of 0.03-0.75 μg/kg and 0.1-2.0 μg/kg, respectively. The LOD and LOQ values for the six dyes are lower than those from the previous reports in chili powder matrix[19-20].
The precision of the method was verified by measuring recoveries from spiked blank bean curd at three concentrations levels, 7.5, 30 and 120 μg/kg for Sudan (Ⅰ-Ⅳ), Para Red and Chrysoidin. Mean recovery and RSDs obtained, which express the repeatability of the extraction method, are given in Table 3. Intra-day and inter-day recoveries were between 94.0%-110.6% and 93.9%-107.6%, respectively, intra-day and inter-day precision (RSDs) was 3.1%-14.8% and 4.7%-12.9%, respectively. The overall precision and accuracy of the method were sufficient for the quantification of the six dyes in real samples.
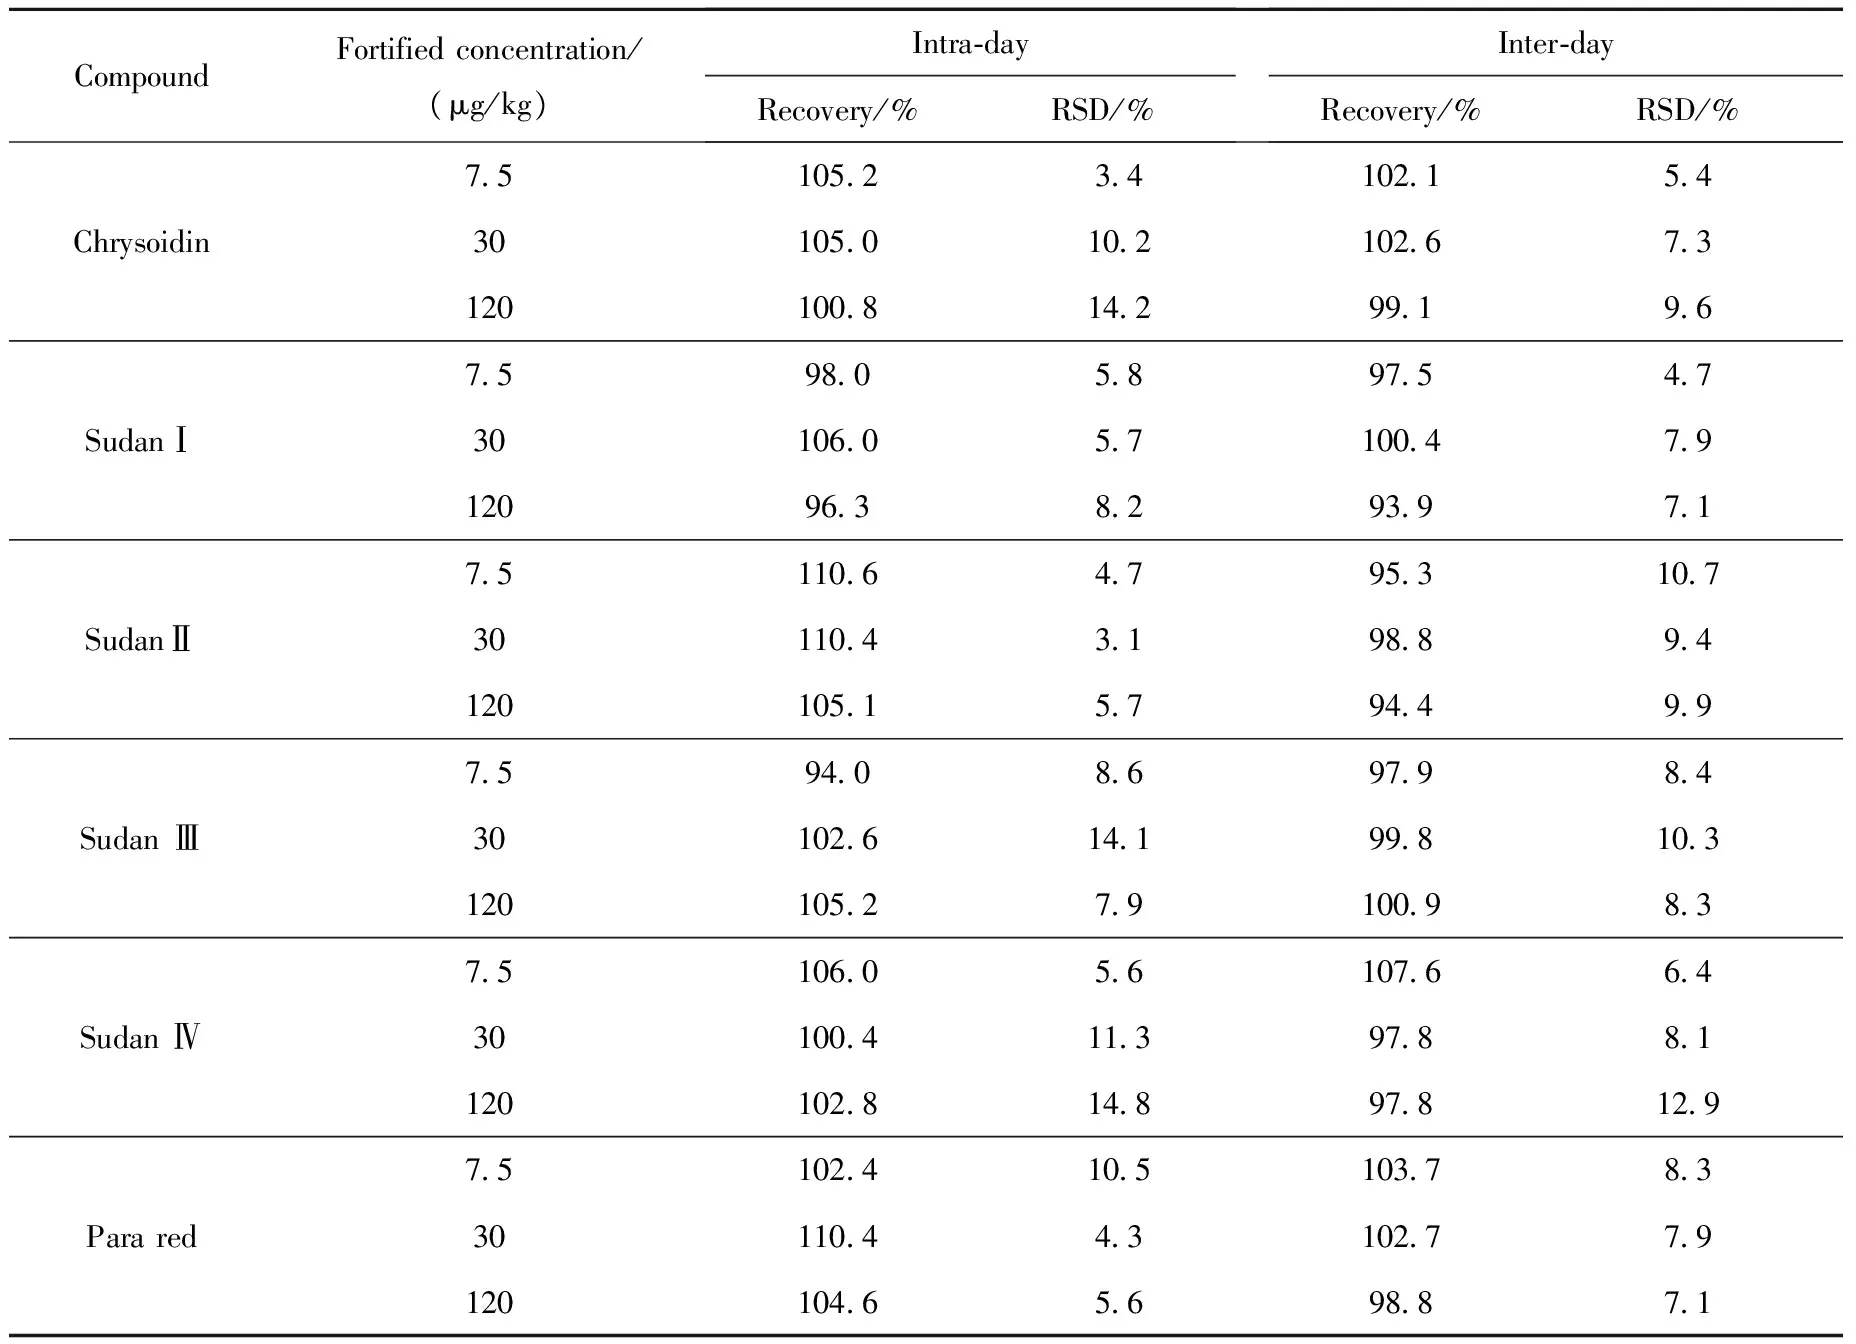
Table 3 Intra-day and inter-day precision and recovery of the HPLC-MS/MS method for bean curd (n=5)
2.4 Analysis of Real Samples
Thirty bean samples collected from different markets of local city were applied for validating the proposed method. No peaks of target analytes were detected in any matrices, which demonstrate the safety of the foods tested.
3 Conclusions
This work developed a sensitive and effective HPLC-MS/MS method with acetonitrile extraction provides satisfactory specificity and sensitivity for the simultaneous determination of six azo-dyes in soybean products. Analysis of dye-spiked bean samples showed that good recoveries ranged from 93.9% to 110.6% with excellent RSDs, which can meet regular analytical requirements. LODs and LOQs were sufficiently low to determine residues of these dyes in soybean products.
[1] VIDOTTI E C, CANCINO J C, OLIVEIRA C C, et al. Simultaneous determination of food dyes by first derivative spectrophotometry with sorption onto polyurethane foam[J]. Anal Sci, 2005, 21 (2): 149-153.
[2] AHLSTROM L H, ESKILSSON C S, BJORKLUND E. Determination of banned azo dyes in consumer goods[J]. Tren Anal Chem, 2005 (1): 24: 49-56.
[3] RAFII F, HALL J D, CERNIGLIA C E. Mutagenicity of azo dyes used in foods, drugs and cosmetics before and after reduction by Clostridium species from the human intestinal tract[J]. Food Chem Toxicol, 1997, 35(9): 897-901.
[4] IARC. Monographs on the evaluation of the carcinogenic risk of chemicals to man: Some aromatic azo compounds[R]. Lyon, 1975: 224-231.
[5] NAGASE M, OSAKI Y, MATESUDA T. Determination of methyl yellow, Sudan I and Sudan II in water by high-performance liquid chromatography[J]. J Chromatogr, 1989, 465 (2): 434-437.
[6] PIELESZ A, BARANOWSKA I, RYBAK A, et al. Detection and determination of aromatic amines as products of reductive splitting from selected azo dyes[J]. Ecotoxicol Environ Saf, 2002, 53 (1): 42-47.
[8] FENG F, ZHAO Y S, YONG W, et al. Highly sensitive and accurate screening of 40 dyes in soft drinks by liquid chromatography-electrospray tandem mass spectrometry[J]. J Chromatogr B, 2011, 879 (20): 1 813-1 819.
[9] LI C, WU Y L, SHEN J Z. UPLC-ESI-MS/MS analysis of Sudan dyes and Para red in food[J]. Food Addit Contam, 2010, 27 (9):1 215-1 220.
[10]SUN H W, WANG F C, AI L F. Determination of banned 10 azo-dyes in hot chili products by gel permeation chromatographyliquid chromatography-electrospray ionization-tandem mass spectrometry[J]. J Chromatogr A, 2007, 1 164 (1/2): 120-128.
[11]DI DONNA L, MAIUOLO L, MOZZOTTI F, et al. Assay of Sudan I contamination of foodstuff by atmospheric pressure chemical ionization tandem mass spectrometry and isotope dilution[J]. Anal Chem, 2004, 76 (17): 5 104-5 108.
[12]MAZZOTTI F, DI DONNA L, MAIUOLO L, et al. Assay of the set of all Sudan azodye (Ⅰ, Ⅱ, Ⅲ, Ⅳ, and Para-Red) contaminating agents by liquid chromatography-tandem mass spectrometry and isotope dilution methodology[J]. J Agric Food Chem, 2008, 56 (1): 63-67.
[13]CALBIANI F, CARERI M, ELVIRI L, et al. Accurate mass measurements for the confirmation of Sudan azo-dyes in hot chilli products by capillary liquid chromatography-electrospray tandem quadrupole orthogonal-acceleration time of flight mass spectrometry[J]. J Chromatogr A, 2004, 1 058 (1/2): 127-135.
[14]MA M, LUO X B, CHEN B, et al. Simultaneous determination of watersoluble and fat-soluble synthetic colorants in foodstuff by high-performance liquid chromatographyediode array detection[J]. J Chromatogr A, 2006, 1 103 (1): 170-176.
[15]AHLSTROM L H, AMON S, MATHIASSON L. Standard addition-A way of improving quantification of banned azo dyes in leather[J]. J Sep Sci, 2005, 28 (17): 2 407-2 412.
[16]LONG C, MAI Z, YANG X, et al. A new liquid-liquid extraction method for determination of 6 azo-dyes in chilli products by highperformance liquid chromatography (DAD)[J]. Food Chem 2011, 126 (3): 1 324-1 329.
[17]FERRER AMATE C, UNTERLUGGAUER H, FISCHER R J, et al. Development and validation of a LC-MS/MS method for the simultaneous determination of aflatoxins, dyes and pesticides in spices[J]. Anal Bioanal Chem, 2010, 397: 93-107.
[18]LI J, DING X M, LIU D D, et al. Simultaneous determination of eight illegal dyes in chili products byliquid chromatography-tandem mass spectrometry[J]. J Chromatogr B, 2013, 942: 46-52.
[19]SCHUMMER C, SASSEL J, BONENBERGER P, et al. Low-level detections of Sudan Ⅰ, Ⅱ, Ⅲ and Ⅳ in spices and chili-containing foodstuffs using UPLC-ESI-MS/MS[J]. J Agric Food Chem, 2013, 61 (9): 2 284-2 289.
[20]ZHAO S, YIN J, ZHANG J, et al. Determination of 23 dyes in chili powder and paste by high-performance liquid chromatography-electrospray ionization tandem mass spectrometry[J]. Food Anal Methods, 2012, 5 (5): 1 018-1 026.
高效液相色谱-串联质谱法同时测定豆制品中6种违禁偶氮染料
李 娟1,2,丁晓明1,刘宏民1,2,张雁冰1,2
(1.郑州大学药学院,河南 郑州 450001;2.郑州大学新药研究开发中心,河南 郑州 450001)
为了快速、高效的检测豆制品中非法添加的偶氮染料,建立了高效液相色谱-串联质谱(HPLC-MS/MS)同时分析豆制品中6种偶氮染料(碱性橙Ⅱ、对位红、苏丹红Ⅰ~Ⅳ)的方法。样品用乙腈超声提取、取离心后的上清液直接进样分析,经Waters C18色谱柱分离,电喷雾串联质谱多反应监测(MRM)模式检测,空白基质曲线外标法定量。结果表明:6种染料在2~100 μg/L范围内呈良好的线性关系,线性相关系数R2均大于0.99;提取回收率为93.9%~110.6%,相对标准偏差为3.1%~14.8%;检测限(LOD)和定量限(LOQ)分别为0.03~0.75 μg/kg和0.1~2.0 μg/kg。该方法操作简单、灵敏度高、结果准确可靠,适用于豆制品中6种违禁偶氮染料的定量分析。
偶氮染料;食品分析;豆制品;高效液相色谱-串联质谱(HPLC-MS/MS)
O657.63 Document code: A Article IC: 1004-2997(2015)03-0229-08
10.7538/zpxb.youxian.2014.0055
猜你喜欢
现代经济信息(2020年34期)2020-06-08
中国生殖健康(2019年5期)2019-01-06
新世纪智能(英语备考)(2018年11期)2018-12-29
现代装饰(2018年1期)2018-05-22
婚姻与家庭·性情读本(2018年3期)2018-04-03
制造技术与机床(2017年3期)2017-06-23
郑州大学学报(理学版)(2017年1期)2017-04-20
郑州大学学报(理学版)(2016年4期)2017-01-04
探测与控制学报(2015年4期)2015-12-15
中国酿造(2014年9期)2014-03-11