
Size-controllable Synthesis of Highly Fluorescent Carbon Quantum Dots in A Reverse Microemusion
2015-07-25 06:38DONGYinggeYANGJinlongDINGYanliWEIZhijiaHUShengliang
发光学报 2015年2期
DONG Ying-ge ,YANG Jin-long,DING Yan-li,WEI Zhi-jia,HU Sheng-liang
(1.School of Materials Science and Engineering,North University of China,Taiyuan 030051,China;2.State Key Laboratory of New Ceramics and Fine Processing,Tsinghua University,Beijing 100084,China)*Corresponding Author,E-mail:yinggedong@yeah.net
1 Introduction
Nanoparticle with size below 10 nm exhibit remarkable properties due to their precise and ultrafine dimensions[1].Carbon is a black material commonly,until recently is generally considered to have low solubility in water and weak fluorescence[2].Compared to organic dyes and traditional semiconductor quantum dots,photoluminescent CQDs are superior in terms of robust chemical inertness,easy function-alization,low toxicity,good biocompatibility and high resistance to photobleaching[3].There are few studies of size-and shape-controlled fluorescent CQDs,although they are important for understanding quantum phenomena,and for optoelectronics and biomedical applications[4].As a“soft template”,reverse microemulsions are organized assembly by water,oil and surfactant.They have water-in-oil liquid structure,which is composed of dispersed bubbles in the medium.The bubbles are described as micrometer or nanometer reactors[5-8].Soluble solute in a reverse microemulsions can induce transformations in system properties such as aggregation number,interface porosity,droplets sizes and shapes[8]. This chemical method can offer size tunability and narrow size distribution of CQDs without size separation process.
In this paper,Highly luminescent carbon quantum dots(CQDs)were prepared by using L-ascorbic acid as a carbon source derived from reverse microemulsion.Hexadecylamine was used to functionize CQDs.The synthesized CQDs had high quantum yield of maximum 47% at the 360 nm excitation wavelength.Changing the molar ratio of the water and surfactant from 20 to 50 caused an increase of particle size.
2 Experiments
In this research,by adjusting the molar ratio of the surfactant(sodium dodecyl benzene sulfonate,SDBS)and water(w=n(H2O)∶n(Surfactant)),different size of carbon quantum dots was controlled,as depicted in Fig.1.CQDs were prepared by carbonization of L-ascorbic acid in reverse micelles,and surface passivation was finishedin situsimultaneously[9].All of the chemicals were purchased from Aladdin.L-ascorbic acid(0.106 g,10%)in purified water(1.06 mL)(a)was added to a solution of SDBS in decane(20 mL)(b).Then,SDBS and n-butyl alcohol(cosurfactant)molar ratio of 1∶2 was dissloved into the solution,which became transparent rapidly under vigorous stiring,that indicated the formation of the water-in-oil reverse microemulsions(c).Then,the solution was aged at room temperature.After 12 h,hexadecylamine(HDA,0.9 g)was added to the solution,ultrasound dispersed.Then,the temperature of the solution was increased to 160℃ for 3 h.Simutaneously inside these reverse micelles,condensational polymerization in L-ascorbic acid was spurred by the heat[10],the colorless tansparent solution became orange.With the water evaporation,the reverse micelles reached oversaturation state,and carbonization was formed by intermolecular dehydration(d).The CQDs were passivated by HDA immediately.The suspension of the HDA capped CQDs(HDA-CQDs)was gained by rinsing with methanol and centrifuge(e).The product was then dispersed in 20 mL methanol.
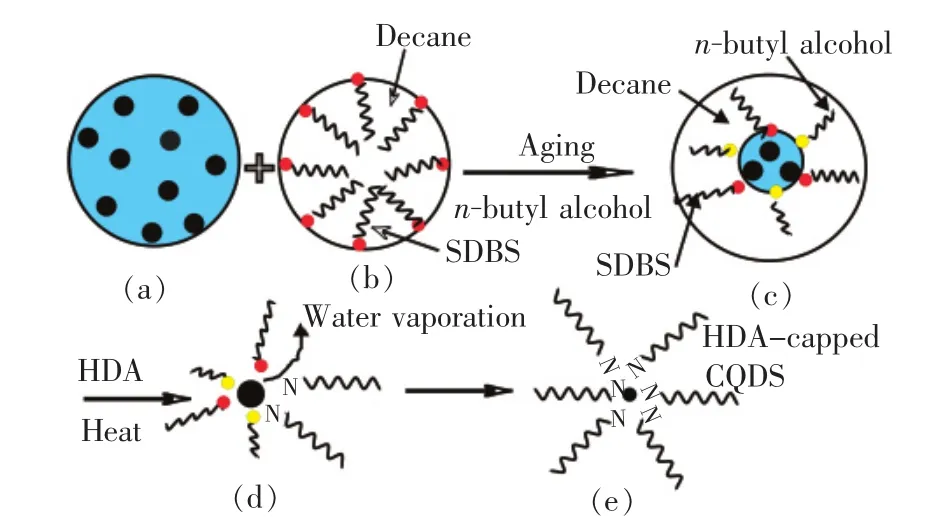
Fig.1 Schematic representation of synthesis of carbon quantum dots(CQDs)in reverse micelles:(a)L-ascorbic acid solution(water phase),(b)oil phase,(c)water in oil emulsions containing L-ascorbic acid,(d)carbonization,(e)HDA-capped CQDs.
Infrared spectra were obtained by using a Shimadzu FT-IR-8400S spectrometer.For transmission electron microscope measurements,a drop of the sample suspension in methanol was placed on a copper grid and coated with a carbon film,and then the grid was dried.TEM images were obtained using a JEOL JEM-2010.Photoluminescence spectra were recorded on a TianJin Gang Dong F-280 fluorometer.UV-visible absorption spectra were recorded on a Shimadzu UV-2550 spectrophotometer.
For quantum yield measurements,a solution of quinine sulfate in 0.1 mol/L H2SO4(the literature quantum yield of 54%at 360 nm)was used as a standard by the relative method.The quantum yield can be calculated using the following equation[11]:

whereQis the quantum yield,Iis the integrated area under the emission spectrum,Ais the absorbance at the excitation wavelength,and η is the refractive index of the solvent.In all cases,the subscript“st”denotes the standard value,the subscript“x”denotes the value of the sample under test.
3 Results and Discussion
FTIR spectra are acquired to determine the ligands to the surface of the HDA-CQDs.The results are shown in Fig.2.HDA-CQDs have been preparedviathe carbonization of L-ascorbic acid templated by water-in-oil reverse micelles.The reverse micelles are formed by mixing a L-ascorbic acid solution(water phase)and decane(oil phase)in the presence of SDBS.Once the micelles reach a critical supersaturation condition by raising the temperature,carbonization is spurred by intermolecular dehydration of L-ascorbic acid[3].Formation of the graphitic core structure is confirmed by the peaks near 1 500 cm-1==designated to the stretching vibration of C C.Carbonyl moieties of CQDs react with the amine head groups of HDA to form amides,thus the peaks corresponded to OH stretching vibrations(3 421 cm-1)and carbonyl groups(1 643 cm-1)diminish,which is in consistent with Woosung Kwon's reports[9].Else,the appearance of CN stretching vibrations(1 213 cm-1)and enhanced CH2stretching vibration(2 900 cm-1)also indicate that HDA ligands bind to the surface.The peaks at 1 043 cm-1correspond to the symmetric stretching vibrations of C—O—C,the surfaces of the HDA-CQDs are partially oxidized.
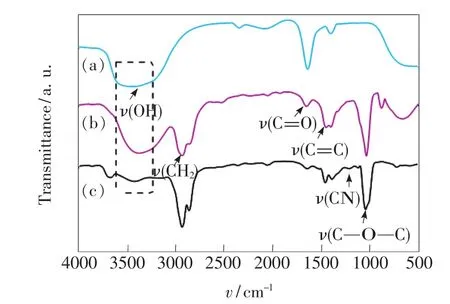
Fig.2 FT-IR spectra of L-ascorbic acid(a),bare CQDs(b),and HDA-capped CQDs(c).
The size and distribution of particles synthesized in reverse micelles is directly related to the size and shape of the micelles.The radius of SDBS-based micelles(r)is theoretically governed by the following equation[12]:

whereV=NVaqn(H2O),Vis the volume of the micelle;A=Nσn(Surfactant);Nis Avogadro constant;Vaq=3 nm,Vaqis the volume of water molecules;w=n(H2O)∶n(Surfactant).So,r=90w/σ,where σ is the superficial area of surfactant polar group,it is constant.The size of the particles is affected by the water content of microemulsion,within a certain range,with increasing thewratio,water droplets radius increases,the size of the nanoparticles increases[13].
As shown in Fig.3,the TEM images show that the average diameter of HDA-CQDs is proportional to thewratio.Gaussian distribution of CQDs has different peak value,and it increases with the addition ofw.With the increasing ofw,the polydispersity of HDA-CQDs broadens.This uniform dispersion arises from the nature of reverse micelles,which effectively isolates precursors from the bulk phase to prohibit undesirable aggregation.The ability of the surfactant coating water decreases,which leads to poor stability of oil-water interfacial film and the stronger interaction between micelles.Also,duing toVE(micelles exchange rate)>VG(crystal nucleus growth rate)>VF(nucleation rate),microemulsion beams are in dynamic equilibrium,the micellar collide constantly and gather into dimers,trimers.Droplet collision of dimers or trimers exist in the system for a long time,which would be attributed to larger particles,so,particle size distribution widens[12,14].
The lattice spacing turns out to be 0.25 nm(Fig.3(a)and Fig.3(c)),0.32 nm(Fig.3(b)and Fig.3(d)),which corresponds to the(100)and(002)facet of graphitic carbon,respectively.The fast Fourier transform in Fig.3(c)reveals a characteristic hexagonal diffraction pattern of the(100)facet of the graphite,which further proves the formation of the graphitic structure.

Fig.3 TEM images,display histograms and Gaussian distribution of CQDS at various w ratios.(a)20.(b)30.(c)40.(d)50.
In Fig.4,the absorbance spectra of HDACQDs at variouswratios are signifant in the UV region.The absorption near 350 nm is typically ascribed to p-π*transitions[15-18].Poor absorbance in the visible region can be also indicated as one of several spectral features of typical CQDs[19].The peak intensity generally decreases as the excitation wavelength(400-500 nm)increases.At the excitation wavelength(λex)of 380 nm,the emission peak of the large HDA-capped CQDs(w=50,459.7 nm)shifts about 20 nm to red in comparison with that of the small HDA-CQDs(w=20,439.8 nm).And emission intensity at longer λextends to be enhanced in proportion to the size of CQDs.Obviously,the emission intensity at λex=380 nm surpasses that at λex=400 nm in Fig.4(a).However,the former is initially inferior to the latter in Fig.4(b).The peak position of emission spectra is dependent on λex,which would be ascribed to emissive surface sites with various energy levels[14,20].The brightness of the photoluminescence is reflected in the high emission quantum yields.Under 360 nm excitation,the observed quantum yields(QYs)decrease from 47%to 28%with the increasing ofwratio from 20 to 50.Where,the variation probably depends on the effectiveness of the reaction for surface passivation and size distubution.Bare CQDs have low QYs about 6%,HDA-CQDs have a higher QYs under the same condition,which could produce new energy traps at the surface of CQDs.

Fig.4 Absorbance and photoluminescence spectra of HDA-CQDs at various w ratios.(a)20.(b)30.(c)40.(d)50.The color coding represents the excitation wavelength.
4 Conclusion
In summary,highly luminescent and narrow size distribution CQDs were prepared by adjusting water-surfactant molar ratio without any size selection steps.This method offered high quantum yields of maximum 47%at the 360 nm excitation wavelength.These features of CQDs would improve the optical,electrorheological catalytic properties,etc.
[1]Chen M J,Yang W T,Yin M Z.Size-controllable synthesis and functionalization of ultrafine polymeric nanoparticles[J].Small,2013,9(16):2715-2719.
[2]Da Silva J C G E,Goncalves H M R.Analytical and bioanalytical applications of carbon dots[J].TRAC-Trends Anal.Chem.,2011,30(8):1327-1336.
[3]Li H T,Kang Z H,Liu Y,et al.Carbon nanodots:Synthesis,properties and applications[J].J.Mater.Chem.,2012,22:24230-24253.
[4]Shen J H,Zhu Y H,Yang X L,et al.Graphene quantum dots:Emergent nanolights for bioimaging,sensors,catalysis and photovoltaic devices[J].Chem.Commun.,2012,48:3686-3699.
[5]Chen Q D,Shen X H,Gao H C.Formation of solid and hollow cuprous oxide nanocubes in water-in-oil micro-emulsions controlled by the yield of hydrated electrons[J].J.Colloid Interf.Sci.,2007,312:272-278.
[6]Wang Y Y,Zhou Z H,Yang Z,et al.Gas sensors based on deposited single-walled carbon nanotube networksfor DMMP detection[J].Nanotechnology,2009,20:1-8.
[7]Wei M D,Konishi Y,Zhou H S,et al.Synthesize of single-crystal manganese dioxide nanowires by a soft chemical process[J].Nanotechnology,2005,16:245-249.
[8]Wang Y D,Zhou A N,Yang Z Y.Preparation of hollow TiO2microspheres by the reverse microemulsions[J].Mater.Lett.,2008,62:1930-1932.
[9]Kwon W S,Rhee S W.Facile synthesis of graphitic carbon quantum dots with size tunability and uniformity using reverse micelles[J].Chem.Commun.,2012,48:5256-5258.
[10]Peng Q,Dong Y J,Li Y D.ZnSe semiconductor hollow microsphere [J].Angew.Chem.Int.Ed.,2003,42:3027-3030.
[11]Hu S L,Niu K Y,Sun J,et al.One-step synthesis of fluorescent carbon nanoparticles by laser irradiation[J].J.Mater.Chem.,2009,19(4):484-488.
[12]Liu H Z.Microemulsion Phase Solvent Extaction Technique and Applications[M].Beijing:Science Press,2005:226(in Chinese).
[13]Song F P,Zhu Q A,Wang S F,et al.Preparation of BaTiO3spherical nanoparticles by reverse microemulsion[J].Chin.J.Inorg.Chem.(无机化学学报),2006,22(2):355-358(in Chinese).
[14]Liu H P,Ye T,Mao C D.Fluorescent carbon nanoparticles derived soot[J].Angew.Chem.Int.Ed.,2007,46(34):6473-6475.
[15]Sun Y P,Zhou B,Lin Y,et al.Quantum-sized carbon dots for bright and colorful photoluminescence[J].J.Am.Chem.Soc.,2006,128:7756-7757.
[16]Cao L,Wang X,Meziani M,et al.Carbon dots for multiphoton bioimaging[J].J.Am.Chem.Soc.,2007,129:11318-11319.
[17]Zhou J,Booker C,Li R,et al.An electrochemical avenue to blue luminescent nanocrystals from multiwalled carbon nanotubes(MWCNTs)[J].J.Am.Chem.Soc.,2007,129:744-745.
[18]Zhao Q,Zhang Z,Huang B,et al.Facile preparation of low cytotoxicity fluorescent carbon nanocrystals by electrooxidation of graphite[J].Chem.Commun.,2008,41:5116-5118.
[19]Kwon W S,Do S A,Won D C,et al.Carbon quantum dot based field effect transistors and their ligand length dependent carrier mobility[J].ACS Appl.Mater.Interf.,2013,5:822-827.
[20]Yan F Y,Zou Y,Wang M,et al.Synthesis and application of the fluorescent carbon dots[J].Prog.Chem.(化学进展),2014,26(1):61-74(in Chinese).
猜你喜欢
现代仪器与医疗(2021年4期)2021-11-05
泰山学院学报(2019年6期)2020-01-14
科技知识动漫(2017年5期)2017-05-11
科技知识动漫(2017年4期)2017-04-15
科技知识动漫(2017年2期)2017-02-06
科技知识动漫(2016年10期)2016-10-18
天津商务职业学院学报(2015年2期)2015-02-28
天津商务职业学院学报(2015年1期)2015-02-28
疑难病杂志(2014年12期)2014-04-16
深空探测学报(2014年1期)2014-02-28
