Anti⁃noise sound recognition based on energy⁃frequency feature
2015-12-03 05:18ZHOUXiaominLIYing
智能系统学报 2015年5期
ZHOU Xiaomin,LI Ying
(College of Mathematics and Computer Science,Fuzhou University,Fuzhou 350108,China)
Anti⁃noise sound recognition based on energy⁃frequency feature
ZHOU Xiaomin,LI Ying
(College of Mathematics and Computer Science,Fuzhou University,Fuzhou 350108,China)
In the natural environment,non⁃stationary background noise affects the animal sound recognition directly.Given this problem,a new technology of animal sound recognition based on energy⁃frequency(E⁃F)feature is proposed in this paper.The animal sound is turned into spectrogram to show the energy,time and frequency characteristics.The sub⁃band frequency division and sub⁃band energy division are carried out on the spectrogram for extracting the statistical characteristic of energy and frequency,so as to achieve sub⁃band power distribution(SPD)and sub⁃band division.Radon transform(RT)and discrete wavelet transform(DWT)are employed to obtain the important projection coefficients,and the energy values of sub⁃band frequencies are calculated to extract the sub⁃band frequency feature.The E⁃F feature is formed by com⁃bining the SPD feature and sub⁃band energy value feature.The classification is achieved by support vector machine(SVM)classifier.The experimental results show that the method can achieve better recognition effect even when the SNR is below 10 dB.
animal sound recognition;sub⁃band power distribution(SPD);sub⁃band frequency feature;radon transform(RT);energy⁃frequency(E⁃F)feature
http://www.cnki.net/kcms/detail/23.1538.tp.20151014.1432.002.html
Ecological environmental sound events contain a wealth of information closely related to the human sur⁃vival environments.The relevant information of envi⁃ronmental sound can be obtained by sound processing technology.Thus the environment sound recognition technology can be used to analyze and survey environ⁃ment,predict the environmental change,detect spe⁃cies intrusion,monitor the animal life habit and protect them.The research on environmental sound is of great significance to protect and develop the environment.However,in real situation,there is a large amount of non⁃stationary noise who seriously disturbs the main sound signals.Thus,how to identify the main sound signals from the noisy environment is the emphasis and difficulty in sound signal processing.
Currently,the signal processing technologies are mostly concentrated in the speaker recognition and mu⁃sic classification,while environmental sound process⁃ing is relatively less.Since the environmental sound is drawing more and more attention,some scholars haveput forward some new recognition technologies.For ex⁃ample,Chou et al.[1]segmented the bird song to obtain the syllables and used Wavelet transformation on Mel⁃frequency cepstral coefficients(WMFCCs),then clas⁃sified audio with BP neural network.Chen et al.[2]de⁃veloped an automatic frog call recognition system based on the combination of a pre⁃classification method of syllable lengths with a multi⁃stage average spectrum(MSAS)method to recognize 18 classes of frog calls.Chu et al.[3]used the matching pursuit(MP)algo⁃rithm to obtain effective time⁃frequency features,and combined MP features with MFCC features to obtain higher accuracy.Khunarsal et al.[4]used spectrogram pattern matching with the classifiers of neural network and k⁃nearest neighbor(k⁃NN)to recognize the short time environmental sound.You et al.[5]employed time encoded signal processing and recognition(TESPAR)to identify the environmental sound events,which used the TESPAR coding method to produce simple data structures,and then used the archetypes technique for classification.Dennis et al.[6]presented the sub⁃band power distribution(SPD)image with k⁃NN classifier to recognize the sound events.
However,there are still some disadvantages in theabove methods.The MFCC feature is sensitive to the change of signal,so the background noise may serious⁃ly degrades the recognition accuracy.Syllable length pretreatment is susceptible to the influence of overlap⁃ping sound signals.MP algorithm calls for a large a⁃mount of calculation while searching the optimal atoms in over⁃complete dictionary.It is different to use spec⁃trogram pattern matching to design the relevant factors,as it has no noise resistance.The recognition effect of TESPAR is not satisfying even though the method is of less complexity.The SPD image presented by Dennis et al.[6]can effectively describe the characteristic of the spectral power distribution,but the method must be applied in a special and known noise environment.In view of the above questions,combining with the advan⁃tage of SPD image,this paper proposes a feature ex⁃traction method based on energy⁃frequency(E⁃F).E⁃F refers to calculating the sub⁃band energy density distri⁃bution and the sub⁃band energy value of the sound sig⁃nal based on the spectrogram.Then the sound signals are described using the energy distribution characteris⁃tic and the sub⁃band energy value feature.
1 E⁃F feature
The details of the recognition framework are shown in Fig.1.It can be seen that feature extraction is the core part of the classification system.The effectiveness of feature parameters may directly affect the classifica⁃tion result.Therefore,a novel method of E⁃F feature,based on the time⁃frequency characteristics of sound signal,is proposed in this paper.The method applies SPD image to depict the distribution of sub⁃band ener⁃gy and describe the relationship between sub⁃band fre⁃quency and sub⁃band energy level.In the meantime,the sub⁃band energy value feature is used to represent the relationship between sub⁃band frequency and ener⁃gy value.Combining with the two features mentioned a⁃bove,the effective E⁃F feature of different sound sig⁃nals can be extracted.
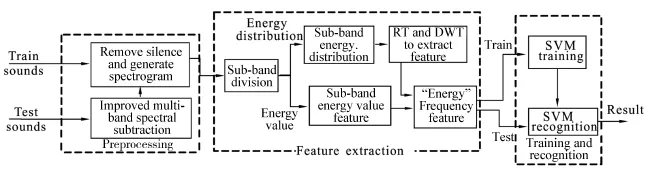
Fig.1 Animal sounds recognition framework
1.1 SPD feature
The SPD image is designed to represent the distri⁃bution of spectral power in each frequency sub⁃band o⁃ver time.So it needs to divide the frequency and the energy of spectrogram into several sub⁃bands respec⁃tively.Then the corresponding energy level of each pix⁃el is calculated in spectrogram.The result can be ob⁃tained to describe the spectral power distribution[6].
1.1.1 SPD image
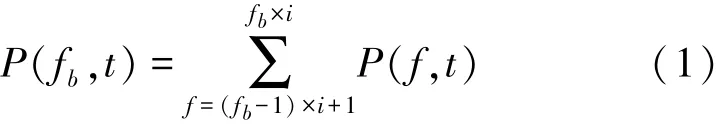
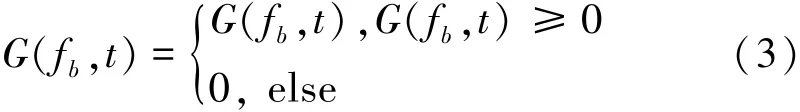
The SPD describes the energy distribution in each frequency sub⁃band over time.Assuming that sound signal x(n)is translated into spectrogram P(t,f).For the convenience of processing,it can be turned P(t,f)into P(f,t).The frequency can be divided into sub⁃band based on the frequency range.Assuming that the spectrogram can be divided into Fbsub⁃bands,the fre⁃quency range ofeach sub⁃band frequencyAfter sub⁃band division,the spectrogram can be repre⁃sented as P(fb,t) ,
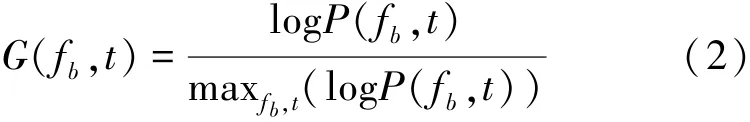
To unify the normalization results in the range of[0,1],the negative adjustment can be carried out as fol⁃lows:
Then use the sub⁃band energy division to calculate the density distribution of sub⁃band energy to get its SPD image.The SPD is based on the density distribution of G(fb,t),so the distribution can be chosen by a non⁃parametric approach that based on the histogram.Ac⁃ After sub⁃band division,the spectrogram can be repre⁃sented as P(fb,t),cording to the energy distribution,the number of sub⁃band can be set as Zb,then the SPD can be written as follows:
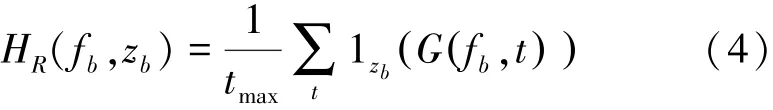
where tmaxis the number of time samples in the seg⁃ment,1zb(G(fb,t))is the indicator function,which e⁃quals one if and only if the G(fb,t)belong to zbth bin and is zero otherwise,namely,
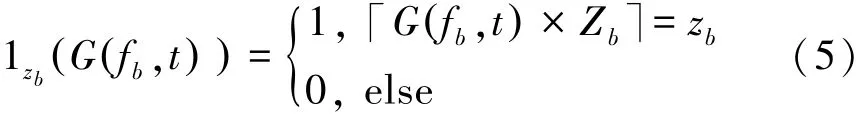
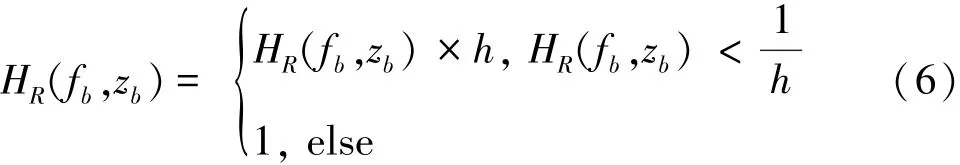
The raw probability distribution HR(fb,zb)can be got according to the above processing,in which 0≤HR(fb,zb)≤1.And it can be found that most of the information is contained within a small region of the dy⁃namic range based on the SPD.Besides,the distribu⁃tion density values of the sub⁃band energy vary with the sound signals.To enhance the contrast of the raw SPD,it can be used Eq.(6)to obtain the enhanced SPD image to obtain important information.
1.1.2 Radon transform(RT)and discrete wavelet transform(DWT)
RT can not only describe the directional feature and local feature of the image to reduce the feature pa⁃rameters of the image but also have advantage of noise resistance.Assuming that F′(x,y)is corrupted by the noise F(x,y),then the distance between the two sig⁃nals before projection can be defined as
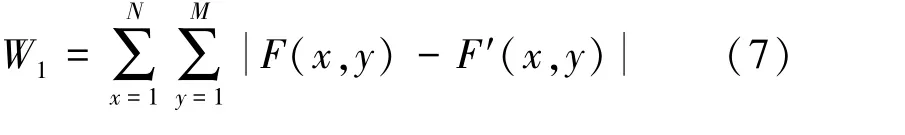
After the RT,the distance between the two signals has become as W2,
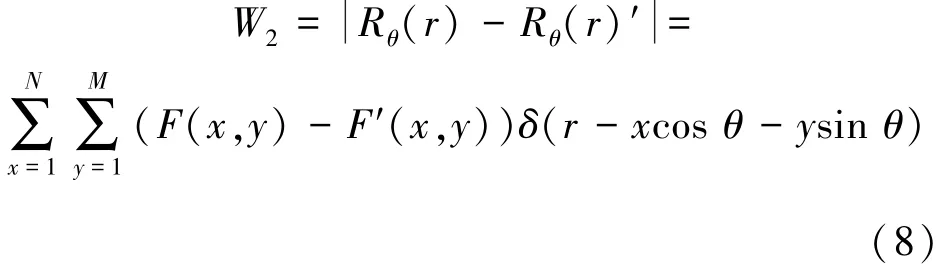
After turning the spectrogram into SPD image,RT coefficient can be extracted.RT in the SPD image serves as one method to calculate the projective trans⁃ form at certain directions,which is to calculate the line integrals of image along the parallel lines.The RT of the SPD image HR(fb,zb)is defined as Refs.[7⁃10],
where Rθ(r)is new image resulting from the RT;r=fbcos θ+zbsin θ;θ∈[0,180)is the angle between the distance vector and the fbaxis;ℜ[HR(fb,zb)]de⁃notes RT of the 2⁃D function HR(fb,zb);and δ(x)=is the Dirac function.RT of the SPD im⁃age is shown in Fig.2.In the SPD image,the value and color of each point on the Z axis denotes the corre⁃sponding energy distribution probability,and the paral⁃lel lines represent the projection direction.The energy of linear integral in each parallel line can be calculated and the corresponding value can be reflected on the Z axis to obtain the projection results.
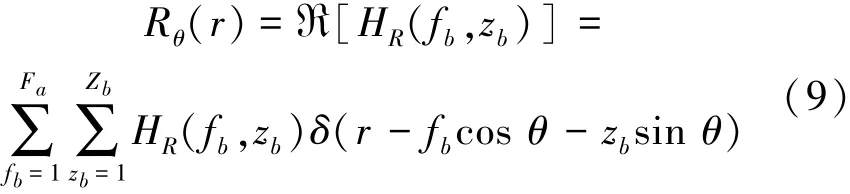
In this paper,the result of RT at a certain angle is a one⁃dimensional serial Rθi(r′),where r′=1,2,…,N,N is the number of projection points,θi∈{θ1,θ2,…,θM},M is the number of projection angles.Hence the corresponding projection matrix can be ex⁃pressed as
Using the above method,the Radon projection co⁃ efficients at different angles can be got.However,if the projection coefficients are used directly to identify spectrogram,there will be a large amount of calcula⁃tions as well as a relatively low recognition rate.Aiming at the problem in hand,the feature parameters need be selected by some conditions.Since the DWT has the characteristics of frequency separation,noise elimina⁃tion and improvement of signal resolution,it can be a⁃dopted to extract the important parameters from the Ra⁃don projection coefficients.In this paper,the db3 wavelet function is applied to realize the decomposition and to obtain the transform coefficients.Wavelet coeffi⁃cients are divided into low frequency part and high fre⁃quency part,in which case the low frequency part de⁃notes the main structure information of signals and the high frequency part denotes signal details.It can beknown that the low frequency can reveal more about the features of signals,so the low frequency part of DWT is selected as the feature parameters.
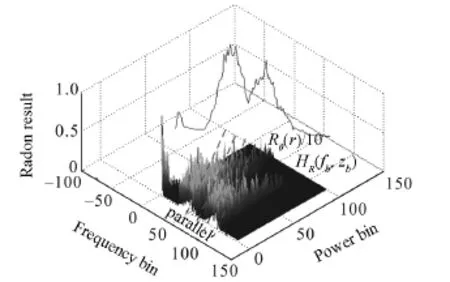
Fig.2 RT of the SPD image
1.2 Sub⁃band feature
The SPD image represents the distribution of sub⁃band energy,and the pixel in SPD image corresponds to the probability of the sub⁃band energy level.Howev⁃er,the SPD feature cannot show the specific value of sub⁃band energy.Since the energy value of sub⁃band frequency varies with the animal sound,the sub⁃band energy value can be calculated to distinguish the ani⁃mal sounds.Therefore,the paper applies the sub⁃band division to extract specific energy value,which is used to represent the sub⁃band feature.
The principle of sub⁃band division is to set the range of frequency,and base on the range to divide the spectrogram into multiple sub⁃bands.The spectrogram is divided into N bands with equifrequency based on Eq.(1),so the spectrogram P(t,f)is divided into P(t,fk).The number of frequency in each sub⁃band isfrequency band.In sub⁃band, the sliding window can be set based on the characteris⁃tics of frequency band,and the energy characteristics of the spectrogram within windows can be extracted.The features of the sub⁃band are adopted to describe the frequency characteristics of spectrogram.Due to the stability of frequency volatility of animal sounds,the effective description of sub⁃band feature can improve the accuracy of classification.
The paper extracts the SPD image of sound signal and applies it to represent the probability distribution relationship between sub⁃band frequency and sub⁃band energy.Then,calculating the energy value of sub⁃band by combining the sub⁃band frequency feature,so as to obtain the distribution feature and value feature of the E⁃F characteristics.
2 Sound recognition system framework
Sound recognition is a standard pattern recognition process.The system framework includes three stages:pre⁃processing,feature extraction and recognition.In pre⁃processing,an improved multi⁃band spectral sub⁃traction(IMSS)method is used to reduce the noise of sound signals and remove the silence sections after IMSS.The key of feature extraction is to denote the sound signal after pretreatment by citing the E⁃F fea⁃ture proposed above in this paper.In recognition stage,SVM classifier is used to train and recognize the above features and then obtain the results.The following part will show the concrete steps of pre⁃processing and fea⁃ture extraction in detail for specific animals.
2.1 IMSS to de⁃noise
The noise estimation of traditional multi⁃band spectral subtraction is calculated during the period of silence.It can obtain the approximate noise estimation in a stable and high SNR environment,but in the non⁃stationary and low SNR environment,it can not esti⁃mate the noise accurately.
In general,as real noise is non⁃stationary,the traditional multi⁃band spectral subtraction fails to accu⁃rately estimate the actual noise,which will lead to in⁃complete noise reduction,and even distort the original sound signal.So estimating the noise accurately is the core problem of multi⁃band spectral subtraction.To solve this problem,the paper proposes the IMSS based on the controlled recursive averaging noise estimation method[11].IMSS can not only accurately estimate the noise power spectrum of the sounds,but also divide the sounds into multiple frequency bands and conduct spectral subtraction targeting to the affection differences of each band by noises so as to receive a better de⁃noi⁃sing effect.
Assuming that the additive noise signal d(n)is uncorrelated with clean sound signal s(n),the corrup⁃ted sound y(n)can be expressed as

where y(n)is divided into overlapping frames by the application of a window function and analyzed by using the short⁃time Fourier transform,
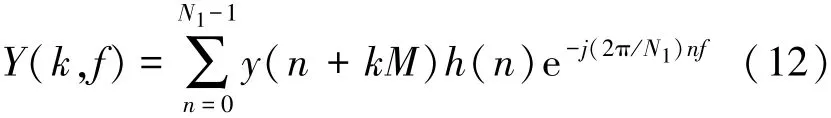
where k is the frame index,f the frequency bin index,N1the length of frame,M frame shift,and h(n)a win⁃dow function.So Eq.(11)can be written as follows:

Assuming that H0(k,f)and H1(k,f)indicate sound absence and presence respectively in the kth frameofthefthfrequencybin,λd(k,f)=denotes power spectrum of noise sig⁃ nal,and λ^d(k,f)is power spectrum estimation of noise signal.In general,a temporal recursive smoothing method will be adopted to perform the noise estimation during the period of sound absence,that is,
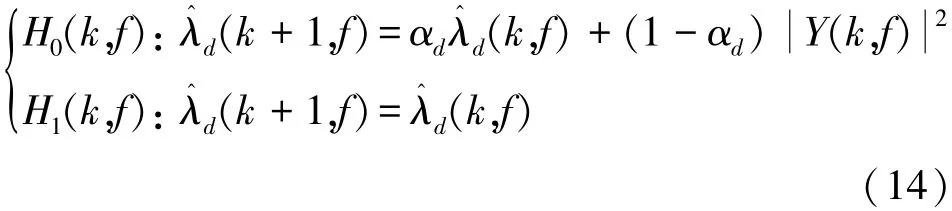
where αd(0<αd<1)is a smoothing parameter which is set as 0.85.
Supposing that p(k,f)defined as P(H1(k,f)|Y(k,f))denotes the conditional signal presence proba⁃bility,for the case of H0(k,f)and H1(k,f)in Eq.(14),the noise estimation of the next frame can be obtained by full probability events as follows:
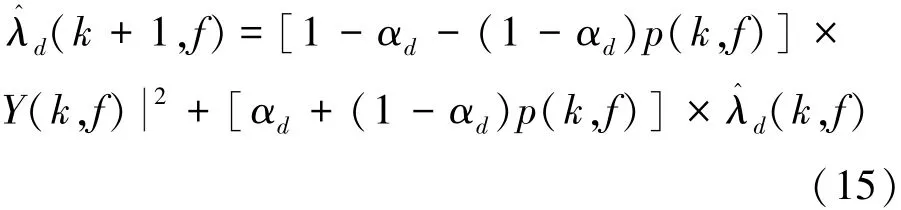
If α~d(k,f)denotes αd+(1-αd)p(k,f),Eq.(15)can be expressed as
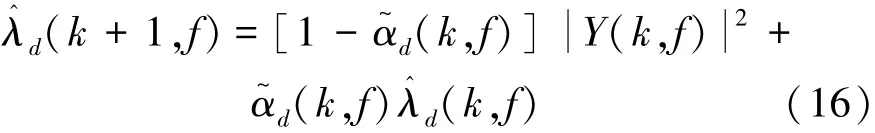
Then,the noise power spectrum estimation can be ob⁃tained through α~d(k,f)and recursive averaging of sound power spectrum.Basing on the multi⁃band spec⁃tral subtraction proposed in Ref.[12],the recursive averaging is applied to calculate the noise power esti⁃mation and replace the original noise power estimation,thereby improving the traditional multi⁃band spectral subtraction in order to cope with noise reduction better.
There are kinds of algorithms used in the compare experiment,namely,IMSS,the popular multi⁃band spectral subtraction[12],wavelet de⁃noising method(WDM)[13]and speech enhancement algorithm with leading⁃in delay(SEAWLD)[14].The compare experi⁃ment uses 57 class animals with 570 sound signals to reduce noise in different noise environments under dif⁃ferent SNRs.From Table 1,it can be seen that the IMSS has a better de⁃noising effect,and reduce the non⁃stable noises effectively.
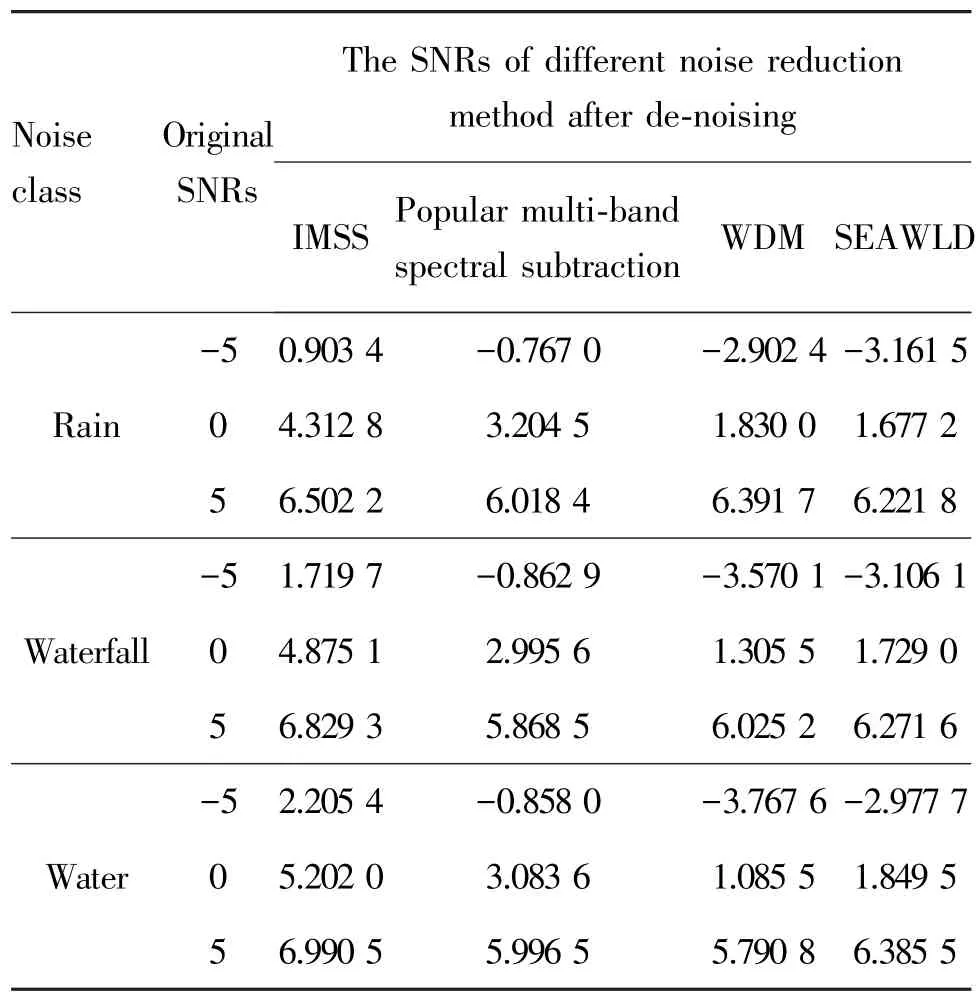
Table 1 The result of noise reduction in different environ⁃ments with different de⁃noising method dB
2.2 Remove silence
The feature extraction of sound signal would di⁃rectly affected by the existence of silence parts in the de⁃noise signal,so the silence must be removed before extracting feature.The paper uses the short⁃time energy threshold to remove the silence.No segmentation of o⁃verlapping frames is conducted to obtain each frame s^i(j),where i is frame index,and j the sample point within a frame.Then the short⁃time energy can be ob⁃tained as follows:
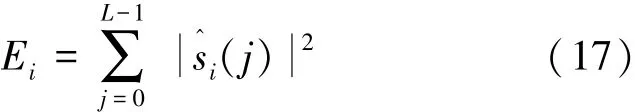
where L is the length of a frame.The short⁃time energy of all frames can be calculated by Eq.(17),then the total energy and average energy can be obtained.The threshold is set based on the average energy multiplied by parameter a(a is set based on the actual situation,which is set as 0.05 in this paper).If the short time energy is smaller than threshold,the signal is consid⁃ered as silent and removed,and the effective sound signal s′(n)is finally obtained.
Framing,windowing and short⁃time Fourier trans⁃form for sound signal s′(n)will be carried out to obtain S′(k,f)by Eq.(12),and the corresponding energy spectrum density function(power spectrum function)P(k,f)can be described as
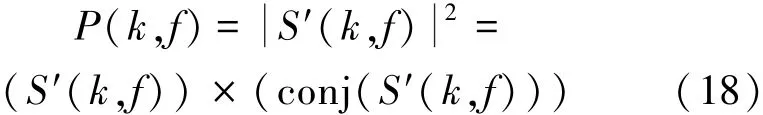
P(k,f)is a two⁃dimensional nonnegative realfunction.Abscissa will be expressed with time t,repla⁃cing the original frame k,and with f as the ordinate,the spectrogram is constructed by gray⁃scale which is expressed by the values of the corresponding P(t,f)[15].
2.3 E⁃F feature extraction
After the pre⁃processing,sub⁃band energy divi⁃sion is carried out to achieve the sub⁃band energy prob⁃ability distribution.Then RT is applied to extract the directional feature and the local feature of the SPD im⁃age,and combining with DWT to obtain the important parameters.After the energy distribution feature is ob⁃tained,the sub⁃band frequency division is carried out to extract the sub⁃band energy value feature.And then,the sub⁃band energy distribution feature and sub⁃band energy value feature are combined to form the E⁃F fea⁃ture set of sound signal.
According to the generation principle of SPD im⁃age,the sub⁃band division and sub⁃band energy divi⁃sion are carried out on the normalized spectrogram to obtain the distribution of energy in each frequency's sub⁃band.The sparrow's spectrogram is shown in Fig.3(a),and Fig.3(b)represents the SPD figure corresponding to Fig.3(a).From Fig.3,it can be con⁃cluded that the frequency range of spectrogram is from 0 to 22 050 Hz,and the frequency is divided into 129 bins.The energy is divided into 100 bins.Pixel colors of the spectrogram can be expressed by energy value.Warmer tone of the pixel color indicates higher energy value,for example,the deep blue value is 0.The spectrogram shows that energy mainly concentrates in the mid⁃frequency domain,which is displayed in the SPD image.The pixel color of the SPD diagram means the frequency of corresponding sub⁃band energy,the higher the probability,the warmer the color tone.The animal sound spectrogram is different and the corre⁃sponding energy distributions are not the same,so the SPD image can effectively distinguish the sound type.
The data of the SPD figure is large,and if the SPD figure is served as the feature vector,it may lead to large computational complexity and long training time.In order to effectively extract the main feature of the image,reduce the calculation and shorten the cal⁃culation time,the paper use RT to extract the direc⁃tional feature and the local feature of the SPD image.
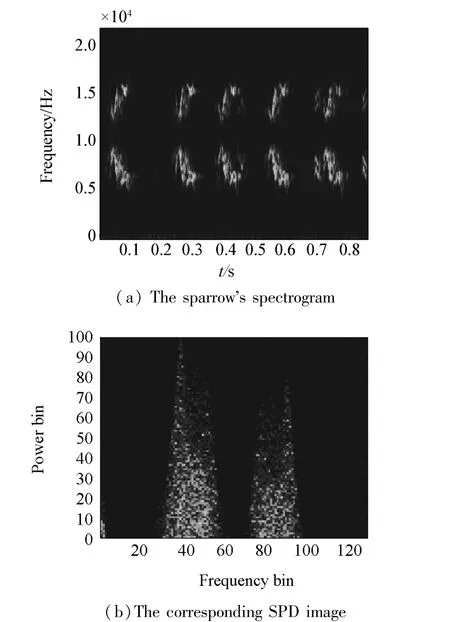
Fig.3 The sparrow's spectrogram and corresponding SPD image
The RT result of each particular angle is a one⁃di⁃mensional serial as shown in Fig.4(a),which are the curves of the sparrow’s spectrogram after the Radon projection at 30°and 75°.It can be seen that the pro⁃jection coefficients are different at different angles and Radon projection curve can effectively describe the tex⁃ture and shape features of image.
Taking 15°as a spacing,in the range of[0, 180),12 projection coefficientsat specific di⁃ rections can be calculated,where θi∈{θ1,θ2,…,θ12},the corresponding values are
[0 15 30 45 60 75 90 105 120 135 150 165]The DWT is applied after getting the projection coeffi⁃cients.In the experiment,the db3 wavelet function is adopted in DWT to transform the Radon projection co⁃efficients of each angle respectively.DWT divides the signal into high frequency and low frequency parts as shown in Fig.4(b).Since the low frequency can re⁃veal more about the feature of signal,the low frequen⁃cy part can be selected as the feature parameters.
In order to effectively describe sub⁃band energy value feature of sound signal,the paper divides thespectrogram into multiple bins.Then the sliding win⁃dow can be applied to divide each band to calculate the energy value of each window as features.As shown in Fig.5,the left part of figure divides the spectrogram into 9 bins,and the right part denotes the third and fourth frequency band.In the experiment,the paper divides the spectrogram into 100 bins,sets the sliding window as the size of sub⁃band,and then calculates the energy values of sub⁃band as features.
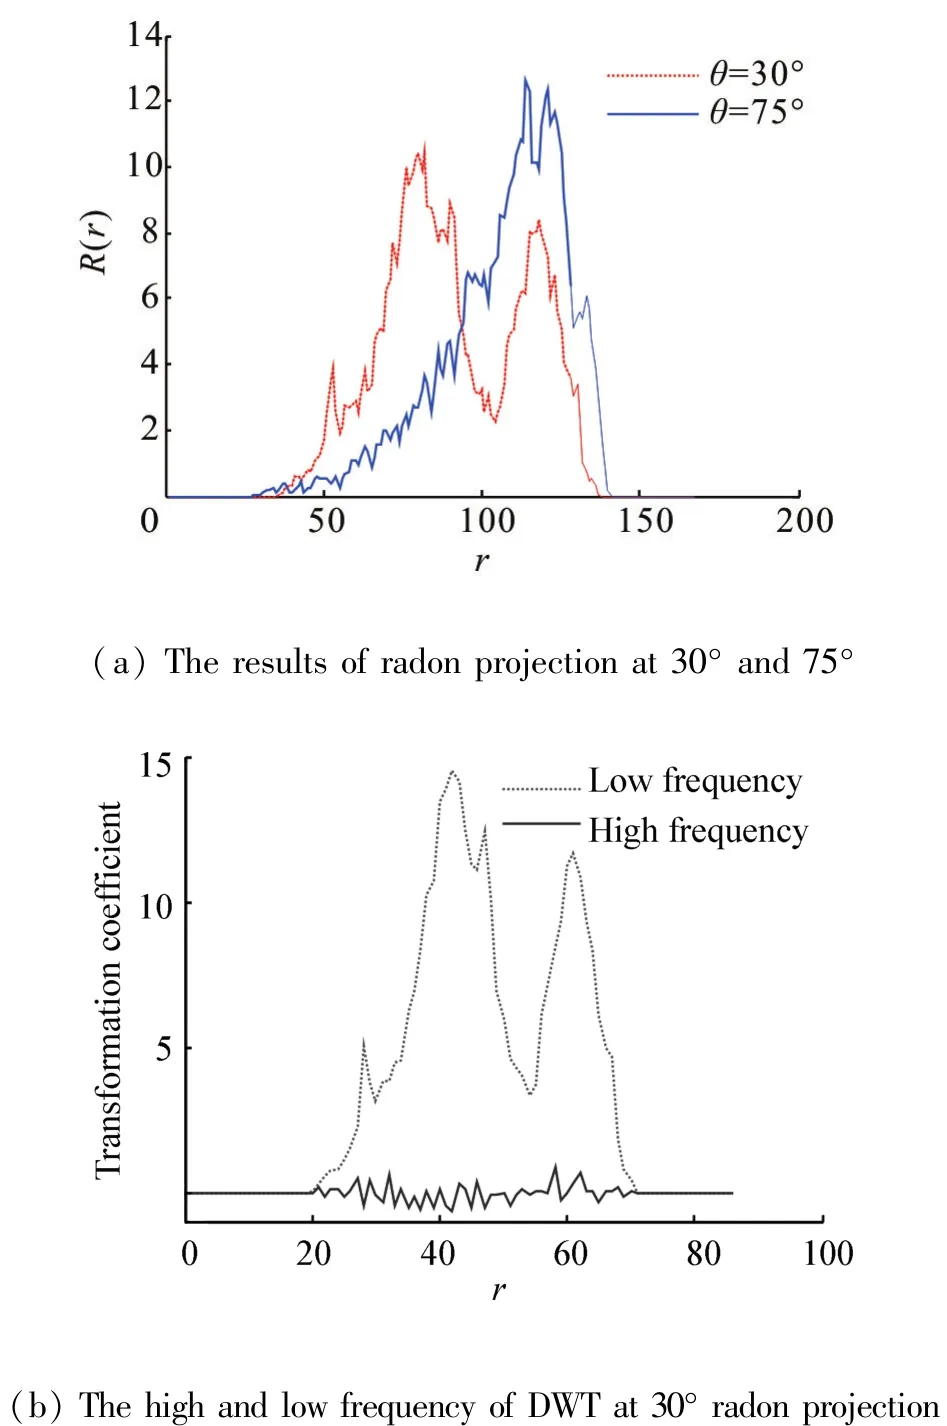
Fig.4 RT and DWT of sparrow sound's SPD image

Fig.5 Sub⁃band division
3 Experiments
3.1 Experimental design
Table 2 shows the 60 subclasses of 3 classes of ec⁃ological sounds,which include sounds of birds,mam⁃mals and natural noise from the Freesound data⁃base[16],freeSFX database[17],and are recorded by SONY ICD⁃UX512F recorder.Each subclass of sounds includes 30 segments with 2 s length,44 100 Hz sam⁃pling frequency and 16 bit digitization.
In this paper,for each subclass of animal sounds,20 clean of sound segments are randomly selected as train samples.And the rest of 10 sound segments,which are mixed with different types noises with the SNRs of 0,5,10,20,30,40 dB,are experimented as test samples so as to acquire the animal sound recog⁃nition rates under different SNRs.
In order to verify the effectiveness of the proposed method,the existing method in Ref.[18]and the popular MFCCs are selected to make a comparison.In Ref.[18],after carrying out the pre⁃processing of multi⁃band spectral subtraction,the anti⁃noise feature APNCC is extracted to feed into SVM for classification.
It can be drawn from Table 1 that IMSS can effec⁃tively reduce the non⁃stationary noise and keep the mu⁃tation and detail part of the sound signal.Under the same situation,the IMSS can get better results.There⁃fore,two groups of contrast test were carried out in this paper.The first group is to extract E⁃F features,RT+DWT features,APNCC features,and MFCCs features respectively after de⁃noising by IMSS.Then SVM clas⁃sifier is used to classify them,and then the different recognition rates under noisy environments are com⁃pared in order to reflect the availability of E⁃F features.The second group is to experiment with the method of Ref.[18]and the popular MFCCs combined with SVM to reflect the practicability of the proposed approach.In this paper,the LIBSVM[19]package designed by Dr.Lin Chih⁃Jen of Taiwan University is used directly,and the RBF kernel is chosen experimentally.
3.2 Results analysis
Table 3 shows the recognition rates of four differ⁃ent methods in noiseless environment by the above ex⁃perimental design.It is observed that four kinds of methods can achieve high recognition rates in noiseless environment.
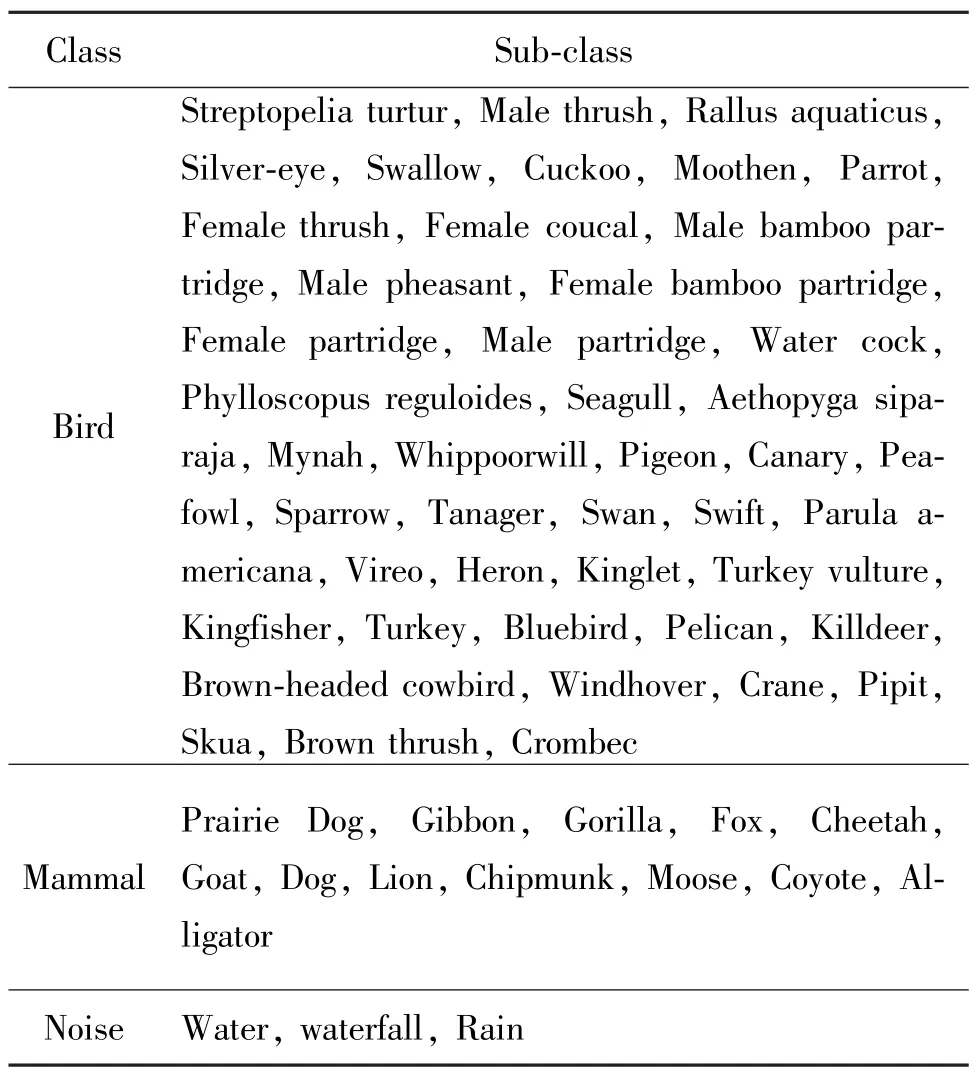
Table 2 60 subclasses of 3 classes of ecological sounds
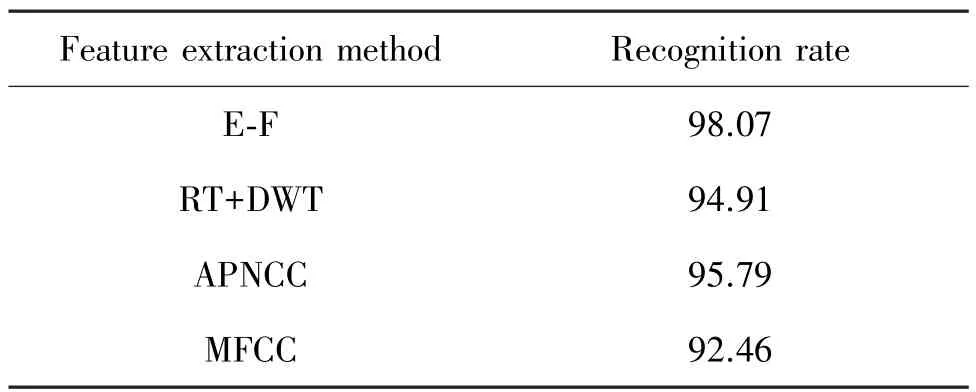
Table 3 The recognition rate of four different methods in noiseless environment%
However,in actual situation,there is no noiseless environment.To solve the problem,the paper applies the sound of water,waterfall and rain to simulate the real environment.And experiment is made with the noises which have different SNRs,to obtain the results.
Fig.6 shows the results of the first group of exper⁃iment.It shows the recognition effects of four kinds of methods under three different noisy environments after de⁃noising by IMSS.It can be known that the recogni⁃tion effect of the method proposed in the paper is better than the other three methods when the SNRs are within the range of 0 to 40 dB.When the SNR is above 10 dB,the recognition rate of the E⁃F feature extrac⁃tion is higher than 90%.And it can be got that the RT+DWT can improve the recognition rate in low SNR en⁃vironment,but the recognition effect is not as good as the E⁃F feature in high SNR environment.Fig.6 shows that the recognition effect of the APNCC is not ideal and the MFCC can recognize the sound signals with high SNR,but is easily affected by the noise signal.
The main reason for the above results is that E⁃F feature and RT+DWT feature are based on the image which is relatively insensitive to noise.Due to that E⁃F feature is based on the SPD image and the sub⁃band division spectrogram,it can describe the sound signal more effectively.While APNCC and MFCC feature ex⁃traction are based on the analysis of the signal frame,they are more sensitive to signal absence and signal ad⁃dition.Thus the change of signal may directly affect the recognition accuracy.
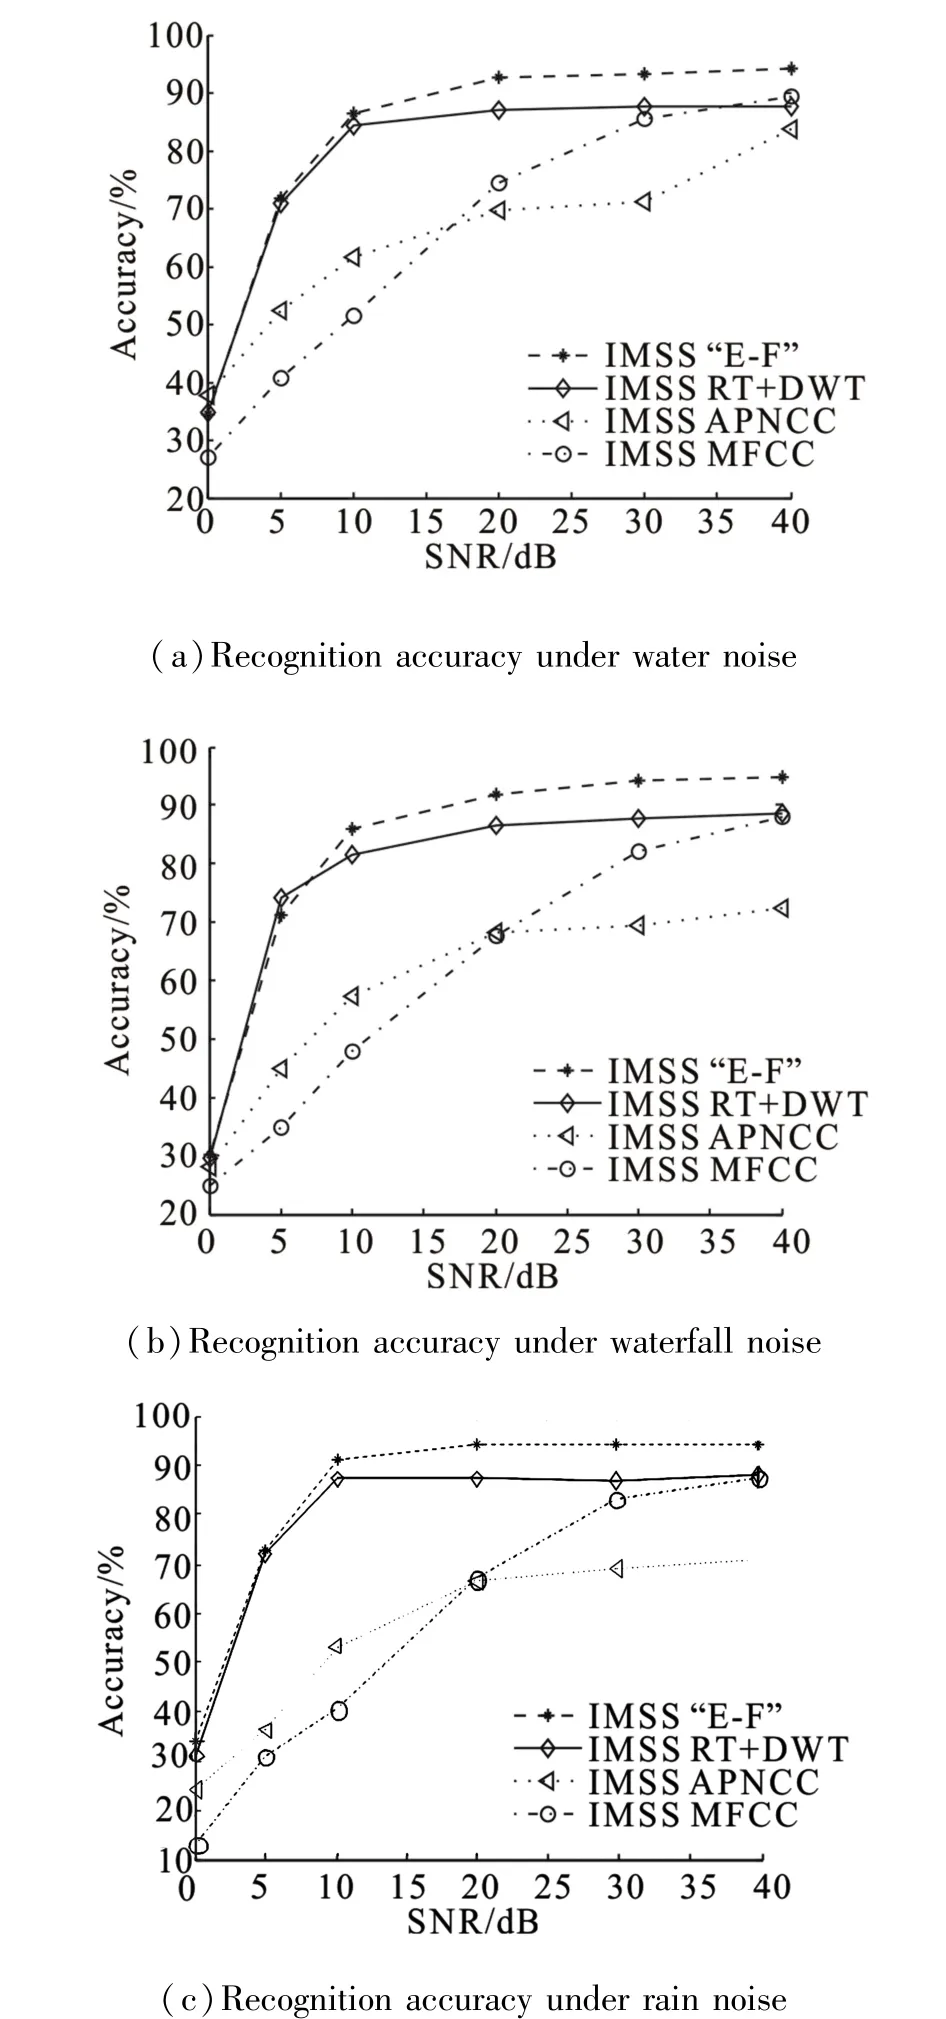
Fig.6 Recognition accuracy under three kinds of noises
Table 4 shows the results of the second group ex⁃periment.It can be seen that the average recognition rate of the method proposed in the paper is about 20% higher than that in the Ref.[18]and about 22%high⁃er than the popular MFCCs.Through the comparison of specific data,it can be got that the recognition rates of Ref.[18]and popular MFCC have increased when in high SNR environment,while in low SNR environ⁃ment,the E⁃F feature has obvious advantages and the recognition effect is better than the other two methods.
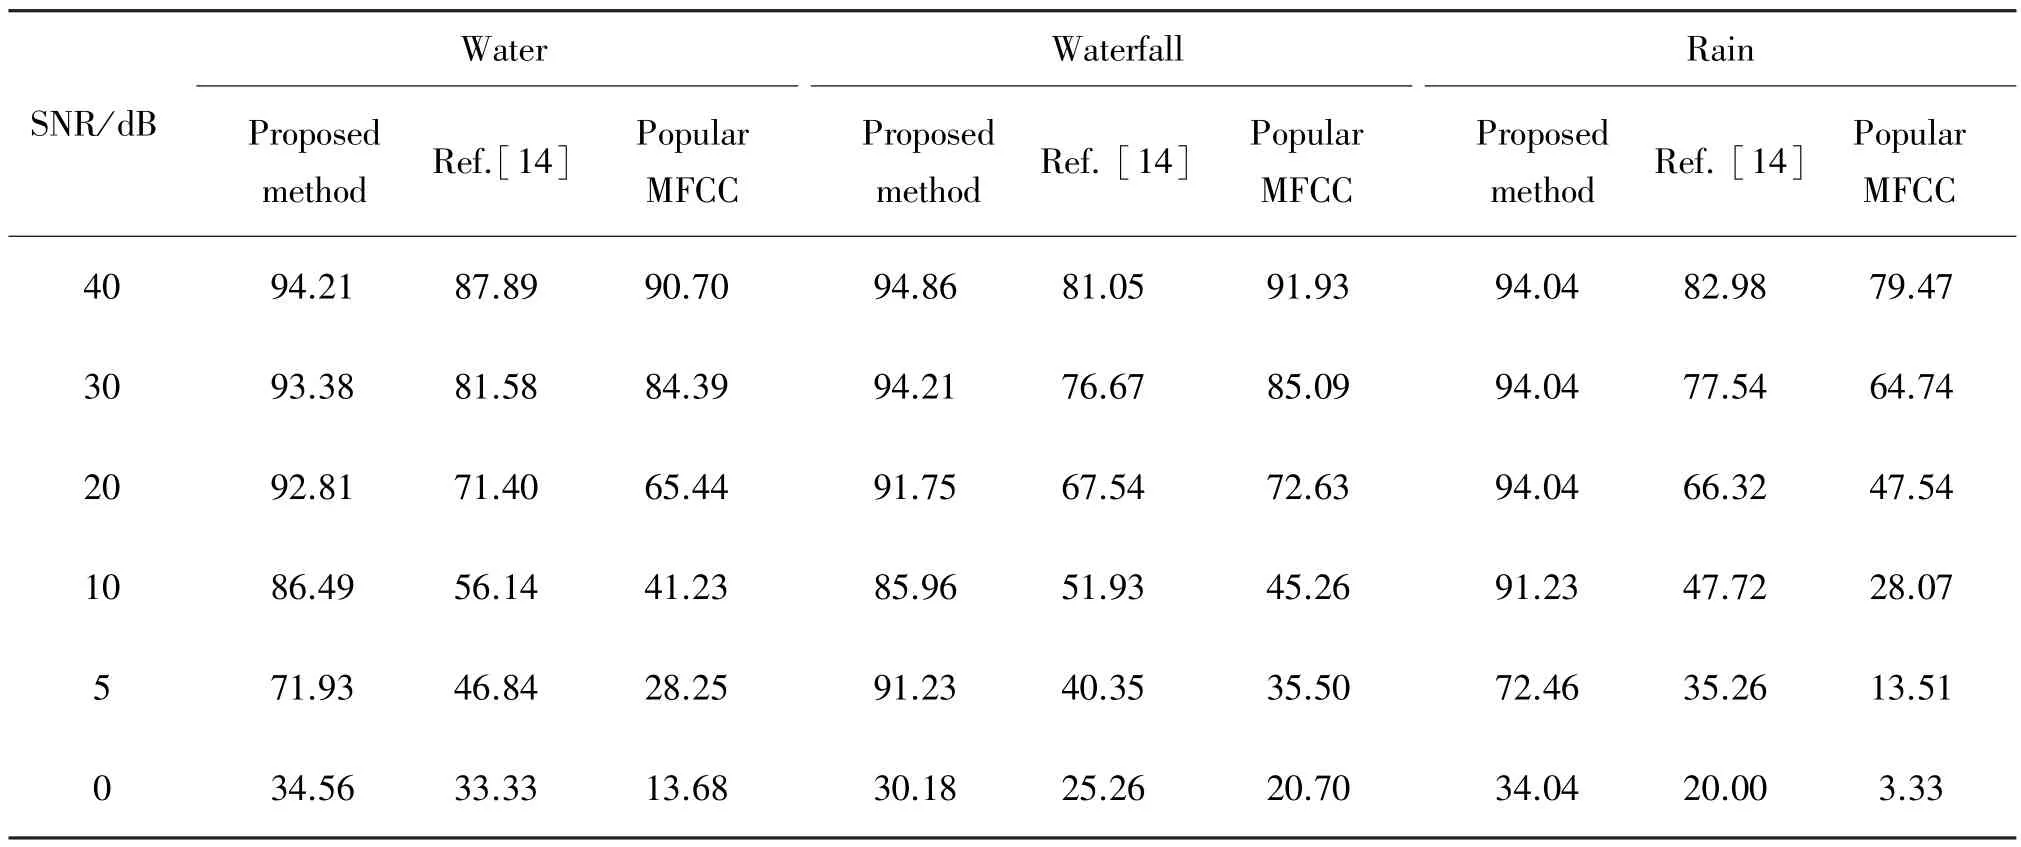
Table 4 The recognition accuracy of three kinds of methods under different noisy environments%
4 Conclusions
For animal sound recognition in a noisy environ⁃ment,this paper adopts IMSS to reduce noise,and puts forward the E⁃F feature extraction method.The ex⁃perimental results show that the recognition accuracy of this method is obviously higher than popular MFCC and APNCC under non⁃stationary noise environment.The results of experiments show that the proposed method can effectively improve the recognition rate of animal sounds under low SNR environments,and has high noise resistance and robustness.The fact that the IMSS has affected the sound signal leads to the concentration of recognition rates on about 94%even in a high SNR environment.The next step of this research work is mainly to reduce the influence of the de⁃noising method for sound signals.
[1]CHOU C H,LIU P H.Bird species recognition by wavelet transformation of a section of birdsong[C]//Symposia and Workshops on Ubiquitous,Autonomic and Trusted Compu⁃ting.Brisbane,Australia,2009:189⁃193.
[2]CHEN W P,CHEN S S,LIN C C,et al.Automatic recog⁃nition of frog calls using a multi⁃stage average spectrum[J].Computers&Mathematics with Applications,2012,64(5):1270⁃1281.
[3]CHU S,NARAYANAN S,KUO C C J.Environmental sound recognition with time⁃frequency audio features[J].IEEE Transactions on Audio,Speech,and Language Pro⁃ cessing,2009,17(6):1142⁃1158.
[4]KHUNARSAL P,LURSINSAP C,RAICHAROEN T.Very short time environmental sound classification based on spec⁃trogram pattern matching[J].Information Sciences,2013,243:57⁃74.
[5]YOU Guanyu,LI Ying.Environmental sounds recognition u⁃sing TESPAR[C]//2012 5th International Congress on Im⁃age and Signal Processing(CISP).Chongqing,China,2012:1796⁃1800.
[6]DENNIS J,TRAN H D,CHNG E S.Image feature repre⁃sentation of the subband power distribution for robust sound event classification[J].IEEE Transactions on Audio,Speech,and Language Processing,2013,21(2):367⁃377.[7]AJMERA P K,JADHAV D V,HOLAMBE R S.Text⁃inde⁃pendent speaker identification using Radon and discrete co⁃sine transforms based features from speech spectrogram[J].Pattern Recognition,2011,44(10/11):2749⁃2759.
[8]JAFARI⁃KHOUZANI K,SOLTANIAN⁃ZADEH H.Rotation⁃invariant multiresolution texture analysis using Radon and wavelet transforms[J].IEEE Transactions on Image Pro⁃cessing,2005,14(6):783⁃795.
[9]JADHAV D V,HOLAMBE R S.Radon and discrete cosine transforms based feature extraction and dimensionality re⁃duction approach for face recognition[J].Signal Processing,2008,88(10):2604⁃2609.
[10]JADHAV D V,HOLAMBE R S.Feature extraction using Radon and wavelet transforms with application to face rec⁃ognition[J].Neurocomputing,2009,72(7/8/9):1951⁃1959.
[11]COHEN I,BERDUGO B.Noise estimation by minima con⁃trolled recursive averaging for robust speech enhancement[J].IEEE Signal Processing Letters,2002,9(1):12⁃15.[12]KAMATH S,LOIZOU P.A multi⁃band spectral subtraction method for enhancing speech corrupted by colored noise[C]//IEEE International Conference on Acoustics Speech and Signal Processing(ICASSP).Orlando,USA,2002:4164⁃4164.
[13]CHIEMENTIN X,KILUNDU B,RASOLOFONDRAIBE L,et al.Performance of wavelet denoising in vibration a⁃nalysis:highlighting[J].Journal of Vibration and Con⁃trol,18(6),2012:850⁃858.
[14]LIU Xiang,GAO Yong.Speech enhancement algorithm with leading⁃in delay[J].Modern Electronics Technique,2011,34(5):85⁃88.
[15]LI F Q,WAN H,HUANG J J.The display and analysis of sonogram based on MATLAB[J].Microcomputer Informa⁃tion,2005,21(10⁃3),172⁃174.(in Chinese)
[16]Universitat Pompeu Fabra(UPF)[EB/OL].[2014⁃05⁃09].http://www.freesound.org.http://www.freesound.org.
[17]FreeSFX.co.uk Team[EB/OL].[2014⁃05⁃09].http://www.freesfx.co.uk/soundeffects.
[18]YAN Xin,LI Ying.Anti⁃noise power normalized cepstral coefficients in bird sounds recognition[J].Acta Electroni⁃ca Sinica,2013,41(2):295⁃300.(in Chinese)
[19]CHANG C C,LIN C J.LIBSVM:a Library for Support Vector Machines[EB/OL].[2014⁃05⁃15].http://www.csie.ntu.edu.tw/~cjlin/libsvm.
About authors:
LI Ying was born in 1964.He re⁃ceived the B.S.degree in industrial auto⁃mation in 1989,the M.S.degree in sys⁃tem engineering in 1993 and the Ph.D.degree in computer science and technology in 2004,all from Xi’an Jiaotong Univer⁃sity,Xi’an,China.Since 2011,he has been a professor at the College of Mathematics and Computer Science of Fuzhou University,Fuzhou,China.His current re⁃search interests are environmental sound recognition and infor⁃mation security.He has published more than 20 papers and 6 patents in these areas.
TP391.4 Document code:A Article ID:1673⁃4785(2015)05⁃0810⁃10
10.11992/tis.201408028
:ZHOU Xiaomin,LI Ying.Anti⁃noise sound recognition based on energy⁃frequency feature[J].CAAI Transactions on Intelligent Systems,2015,10(5):810⁃819.
Received Date:2014⁃08⁃21. Online Publication:2015⁃10⁃14.
Foundation Item:Supported by the National Natural Science Foundation of China(No.61075022).
LI Ying.Email:fj_liying@fzu.edu.cn.