A Novel Method to Monitor Coal Fires Based on Multi-Spectral Landsat Images
2016-06-15 16:40XIAQingHUZhenqi
光谱学与光谱分析 2016年8期
XIA Qing, HU Zhen-qi
China University of Mining and Technology (Beijing), Beijing 100083, China
A Novel Method to Monitor Coal Fires Based on Multi-Spectral Landsat Images
XIA Qing, HU Zhen-qi*
China University of Mining and Technology (Beijing), Beijing 100083, China
Coal fires pose a serious threat to the environment worldwide, and they are responsible for atmospheric pollution, water contamination, land subsidence and the safety of miners. The multi-spectral Landsat images offer the possibility of detecting and monitoring coal fires at large scales. In this study, the thermal infrared spectral is extracted, and a mono-window algorithm is used for retrieving coal fire temperature. However, the surface emissivity and atmospheric water vapor content play important roles in determining the temperature for this algorithm. The surface emissivity is particularly difficult to obtain with satellite overpasses because it is affected by a variety of factors. In general, an average emissivity value is assigned to represent all land cover categories, which leads to a big error for retrieving coal fire temperature. Meanwhile, atmospheric water vapor content is calculated by simulating atmospheric profile through standard atmosphere models. However, it is difficult to obtain real water vapor content and atmospheric profile is affected by many factors with each satellite pass. The lack of knowledge of the real atmospheric profile is a large constraint, and inaccurate simulation can introduce big errors. Aiming at overcoming drawbacks mentioned above and increasing the accuracy for this algorithm, the NDVI threshold method is applied to estimate surface emissivity. The NDVI threshold method separates different land cover categories, and different emissivity is assigned to different land cover classifications. Based on the ground meteorological parameters' relationship between atmospheric water vapor and atmospheric water vapor pressure, an empirical relationship is found to estimate atmospheric water vapor content. For this method, the ground meteorological parameters are easily obtained from meteorological observation stations and it is convenient to estimate water vapor content. The mono-window algorithm is improved and coal fire temperature is retrieved. This methodology was applied to the Wuda coalfield, in China, and coal fire temperatures were retrieved and extracted from the background from 1988 to 2015 in the study area. A thorough inventory of coal fire areas and locations is annually presented, and area changes are qualitatively analyzed during the observation period. This method is considered as feasible and effective for retrieving and monitoring coal fires based on multi-spectral Landsat images in comparison to other techniques in the Wuda coalfield, China.
Multi-spectral; Thermal infrared spectral; a mono-window algorithm; NDVI threshold method
Introduction
Uncontrolled coal fires are a serious problem on a global scale. China is the largest coal producer in the world. Coal fires are an environmental catastrophe characterized by an increase in ambient temperature, the emission of noxious gases, land subsidence and collapse of surface ground. Moreover, coal fires lead to enormous valuable resource consumption: it is estimated that as much as 100-200 million tons of coals are consumed annually as a result of coal fires[1].
Borehole temperature measurements have become the main method to detect subsurface coal fires until the 1960s. The temperature was measured in a point-to-point way and was an in-situ measurement, therefore it offered a relatively high accuracy. However, it is difficult to obtain enough coal fire data at large scales. When airborne thermal sensors and satellite thermal sensors gradually started to become available in the early 1960s, coal fires retrieving and monitoring based on multi-spectral images became possible over an entire mining area. Slavecks et al.[2]used thermal infrared images to study and locate underground coal fires in Pennsylvania. Cracknell and Mansoor et al.[3]first applied Landsat Thematic Mapper (TM) and Advanced Very High Resolution Radiometer (AVHRR) data to detect coal fires. They found that AVHRR thermal band3 (3.55~3.93 μm) could detect coal fires and indicated the temperature difference between day-time and night-time. Later Prakash et al.[4]used night-time images from Landsat TM thermal band6 (10.4~12.5 μm) to carry out monitoring and integrating images to map coal fires distribution in the Rujigou coalfield, China. Martha et al.[5]studied winter thermal infrared band and found that winter images were better than summer in detecting thermal anomalies for India coal fires. Chatterjee[6]discussed some important issues on coal fires retrieving from Landsat TM thermal band (10.4~12.5 μm). Mishra et al.[7]utilized Landsat Enhance Thematic Mapper Plus (ETM+) thermal band6 data in combination with thermal camera to detect coal fires in the Jharia Coal Field, India.
The temperature in coal fire zones is higher than background land surface temperature, which allows thermal infrared spectral bands to be used in coal fire temperature retrieval. The Landsat satellite series has acquired millions of spectral images of the earth from space over a 16-day revisit interval, which makes it an unique resource for multi-temporal observation. A mono-window algorithm has been widely developed and used to retrieve coal fire temperatures because it used a single thermal infrared spectral band (10.4~12.5 μm) and only requires two basic prior parameters, surface emissivity and atmospheric water vapor content[8].
Surface emissivity plays an important role in determining coal fire temperature. However, it is particularly difficult to obtain with satellite overpasses because it is affected by a variety of factors, such as ground wetness, structure and roughness, etc[9]. This leads to most researchers assigning an average emissivity value to represent all land cover categories, which introduced a coal fire temperature error ranging from 0.2 to 1.4 K[10]. Therefore, NDVI thresholds method is introduced in this study to estimate surface emissivity for different land cover categories. Atmospheric water vapor content is still very critical in coal fire temperature retrieval. Because the mono-window algorithm requires an atmospheric profile updated for each satellite pass, most researchers focus on simulating atmospheric profile through standard atmosphere models to obtain atmospheric water vapor content. However, it is difficult to obtain real water vapor content because the atmospheric profile is affected by many factors. The lack of knowledge of the real atmospheric profile is a large constraint, and inaccurate simulation can introduce big errors. The alternative is to make use of in-situ atmospheric profile data from local meteorological observation stations to obtain real water vapor content. However, it is impossible to collect meteorological data for all the areas because there are too few meteorological observation stations near the study area. Therefore, a method proposed by J.M. Yang is used to estimate atmospheric water vapor content[11]. Yang found that there is a relationship between atmospheric water vapor content and water vapor pressure and developed a practical method to estimate water vapor content in China, taking altitude and elevation into consideration for higher accuracy. All parameters used in this method were available from local meteorological observation stations.
In this study, a new improved mono-window algorithm is used to retrieve surface coal fire temperatures with multi-spectral (thermal infrared spectral band 6) Landsat images. Then, the distribution of coal fire temperature from 1988 to 2015 is annually presented. The change and direction of coal fire zones are quantitatively analyzed in long-term series. It will become a powerful method to retrieve coal fire temperature, locate thermal anomaly zones, and dynamically monitor coal fire. Meanwhile, understanding the distribution and propagation of coal fires are also important factors for the related authority to initiate the necessary measures to prevent coal fire hazards.
1 Data
1.1 Study area
The Wuda coalfield is a representative case for coal fires that have been burning for at least 50 years. The study area is located in the Inner Mongolia region of China, with a latitude of 39°27′N to 39°34′N and longitude of 106°34′E to 106°40′E (Fig.1). This area is physically bounded by the Helan Mountain in the south, the Ulan Buh Desert in the north and west and the Yellow River in the east. The maximum extent of the Wuda coalfield from north to south is 10 km and from east to west is 3~5 km, with a total area of 35 km2and an average elevation ranging between 1 100 and 1 300 m.

Fig. 1 The location of the study area
This area has a mild continental climate with average annual precipitation ranging from 150 to 250 mm. The maximum annual precipitation takes place between June and August, which coincide with high temperatures and evaporation rate. The average annual temperature is 9 ℃.
1.2 Data
In order to effectively retrieve coal fire temperatures over three decades in a high spatial resolution, multi-spectral images from Landsat served as the primary data source. Because Landsat5 TM can’t cover the whole observation period of 28 years, Landsat7 ETM+ and Landsat8 (OLI and TIRS) were also selected for this study. Landsat5 TM and Landsat7 ETM+ have almost the same spectral bands, and the spectral wavelengths from band1 to band7 are 0.45~0.52, 0.52~0.6, 0.63~0.69, 0.76~0.9, 1.55~1.75, 10.4~12.5 and 2.08~2.35 μm. For Landsat8 (OLI and TIRS), thermal infrared spectral bands include band10 and band11. The wavelength is 10.6~11.2 and 11.5~12.5 μm.There are no images in 1996, 1997, 1998, 2008 and 2012 or these images have a poor quality level, which is not suitable for the study. 24 scenes of multi-spectral images are used from 1988 to 2015 in this study.
2 Methodology
2.1 Coal fire temperature retrieval
Landsat multi-spectral images received raw digital number (DN) values. The first step is to convert DN values to spectral radiance as following based on Planck’s blackbody radiation equation[12].
(1)
WhereLλis the spectral radiance received by the satellite sensor, [watts·(m2·sr·μm)-1].Lmin(λ)is minimum detected spectral radiance, (1.238 W·m-2·sr-1·μm-1for TM, 0 Wm-2·sr-1·μm-1for ETM+).Lmax(λ)is the maximum detected spectral radiance, (15.303 W·m-2·sr-1·μm-1for TM, 17.04 W·m-2·sr-1·μm-1for ETM+).Qcalmaxis maximum grey level (255).Qcalis grey level of analyzed pixel.
The second step is to transform spectral radiance to radiant temperature. Radiant temperature can be calculated in equation (2).
(2)
WhereTRis radiant temperature (brightness temperature) in Kelvin.K1andK2are prelaunch calibration constants (K1=607.76 W·m-22·sr-1·μm-1,K2=1 260.56 K for Landsat TM andK1=666.09 W·m-22·sr-1·μm-1,K2=1 282.71 K for Landsat ETM). These parameters can be obtained from the Landsat Project Science Office, 2002.
A mono-window algorithm is applied to convert radiant temperature into surface temperature. The calculation can be done in equation (3).
(3)
WhereTsis land surface temperature in K.TRis radiant temperature in K computed from Landsat thermal infrared band.Tais effective mean atmospheric temperature in K.a6andb6are constants, 67.355 351 and 0.458 606, respectively when the surface temperature is ranging between 273.5 and 343.5 K.C6andD6can be given by
(4)
(5)
Whereεis the land surgace emissivity andτ6is the atmospheric transmittance. According to the work of Qin et al.,τ6could be estimated by atmospheric water vapor content. Table 1 shows the estimation for atmospheric transmittance at different water vapor conditions.
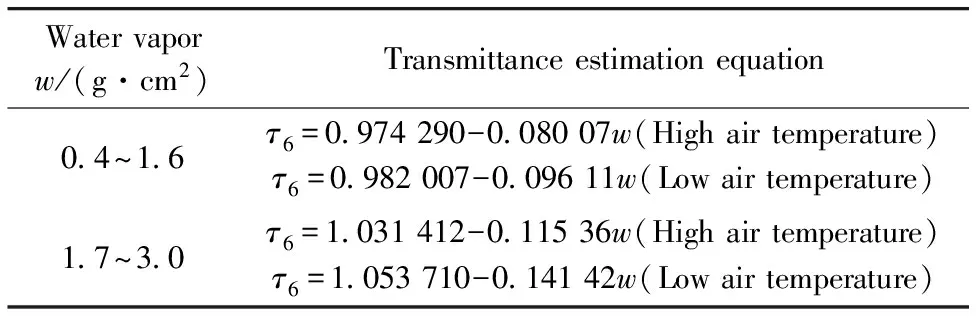
Table 1 Atmospheric transmittance estimation
Qin also made use of the linear equations corresponding to the four standard atmospheres to calculateTa.
Ta=25.939 6+0.880 45T0(ForUSA1976)
Ta=17.976 9+0.917 15T0(Fortropicalarea)
Ta=16.011 0+0.926 21T0(Formid-latitudesummer)
Ta=19.270 4+0.911 18T0(Formid-latitudewinter)
(6)
T0is the near-surface air temperature that can be easily acquired from the China Meteorological Data Service Center (http://www.escience.gov.cn/metdata/page/index.html).
In this study, we use statistical criteria for thresholding by extracting the highest 11% temperature range in each image as coal fire zones[13]. Fig.2 is a flowchart of the data processing and analysis in this study.
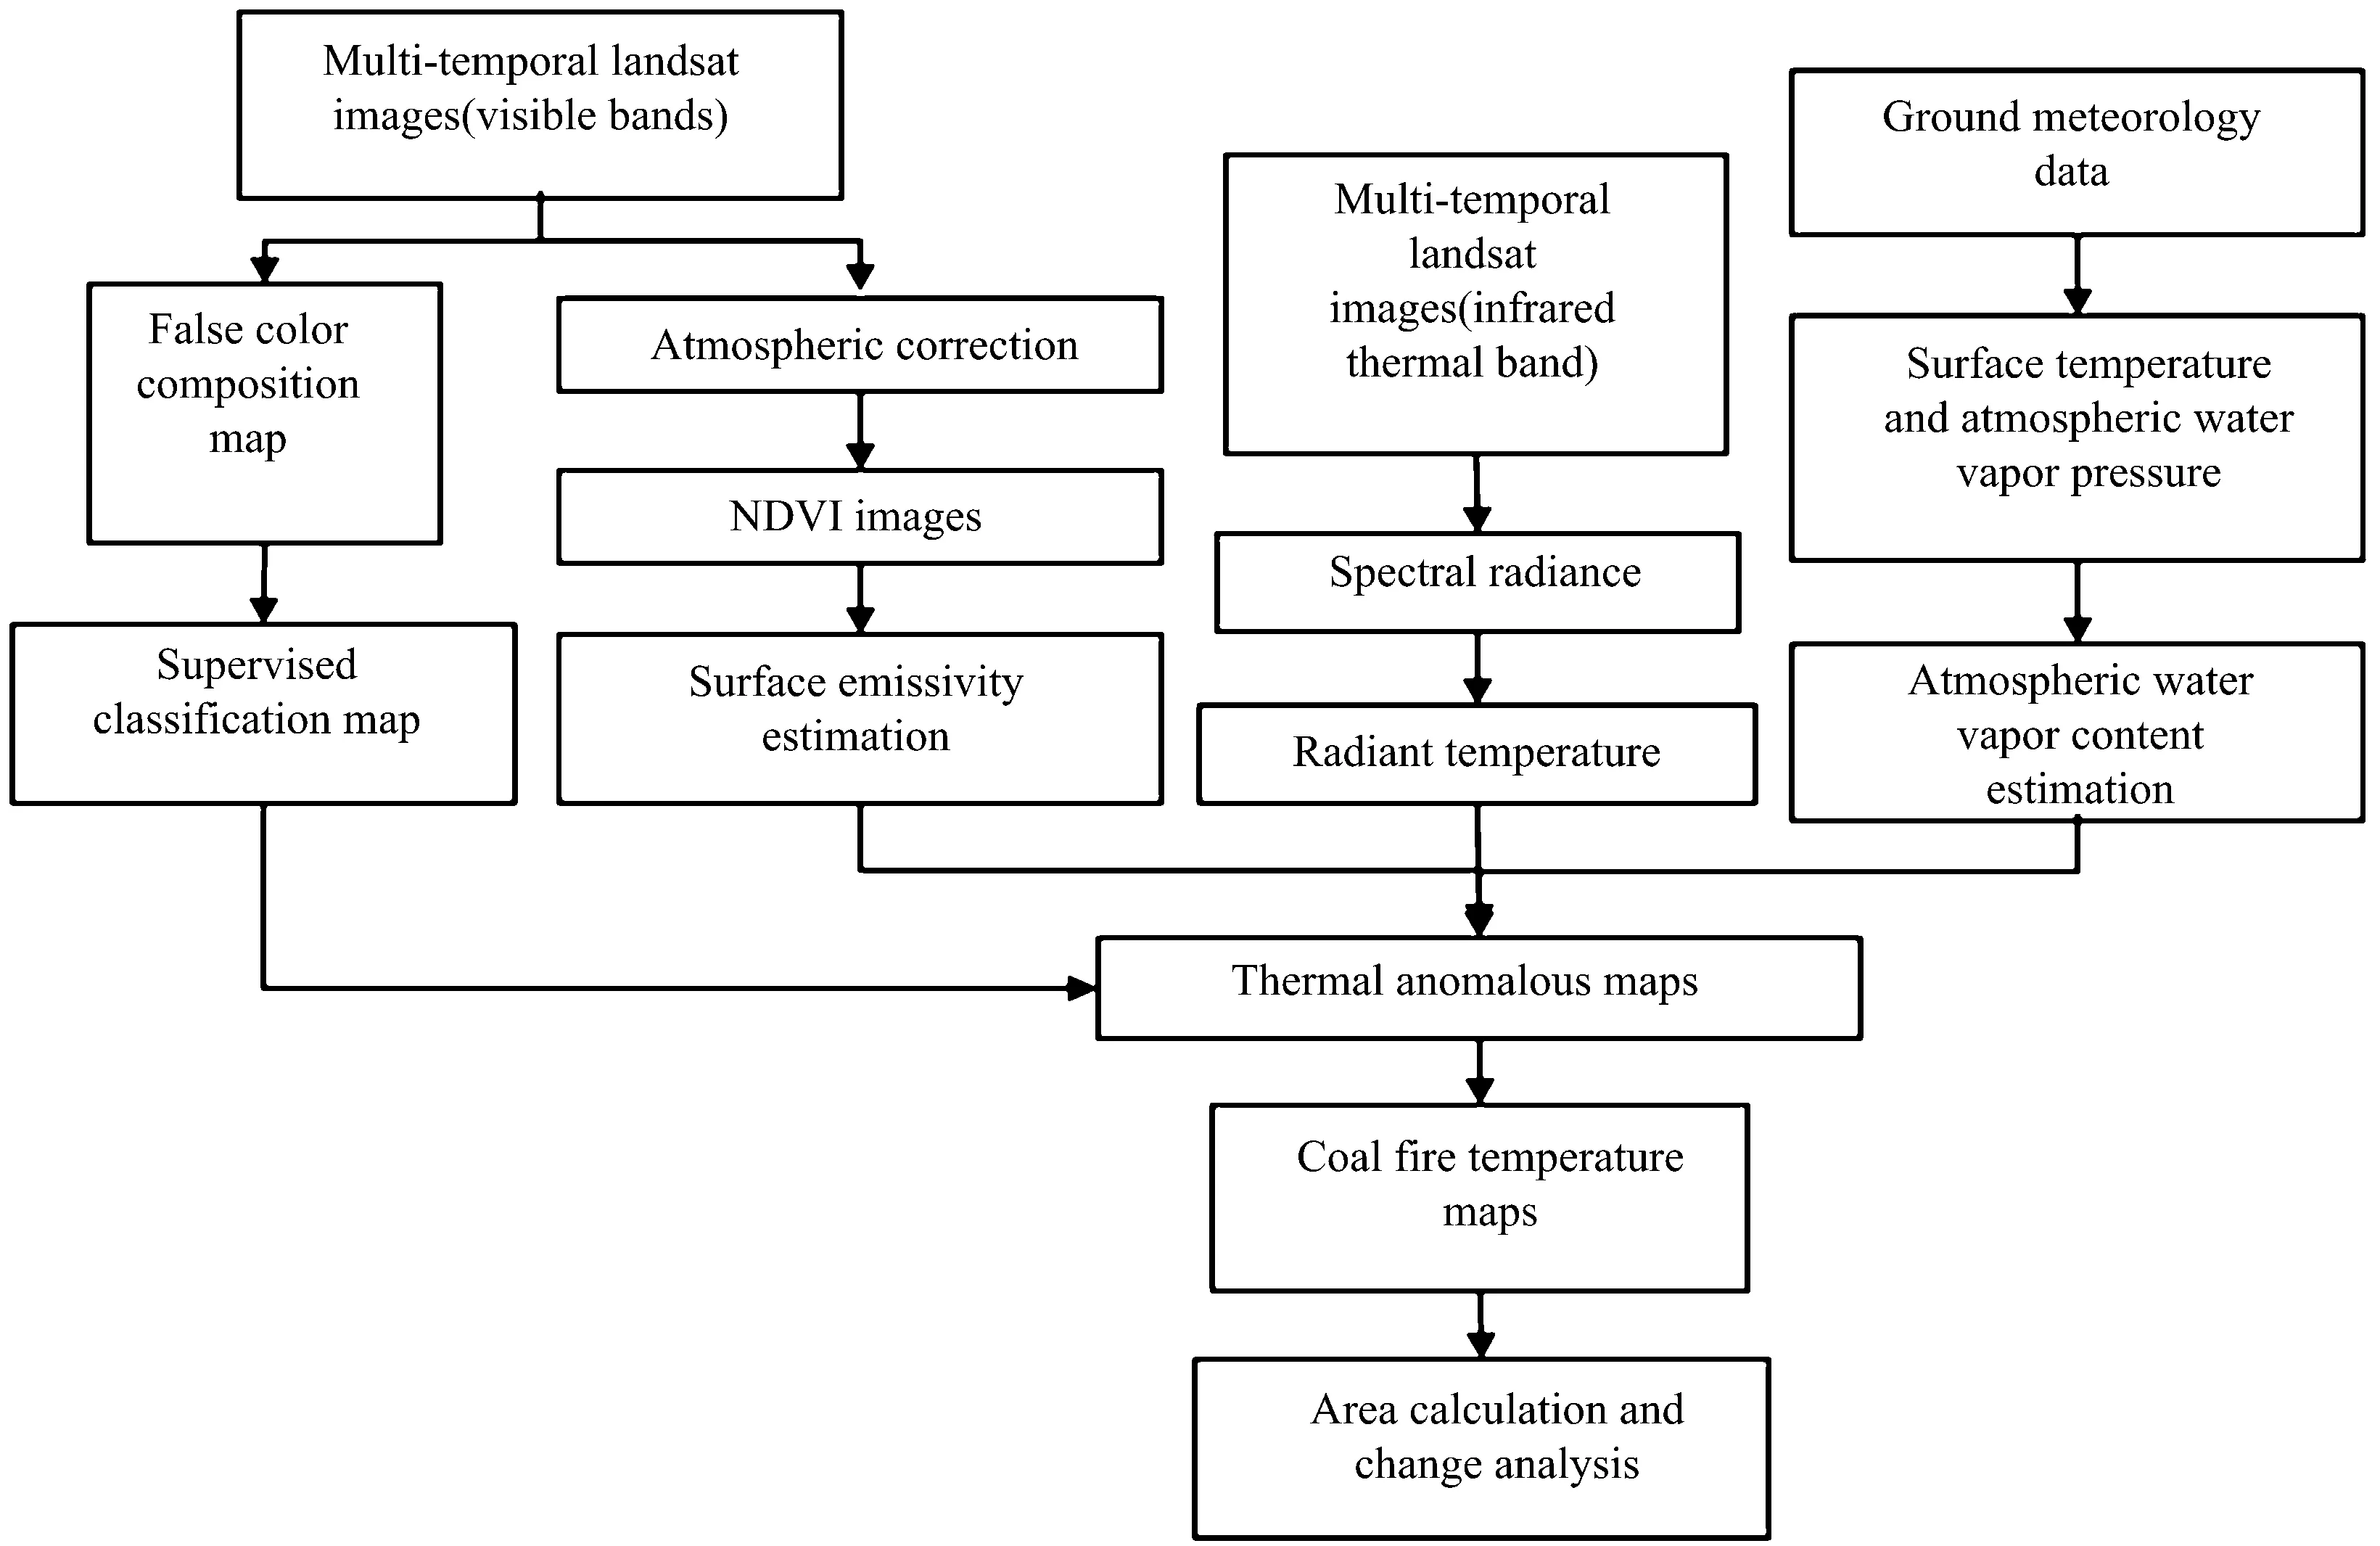
Fig.2 Flowchart of the method and analysis
2.2 Surface emissivity estimation
Reviews on different surface emissivity estimation methods were given in the literature[14-18]. The NDVI thresholds method (NDVITHM) developed by Sobrino[19]was used in this study to separate bare soil, partially vegetated soil and fully vegetated land and presented a good performance in comparison to other methods.
For different cases, the emissivity value can be calculated as following:
(1) NDVI<0.2
The pixels are considered as bare soil. The emissivity values are obtained from the red spectral band.
ε=0.979-0.035ρ3
(7)
(2) NDVI>0.5
The pixels are considered as fully vegetated and a constant value for the emissivity is assumed. Typically, 0.99 is adopted and assigned to all pixels with NDVI values higher than 0.5.
(3) NDVI0.2≤NDVI≤NDVI0.5
The pixels are considered to be composed by a mixture of bare soil and full vegetation. The emissivity of the inherent heterogeneous surface is calculated according to the following equation
(8)
whereεvandεsare the emissivities of vegetation and bare soil, respectively.Pvis the vegetation proportion.Cλis a term that takes into account the internal reflections and is given as
(9)
WhereFis a geometrical factor depending on the geometrical structure of vegetation. In general, a mean value of 0.55 is chosen forF.Pvis the vegetation proportion computed from the NDVI values according to the following equation
(10)
Where NDVIvand NDVIsare the NDVI values for bare soil and full vegetation, 0.5 and 0.2, respectively. By substituting equations (10), (11) into equation (9), the emissivity of the mixed pixels can be determined and the final expression is given by
ε=0.986+0.004Pv
(11)
2.3 Atmospheric water vapor content estimation
Standard atmosphere and aerosol models have difficulty in estimating atmospheric transmittance. In some remote areas in China, models fail to work due to the absence of space exploration data from satellite overpasses. Yang et al. developed an empirical relationship method, which was particularly suited for the climatic conditions in China, to estimate atmospheric water vapor content by collecting meteorological data from 28 ground meteorological observation stations scattered around China. It can be given by
W=a0+a1e+a2e2
(12)
WhereWis atmospheric water vapor.eis atmospheric water vapor pressure, anda0,a1anda2are empirical factors. For most areas in China,a2is approximately equal to 0. For southern China, which refers to the south of Nanling and Wuyi Mountain, the east of Yungui Plateau and the north of Hainan Province with the altitude higher than 20°,a2=-0.002, the relationship can be simplified to a linear relationship, given as following.W=a0+a1e
(13)
whered1,d2,d3,d4are parameters and be given by
Whereφis altitude (°) and H is elevation (km).
The sensitivity and accuracy analysis has been conducted and it is concluded that there is a positive relationship between atmospheric water vapor content and atmospheric water vapor pressure, with the correlation coefficient higher than 0.92 and the mean relative maximum error lower than 20%.
3 Results and discussion
3.1 Coal fire temperature validation
Coal fire temperature was retrieved by a mono-window algorithm improved by NDVITHMand the empirical relationship method. The images in 1988, 1996, 2007, 2015 were chosen as validation images (Fig.3). It can be found that the zones with higher temperature than those of coal fire were

Fig.3 Coal fire maps in 1988,1996,2007,2015
located in the northwest, west and southwest. This is because the images were obtained in the daytime in summer and these zones covered by sand and rock had higher radiation, which led to a higher temperature than other zones. Therefore, supervised classification with the maximum likelihood algorithm was performed to classify images in order to remove the disturbance of sandy and rocky zones in the northwest, west and southwest (Fig.4). Fig.5 presents the results without the disturbance of sandy and rocky zones.
It is very difficult to collect historical field validation data each year. Therefore, the reliability of coal fire temperature is validated with the results from Jiang and Claudia Kunzer[20-21]. For Jiang’s work, the coal fire areas in 1989, 2001, 2005 and 2008 were 2.468, 3.402, 3.449 and 2.638 km2, respectively. In this study, coal fire areas were 2.779 2, 3.268 8, 4.032 and 2.361 6 km2, respectively (Fig.6). Compared with Jiang’s results, the maximum area difference during the observation period was 0.58 km2and coal fire distributions and identification were similar to this study. For Claudia Kunzer’s work, coal fire zones identification and quantitative analysis from 2000 to 2005 were conducted. It is suggested
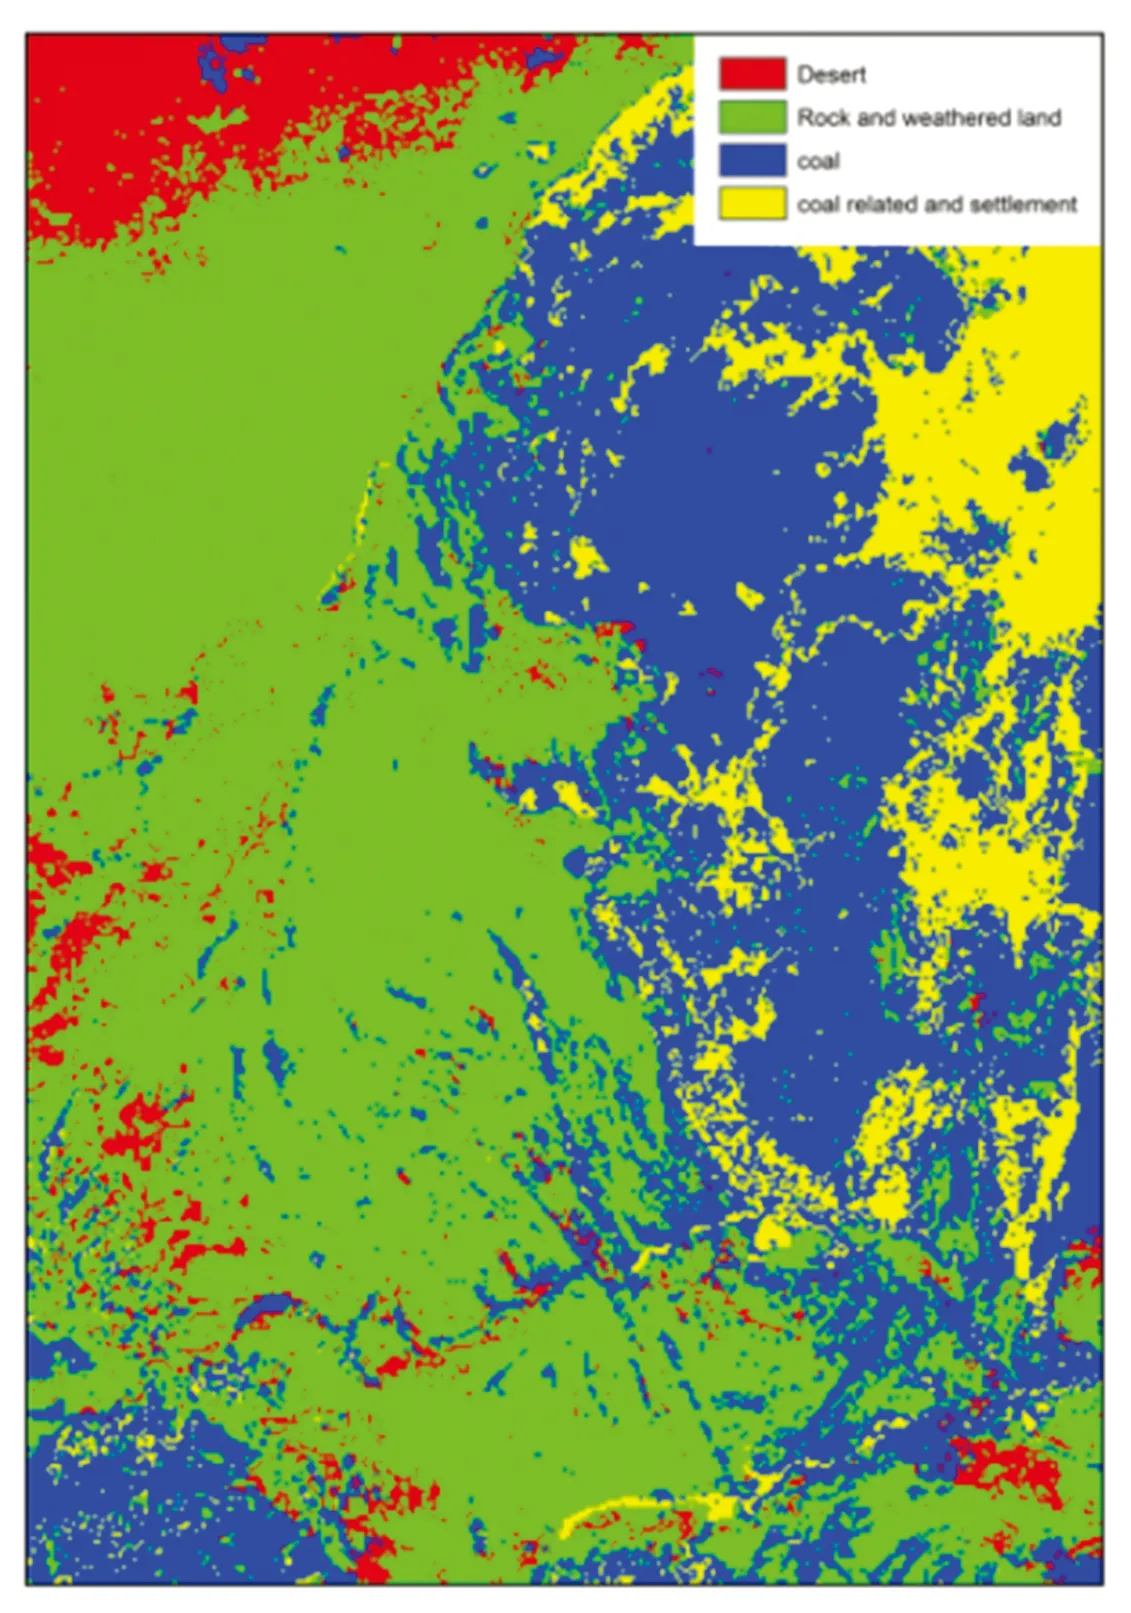
Fig.4 Supervised classification image
that coal fire identification and quantitative analysis in this study were almost the same with previous studies in comparison with the published results. Although, the validation is limited to some extent due to only a few coal fire images and data, the validation is still reliable and applicable.
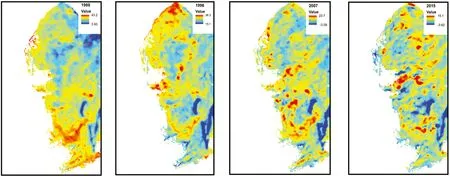
Fig. 5 The image without the disturbance
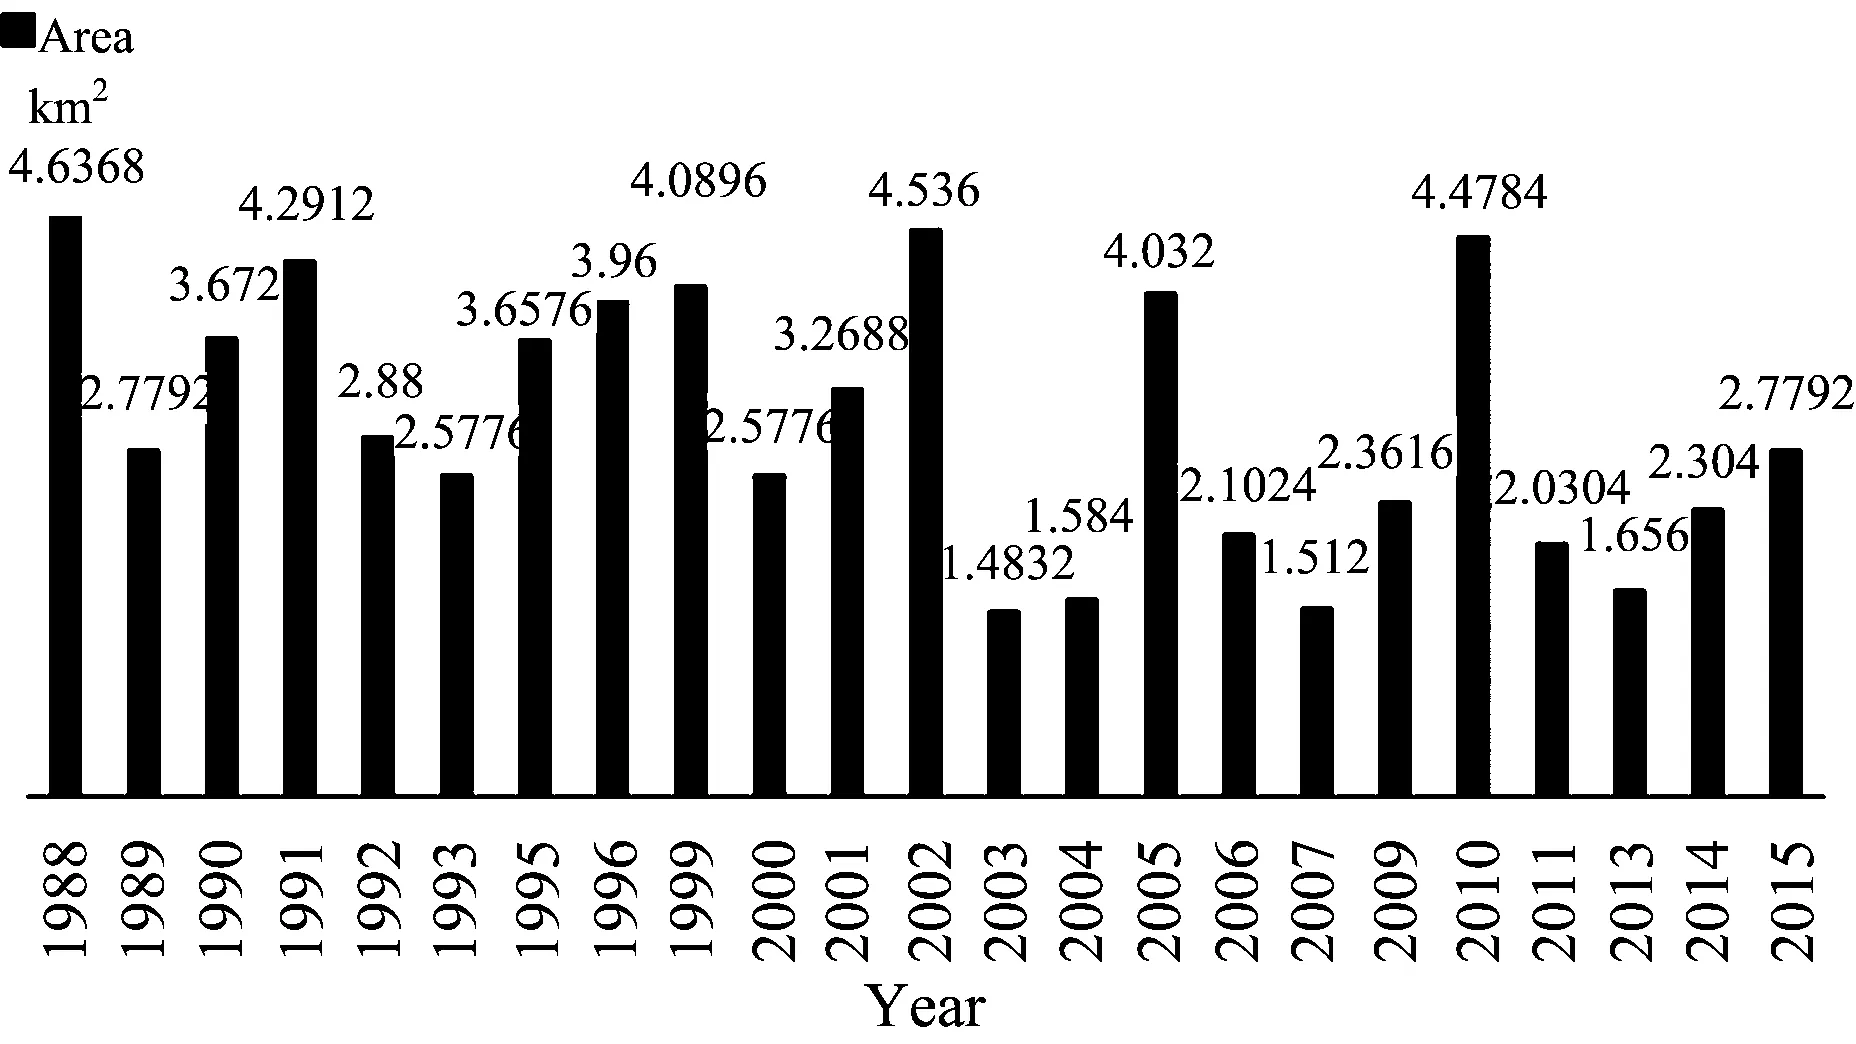
Fig.6 Coal fire areas each year
3.2 Coal fire zones distribution and analysis
Through a spatial overlay analysis of coal fire zones every four years by the ArcGIS software, the spatial distribution, coal fire zone area, area change and tendency can be determined. Fig.6 illustrates coal fire areas each year.
As evident from Fig.6, it can be seen that the coal fire area decreased from 4.63 km2in 1988 to 2.77 km2in 1989, and then a growth of 1.52 km2was found from 1989 to 1991, which was almost the same in 1988. After two years, the coal fire area went down to 2.57 km2in 1993, and then gradually began to make a recovery to 4.08 km2in 1999. Afterwards, a sharp fall down to 2.57 km2in 2000 happened, but considerably increased up to 4.53 km2again in 2002 and then it followed a sharp decrease in 2003, which was the lowest area during the observation period. There was no evident difference between 2003 and 2004. The area dramatically increased up to 4.032 km2in 2005 but fell sharply down to 2.10 km2in 2006. It fluctuated slightly at about 2 km2between 2006 to 2009, because many old coal fire zones have been burning for many years without control. Some of them disappeared while others are still burning. Unfortunately, new coal fire zones are still occurring. The authorities were aware that it is a problem, therefore the extinguishing coal fire project has been carried out by the Chinese Ministry of Coal Industry at the beginning of 2006. However, extensive fire-fighting efforts were temporary, and some coal fires have restarted burning since 2009. The coal fire area rapidly soared from 2.36 km2in 2009 to 4.47 km2in 2010 and then dropped down to 1.656 km2in 2013. During 2013 and 2015, the area slowly went up to 2.77 km2in 2015. Overall, the change trend of coal fire was unstable and the area of coal fire zone fluctuated between 1.48 and 4.63 km2in the past 27 years.
Fig.7 presents coal fire distribution every four years. It can be found that coal fires in 1988 were distributed mostly in the south of the Wuda coalfield, and there were several small coal fire zones scattering in the north. Later, it is obvious that the area of coal fires in 1992 was less than that in 1988 (Table 3). The main coal fire zones in 1992 moved to the north and had a decreasing rate of 37.8%. Meanwhile, the distribution of coal fire zones in 1996 was almost the same as those in 1992. However, more small coal fire zones in 1996 generated and extended to the northwest and east and had an increasing rate of 37.5%. Then, the coal fire zones, which decreased by 1.39 km2in 2000, moved to the east and had dispersed into small parts. There were fewer coal fire zones in 2004 with a dramatically decreasing rate of 38.5%, and the distribution was uneven in the southwest and the north. It has been observed that the major coal fire zones in 2009 were similar with those in 2004; in addition to the 2004 coal fire zones, other several significant fire zones were found in the northwest and northeast in 2009. The increasing rate was 49.3% (nearly half) from 2004 to 2009. Then, fire zones in the north in 2013 had a decreasing rate, and the fire zones in the south in 2009 gradually disappeared. The total coal fire area in 2015 was a little larger than that in 2009. Small coal fire zones in 2015 emerged and formed a large zone in the middle. Meanwhile, some new fire zones in 2015 have been found in the northeast with the increasing rate of 67.8%; the distribution of small coal fire zones was uneven.
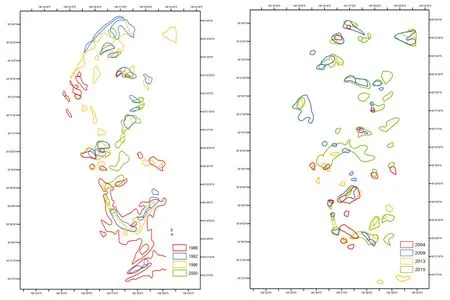
Fig.7 Coal fire area outline maps every four years
4 Conclusion
In this study, multi-spectral Landsat images and ground meteorological data were required for retrieving surface coal fire temperature. A mono-window algorithm was developed in combination with the NDVI thresholds method and the empirical relationship method. Surface emissivity was obtained from the application of the NDVI thresholds method, and atmospheric water vapor content was estimated by ground meteorological data, which was obtained easily from local meteorological observation stations. Supervised classification with the maximum likelihood algorithm was conducted to remove the disturbance of solar radiation in the rocky or sandy areas. Finally, the 11% range of the highest temperature in each image was extracted by statistical criteria and considered as coal fire zones.
An application of the method used in the Wuda coalfield in China is presented. The coal fire zones from 1988 to 2015 annually were extracted and analyzed. The area change of coal fire zones for each year was unstable and presented an erratic pattern . The area of coal fire zones fluctuated between 1.48 and 4.63 km2, and when it reached a relatively high area, it then decreased. After dropping, it again increased after two or three years. This cycle occurred during the observation period several times. In 1988, the coal fire zones were mainly distributed in the south of the Wuda coalfield. Approximately ten years later (in 1996), the distribution of coal fire zones gradually moved to the north. In 2009, it can be seen that the location of coal fire has not changed drastically. However, the area of coal fire zones decreased and began to disperse into small parts. In 2015, the distribution was not concentrated and gradually moved to the middle. Fortunately, it was observed that the coal fire areas has decreased in recent years because of the increasing awareness of environmental protection and fire-fighting projects. The study is important and useful for extinguishing coal fires, managing coal fires, and reducing the threat of coal fires.
Acknowledgement: The authors gratefully acknowledge the help from Professor Randolph H Wynne at Virginia Polytechnic Institute and State University (USA) for giving some key advice on this study. The authors want to give their special thanks to Adam James Oliphant at Virginia Polytechnic Institute and State University (USA) for his help. The authors convey their sincere gratitude and thanks to two anonymous reviewers for their suggestions and comments that helped improve the manuscript.
[1] Chen Y, Li J, Yang B. Journal of China University of Mining and Technology, 2005, 34: 226.
[2] Yin Shoujing, Wu Chuanqing, Wang Qiao, et al. Spectrocopy and Spectral Analysis, 2013, 33(12): 3339.
[3] Cracknell A P, Mansor S B. International Archives of Photogrammetry and Remote Sensing, 1992, 29: 750.
[4] Prakash A, Gupta R P, Saraf A K. International Journal of Remote Sensing, 1997, 18: 2463.
[5] Martha T R, Bhattacharya A, Vinod K K. Current Science, 2005, 88: 21.
[6] Chatterjee R S. ISPRS Journal of Photogrammetry and Remote Sensing, 2006, 60: 113.
[7] Wu Jian, Peng Daoli. Spectrocopy and Spectral Analysis, 2011, 31(9): 2305.
[8] Qin Z, Karnieli A, Berliner P. International Journal of Remote Sensing, 2001, 18: 583.
[9] Gillespie A R, Rokugawa S, Matsunaga T, et al. IEEE Transactions on Geoscience and Remote Sensing, 1998, 36: 1113.
[10] Dash P, Gottsche F M, Olesen F S, et al. International Journal of Remote Sensing, 2002, 23: 2561.
[11] Yang J M, Qiu J H. Chinese Journal of Atmospheric Sciences, 2002, 26: 9.
[12] Markham B L, Barkar J L. EOST Landsat Technical Notes 1. Earth Observation Satellite Company. Lanham, Maryland, 1986. 3.
[13] Prakash A, Gens R. Coal-Combustion and Geology, 2010, 1: 231.
[14] Sobrino J A, Raissouni N. International Journal of Remote Sensing, 2000, 21: 353.
[15] Valor E, Caselles V. Remote Sensing of Environment, 1996, 57: 167.
[16] Van D G, Owe M. International Journal of Remote Sensing, 1993, 14: 1119.
[17] Wang Futao, Wang Shixin, Zhou Yi, et al. Spectrocopy and Spectral Analysis, 2011, 31(3): 577.
[18] Weng Q, Eng Q. Photogrammetric Engineering and Remote Sensing, 2003, 69: 555.
[19] Kealy P S, Hook S J. IEEE Transactions on Geoscience and Remote Sensing, 1993, 31: 1155.
[20] Jiang W G, Zhu X H, Wu J J. Chinese Geographical Science, 2011, 21: 159.
[21] Kunzer C, Zhang J Z, Hirner A. Spontaneous Coal Seam Fires: Mitigating a Global Disaster. ERSEC Ecological Book Series, 2008. 132.
*通讯联系人
TP79
A
多光谱遥感影像煤火监测新方法
夏 清, 胡振琪*
中国矿业大学(北京), 北京 100083
煤火在世界各地均有不同程度的发生, 严重威胁生态环境, 煤火燃烧释放大量的有毒有害气体, 造成大气污染, 同时煤火燃烧形成地下空洞, 导致地表塌陷, 直接威胁着矿区人员的生命安全。 遥感技术的迅猛发展使大尺度反演与监测煤火温度变为可能。 单窗算法是一个简单可行且精度较高的煤火温度反演方法, 该方法需要两个大气参数进行温度反演, 即大气水分含量和地表比辐射率。 由于该算法需要卫星影像获取瞬间时的大气水分含量, 而卫星过境瞬间的大气水分含量受多种因素影响难以获得; 单窗算法对不同类型的地物均采用统一的地表比辐射率, 这会导致反演温度不精确, 误差较大。 针对上述存在的问题, 采用基于地面湿度参量建立起的大气可降水量与地面水汽压间的经验关系, 计算大气水分含量, 同时, 采用NDVI阈值法计算不同地物类型的地表比辐射率, 对单窗算法中的两个参数进行精确估计, 从而改进提高该算法的精度及可操作性。 将改进的算法应用于内蒙古乌达矿区, 反演从1988年到2015年间研究区的煤火温度, 提取每年研究区的温度异常区域, 对比分析煤火区域分布、 面积变化情况。 本文提出的改进算法能够快速、 高效的反演煤火温度, 对掌握煤火异常区域变化情况提供技术支持, 具有可操作性及现实意义。
多光谱; 热红外光谱; 单窗算法; NDVI阈值法
2015-11-05,
2016-04-12)
2015-11-05; accepted: 2016-04-12
National Natural Science Fund in China (41371502)
10.3964/j.issn.1000-0593(2016)08-2712-09
Biography: XIA Qing, (1987—), PhD, China University of Mining and Technology (Beijing) e-mail: xiaqingfriendxia@126.com *Corresponding author e-mail: huzq1963@163.com
猜你喜欢
中等数学(2022年5期)2022-08-29
中原商报·科教研究(2022年1期)2022-05-13
成都信息工程大学学报(2021年5期)2021-12-30
家庭影院技术(2021年8期)2021-11-02
学生天地(2020年18期)2020-08-25
中等数学(2020年2期)2020-08-24
特别健康(2018年9期)2018-09-26
河北书画研究(2016年2期)2016-08-24
信息记录材料(2016年4期)2016-03-11
高中生学习·高三版(2014年3期)2014-04-29