
Study on the Comparisons of the Establishment of Two Mathematical Modeling Methods for Soil Organic Matter Content Based on Spectral Reflectance
2016-06-15 16:39ZHANGPeiLIYi
光谱学与光谱分析 2016年3期
ZHANG Pei, LI Yi,2*
1. College of Water Resources and Architecture Engineering, Northwest A&F University, Yangling 712100, China
2. Water Saving Agriculture Academy in China Arid Zone, Northwest A&F University, Yangling 712100, China
Study on the Comparisons of the Establishment of Two Mathematical Modeling Methods for Soil Organic Matter Content Based on Spectral Reflectance
ZHANG Pei1, LI Yi1,2*
1. College of Water Resources and Architecture Engineering, Northwest A&F University, Yangling 712100, China
2. Water Saving Agriculture Academy in China Arid Zone, Northwest A&F University, Yangling 712100, China
Existing prediction models of soil organic matter content (SOC) are restricted by some factors, such as sampling scale, soil type and spectral parameters of samples. Therefore, it is necessary to make a comparative analysis on larger scales to build a quantitative model with better feasibility and greater accuracy. A total of 225 soil samples were collected in an extensive region of the upper reaches of Heihe river basin. SOC and spectral reflectance were being measured. All the samples were divided into 2 subsets-a modeling subset (180 samples) and a validation subset (45 samples). Six indices were obtained through transformation of soil spectral reflectance (R), continuum-removal (CR), reciprocal (REC), logarithm of reciprocal (LR), first-order differential (FDR) and Kubelka-Munck transformation coefficient (K-M). To build the mathematical model of SOC with 12 spectral indices, two methods, i.e., stepwise linear regression and partial least-square regression were used based on the modeling subset, respectively; the validation subset is used for model evaluation. The results indicated that: (1) Regardless of different modeling methods, model between SOC and LR index was always the best among the 6 reflectance-related indices. LR was the best index for predicting SOC; (2) For the model based on the LR index, the accuracy of model using partial least-square regression method was better than that using stepwise linear regression method; (3)225 samples were compared to verify the former available published SOC model. Both the predicted and measured values passed the mean value t-test, and the Pearson correlation coefficient reached 0.826. It shows that local prediction model can be applied to the research of predicting SOC in the larger scale.
Upper reaches of Heihe; Soil organic matter; Stepwise linear regression; Partial least square regression; Mathematic model; Spectral reflectance
Introduction
Soil nutrients play a significant role in the high efficient utilization of water and fertilizer. In which, soil organic matter content (SOC) reflects the fertility characters and the health degree of soil[1]. High accuracy can be achieved for determining SOC in laboratory test using the traditional methods, including complete wet-combustion method and potassium chromate volumetric method[2], etc. However, these methods are complex, in the meantime, the environment are easily to be polluted to some extent, and therefore they cannot be extended on large scales. With the development of quantitative remote sensing technology, many researches have been performed to obtain SOC values easily and rapidly in a large area. The utilization of the models for SOC based on spectral reflectance characteristics can reduce the workload of experimental analysis. And the application of this method to SOC estimation in a large area can provide references for agricultural production planning.
Several international achievements have been made in predicting SOC based on spectral reflectance. For instance, Palacios-Orueta et al. studied the influences of SOC, iron content and texture on spectral reflectance through multivariate analysis, principal component analysis, discriminant analysis and waveband depth analysis[3]and then provided reference spectral wavebands for the prediction model of SOC. According to the reference spectral wavebands mentioned above, Liu et al. established a spectral prediction model for SOC in the saline land in Beiwucha Town, Manasi County, Xinjiang, China using the stepwise linear regression method (SLR). Their results indicated that, SOC models which established by different indices would have different prediction accuracy[4]. Bilgili et al. constructed a spectral prediction model for SOC in the semi-arid area of northern Turkey using the multivariate adaptive regression splines and partial least-square regression (PLSR) method. Their results revealed that higher prediction accuracy of the model could be achieved by improving the modelling method[5]. Based on the measured SOC values, Zhang et al. established a prediction model by calculating the pixel brightness value of the remote sensing image of the Landsat/TM waveband image for Fuxin, Liaoning, China. They found that the model showed different adaptability influenced by research scale and soil type[6]. Shi et al. also constructed a prediction model for SOC based on the spectral data of 1581 soil samples from 14 provinces in China. Their results suggested that the accurate prediction of SOC was influenced by soil factors, and therefore, accurate trans-regional modelling couldn’t be realized[7]. Using the SLR method, Liu Jiao et al. proposed a spectral prediction model for SOC in typical farmlands and high mountain areas on the upper reaches of Heihe, Gansu, China[8]with high prediction accuracy, but the established model could not be applied large scale due to the limitation of sampling scale. A better modelling method can be proposed to further improve the model accuracy and provide a reliable way to predict SOC on large scales.
The prediction accuracy of a model, to a great extent, decides whether or not the model is reliable and practical. However, different modelling methods have different degrees of adaptability for different areas and scales, which brings difficulties for SOC modelling. Based on the measured SOC values and spectral reflectance, this research constructed spectral prediction models of SOC on the upper reaches of Heihe using the PLSR and the SLR methods. Through a comparison of the stability and prediction accuracy of the models obtained using the two methods, the best model for predicting SOC based on spectral reflectance was determined. Besides, by comparing the results in this research with previous achievements[7], in the case of expanding the sampling scale, the applicability of the previous model was validated. The result in this research is expected to provide more references for prediction of large-scale SOC based on spectral data.
1 Materials and methods
1.1 Soil sampling
The upper reaches of Heihe are geographically in the range of 37.7°—42.7°N and 97.1°—102.0°E. In this area, the annual average precipitation is 300~700 mm, and the elevation varies from 1,700 to 5,066 m, with significant vertical zones, including the landscapes of glacier, grassland, forest, river shoal and waste land[9]. Owing to the Heihe section of Qilian Mountains runs through the upper reaches of Heihe in northwest-southeast direction, rich variation information concerning soil properties is found along the way. Therefore, the samples were collected along the ridge line of Qilian Mountains from Yugur Autonomous County of Sunan to Shandan County, Gansu, China direction. The distance between adjacent sampling points was about 3 km. Additionally, sampling points were distributed more extensively in different landscape zones, including the Heihe valley of Qilian mountains, Biandukou in Minle County, the military horse-breeding farm in Shandan County, Dayekou in Zhangye City and Kangle grassland. Totally 225 samples were collected at 0~10 cm depth range. These samples were all dried in laboratory, ground and screened by a 2 mm-diameter siever.
1.2 Analysis of soil properties and classification of sample sets
The particle size distribution of soil was obtained using a laser diffraction particle size analyzer (Mastersizer 2000)[10]. According to the international classification standards for soil texture, among the 225 soil samples, there were 77 clay loam samples, 78 loam samples, 21 sandy loam samples, and 49 samples of sand, light clay, silt clay, silt clay loam and silt loam. The SOC of these samples was measured using potassium chromate volumetric method[2]. Afterwards, the SOC data of the 225 samples were ranked in an increasing order. Beginning with the third sample, 45 samples occupying 20% of the total were selected with an interval of 4 samples to make up the validation subset, and the rest 180 ones were taken as modelling subset, accounting for 80% of the total. The statistical properties of the total samples, the modelling and the validation subsets are listed in Table 1.
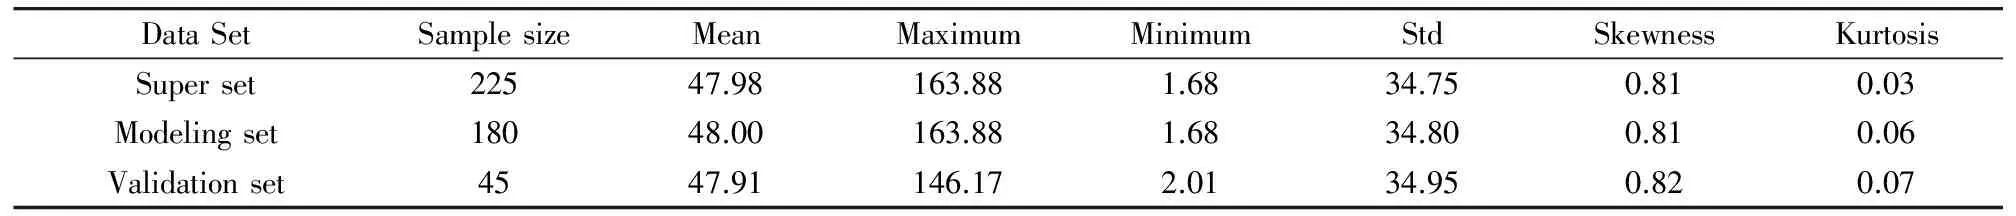
Table 1 Descriptive statistics of soil organic matter (Unit: g·kg-1)
Table 1 reveals that the statistical parameters of the modelling and validation sets are close to that of the total samples and can reliably reflect the SOC distribution properties of the total samples. Therefore, the classification of subsets is suitable for further modelling and validation analysis.
1.3 Acquisition and preprocessing of the spectral data of soil samples
The spectral experiment was conducted in the Key Lab of Agricultural Soil and Water Engineering in Arid and Semiarid Areas, Ministry of Education, Northwest A & F University, China. The tests were conducted during 10:30—14:30 in sunny days with sufficient sunshine and clear sight. The soil spectrum was measured using a portable hyper-spectrometer ASD FieldSpec (Analytical Spectral Devices). The waveband ranges from 350~1 830 nm, among which, two wavebands of 350~999 nm and 1 000~1 830 nm were sampled at intervals of 1.4 nm and 2 nm, respectively. Before measurement, the apparatus was preheated for half an hour to reduce the error. When the measurement started, considering the factors including variation of light intensity et al., dark current was removed and whiteboard was calibrated every 10 min. The soil samples were placed in the aluminium boxes with 5 cm in diameter and 4 cm in height. The spectrometer was equipped with a sensor probe with 30° of field angle and was vertically fixed at 5 cm above the center of the soil sample. The coverage area of the sensor probe was within the boundaries of the aluminium boxes. Each sample was measured for 10 times and then the arithmetic mean was calculated. Given the non-uniform preheating of the apparatus, the step was observed at some spectral curves at 1000 nm wavelength. Therefore, the short infrared wavebands of the curves were corrected using ViewSpec Pro Version 6.0 (ASD Inc.). Besides, because water absorption waveband, iron oxide, and OH-in kaolinite clay mineral exerted influences on the soil spectral reflectance at 1 400 nm around, the spectral reflectance curve fluctuated violently[11], such wavebands were excluded.
After transform processing of the observed original spectral reflectance (R), the following parameters were obtained: the reciprocal ofR(REC), the logarithm of REC (LR), the first-order differential ofR(FDR), the transform coefficient of Kubelka-Munck (KM)[12]and continuum removal (CR). Among which, REC, LR and FDR were determined with ViewSpec Pro Version 6.0; CR was obtained using the spectral analysis module of ENVI 4.7 (Exelis VIS Inc.); KM was calculated by the following
(1)WhereRis reflectance value corresponding to spectral wavelength.
1.4 Modelling and validation
A model for spectral reflectance of SOC was established using SLR and PLSR methods respectively. By evaluating the modelling effects of the two methods, the optimal model was obtained.
1.4.1 To establish models using the SLR and the PLSR methods

(2)Where the unit of SOC is g·kg-1;c0is a constant;cirefers to coefficient andi=1, 2, 3…,n;Xjdenotes the corresponding spectral parameter value of the sensitive wavelength of the model;jis wavelength;Nis number of the selected wavelengths.

(3)Wherenis sampling number; SOCOBSis measured SOC value(g·kg-1); SOCPREdenotes predicted SOC value (g·kg-1).
In model establishment process using SLR and PLSR methods, spectral waveband information for establishing models were both selected through a statistically strict regression process. Both the selected sensitive wavelengths and principal components were significantly correlated to the observed SOC values. The obtained models met the statistical requirement of reliability. And there are some statistical bases for the selection of sensitive wavelengths. Stepwise linear regression analysis process was realized using IBM SPSS 22.0 (IBM Inc.) while PLSR was achieved with the Unscrambler X 10.3 (CAMO Inc.).
1.4.2 Model evaluation

(4)
(5)
(6)
WhereSdis the standard deviation of the difference between the measured and predicted values;ndenotes sample size.
2 Results and analysis
2.1 The models and their validations using the SLR method
Based on the R data of the 180 soil samples from the modelling subset, the SLR models of SOC for different indices includingR, CR, REC, LR, FDR and KM were constructed. The model etstablishment results of SOC~Rwas taken as an example. The corresponding equations for the models and validated statistical parameters are listed in Table 2.

Likewise, by comparing the SOC models using the indices of CR, REC, LR, FDR and KM, the optimal models are determined, as shown in Table 3.

Table 2 Establishment and validation of SOC-R model using the SLR method

Table 3 The established SOC models using different spectral indices and the validation parameters using the SLR method
To compare the model establishment accuracy of the models with different indices using the SLR method, the predicted SOC values were compared with the measured values. The results are illustrated in Figure 1.

Fig.1 Chart of predictive effects of various models using the SLR method
Figure 1 shows that, the scatter diagram of the SOC~LR model is closest to the 1∶1 line, with the maximal slope (0.937 7) and greaterR2(0.583 9). There is little error between the measured and estimated values. The SOC~LR model exhibits the best prediction effect, which is consistent with the results in Table 3.
2.2 The models and their validations using the PLSR method
Similarly, the PLSR models of SOC for multiple spectral indices, consisting ofR, CR, REC, LR, FDR and KM were established. To simplify the models, the maximum number of extracted principal component is 10. Taking the model for SOC~Ras an example, the corresponding modelling and validation parameters are presented in Table 4.

Table 4 Establishment and validation of SOC-R
Table 4 indicates that, with the increase in the number of the principal components, the explanation effects in SOC~Rmodel are better. In the case of 10 principal components, both theRC(0.877) and the accumulative contribution rate (76.89%) are largest and the RMSECV (16.68) is the smallest. Although the increase of principal components improves the stability of the models, the over-fitting might appear to reduce their prediction accuracy[15]. Therefore, to determine the best SOC model, the validation effects of these models need to be compared further. When 7 principal components are selected, minimal values ofrp(0.864) and RMSEP (17.78) are achieved; besides, the model passes theTtest of mean values for the measured and fitted values at the significant level of 0.05. Thus, the 7-principal-component model was selected as the best SOC~Rmodel.
Likewise, the best models using other 6 spectral indices were selected, shown in Table 5.
In Table 5, the SOC model using the index LR shows the largestRC(0.881), the largest accumulative contribution rate (77.6%), and the smallest RMSECV(16.63), the explanation effects of fitting the data from modelling subset is the best. The validation results indicate that the SOC~LR model had the largestrp(0.869) and the smallest RMSEP (17.23). The model passes thettest of mean values for the measured and fitted values at the significant level of 0.05. Therefore, the model of SOC~LR is the best when using the PLSR method.
Table 5 The established SOC models using different spectral indices and the validation parameters using the PLSR method

SpectralindexModelestablishmentValidationPC⁃NumberRCCumulative/%RMSECVrpRMSEP|t|R70.85873.6217.820.86417.780.267CR60.84471.2818.590.85618.380.372REC60.87476.3016.890.84418.630.156LR70.88177.6016.630.86917.230.117FDR20.85072.2718.270.79021.520.546K⁃M60.87376.1716.940.84018.870.13
To contrast the prediction effects SOC models with various indices using the PLSR method, the predicted SOC were compared with the measured values. The results are shown in Figure 2.
Figure 2 demonstrates that, the scatter plot of the SOC~FDR model is the closest to the 1∶1 line among all plots, with a slope of 0.927 6, but had the smallestR2(0.435 3) and larger prediction error, thus the model was not good. All of the other 5 scatter diagrams are close to the 1∶1 line, of which, theR2(0.658 6) of the SOC~LR model is the largest, and its prediction effect is the most effective. Hence, the model for SOC~LR is the best when using the PLSR method.
For both the SLR and PLSR method, LR is the best predictor. By comparing Figures 1 d and 2 d which illustrate the models for SOC~LR using the two methods, the slope (0.937 7) of the model for SOC~LR based on the SLR method is close to 1, which is larger than slope (0.91) of the model for SOC~LR based on the PLSR method; thus, the model based on the SLR method is better in prediction effects. However, theR2(0.658 6) of the PLSR-based model for SOC~LR is larger. Therefore, the validation effects of the two models are similar. The validation parameters in Tables 3 and 5 suggest that the RMSEP (17.23) andrp(0.869) in the model using the PLSR method are obviously superior to the corresponding parameters in the model using the SLR method. Thus, the SOC~LR model based on the PLSR method is more accurate than the SOC~LR model based on the SLR method.
2.3 Discussions
Liu Jiao et al. established different models for predicting SOC at the small sampling scale on the upper reaches of Heihe based on measured R and the derived variables, among which
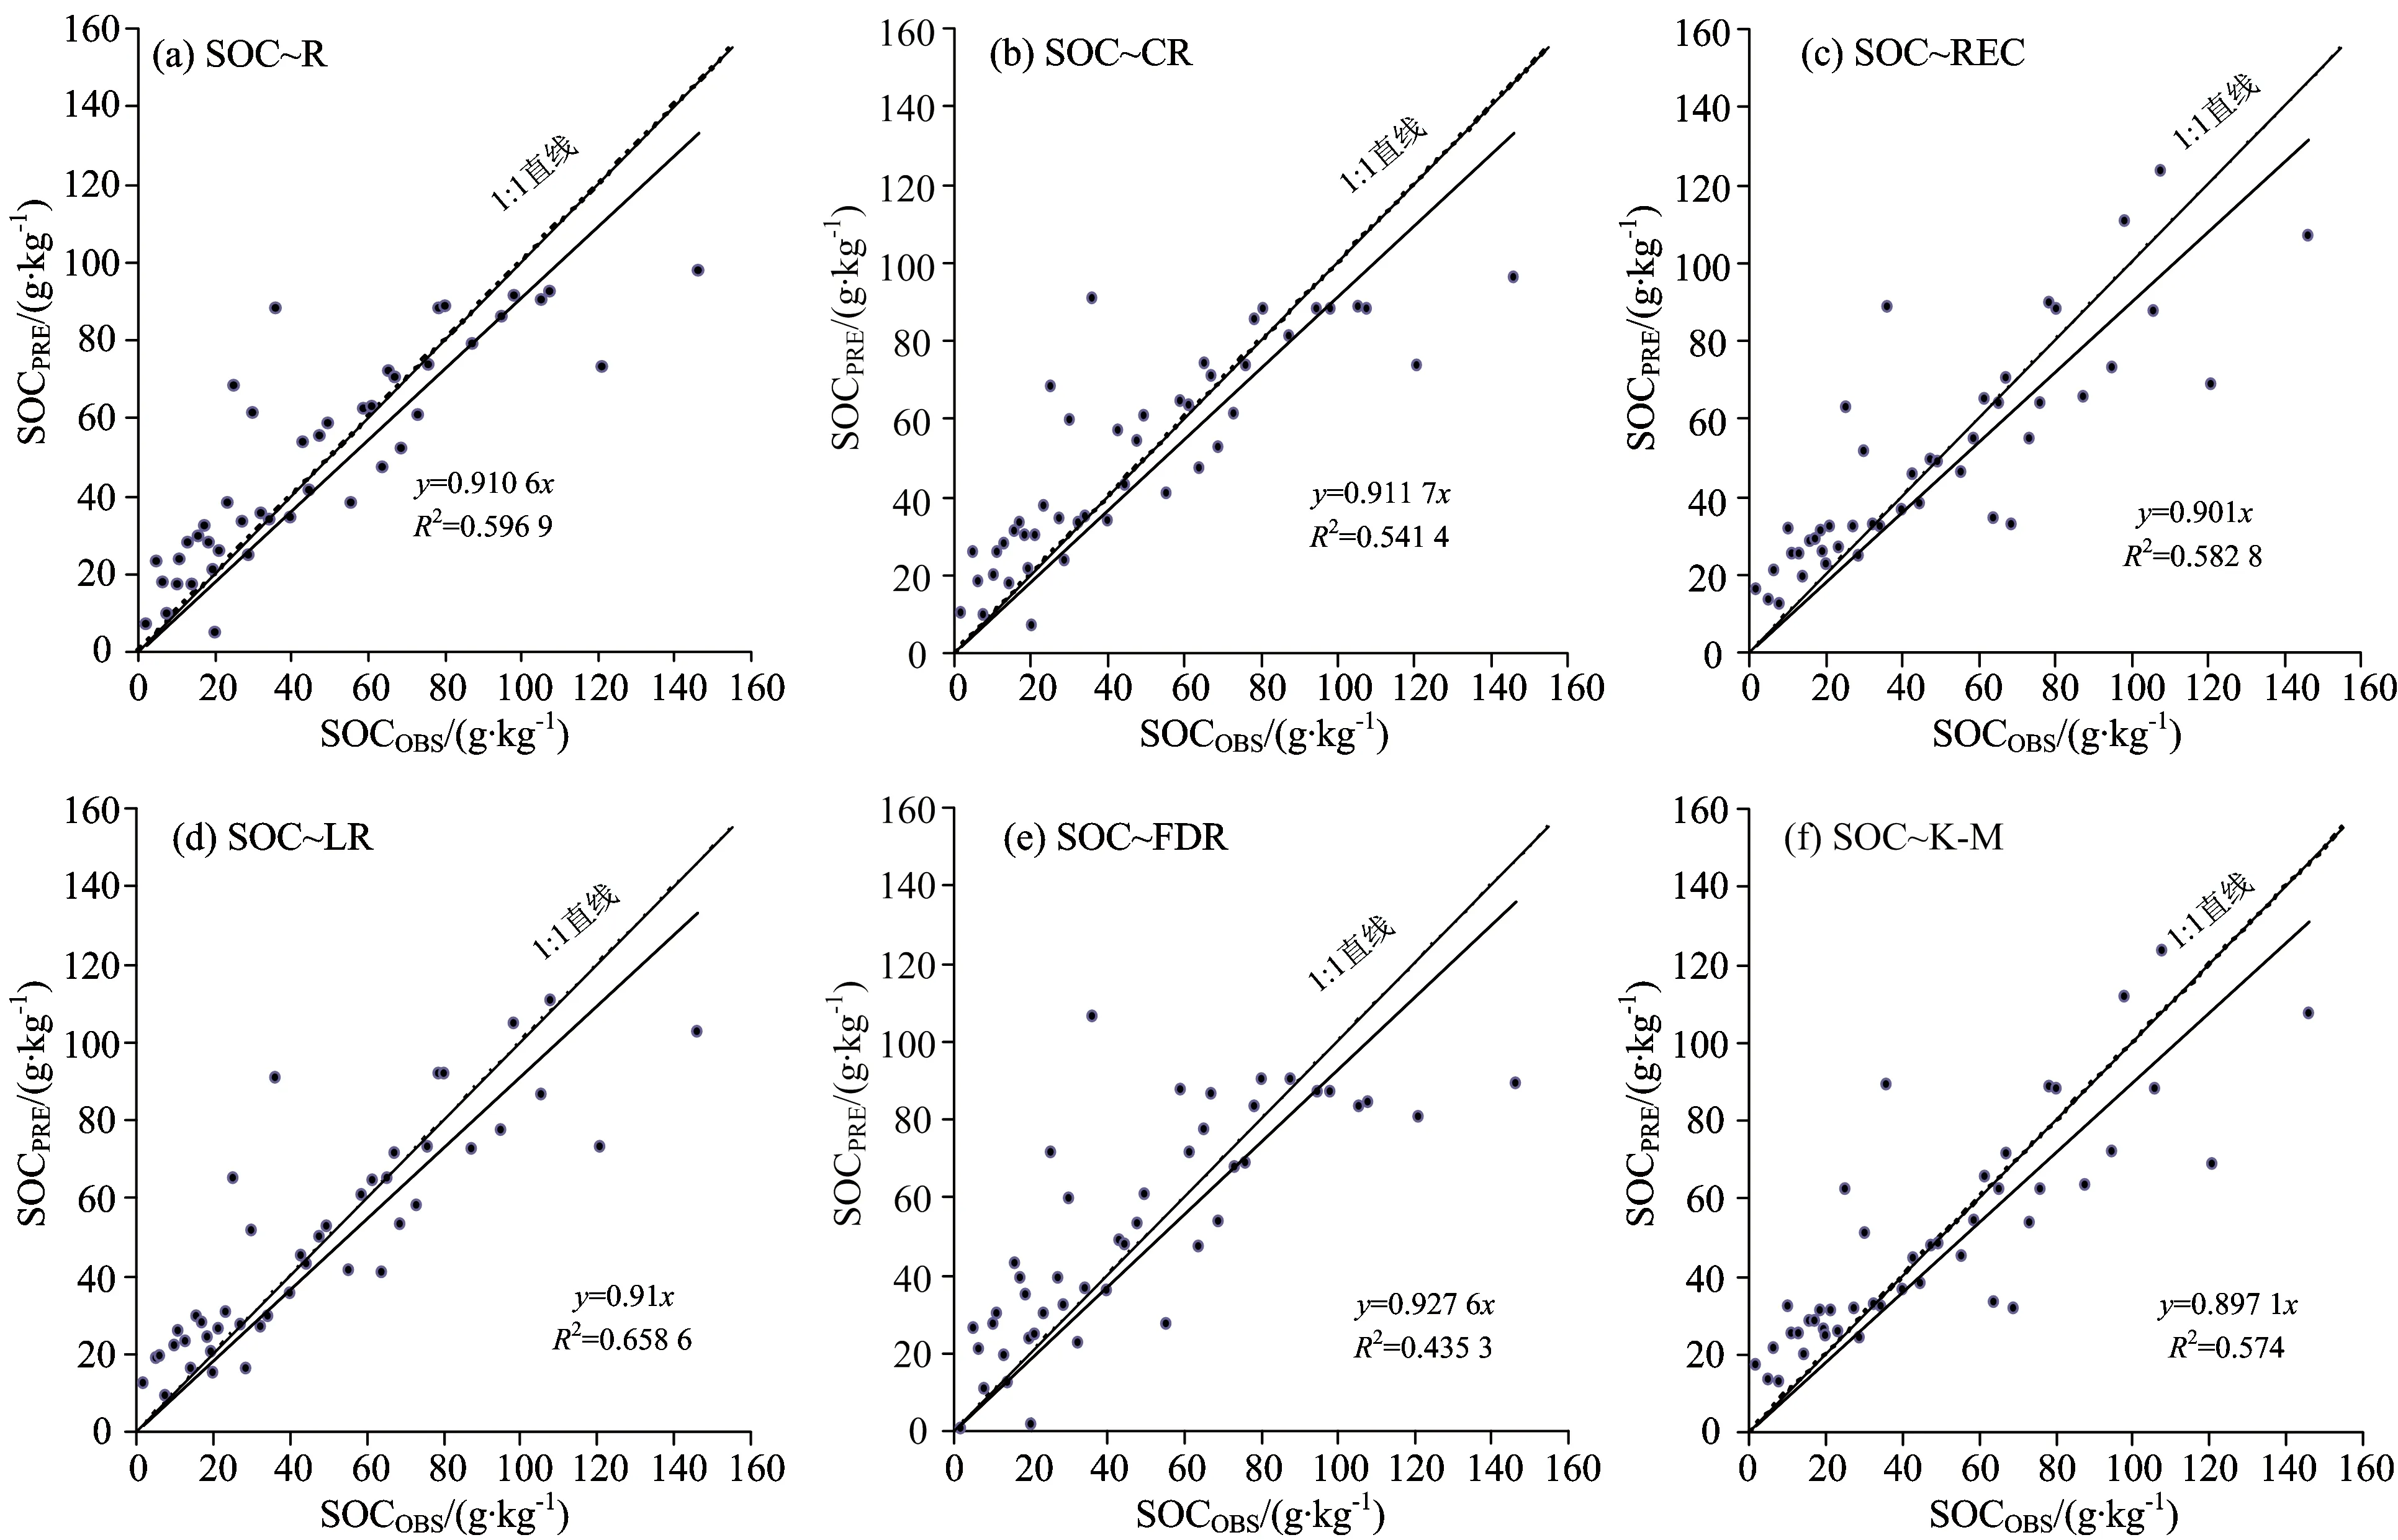
Fig.2 Chart of predictive effects of various models using the PLSR method
the best model is the SOC~Rmodel[8], and expressed as
SOC=-189.3R1 632-740.3R836+615.9R1 326+314.3R474
(7)
By using their model, the SOC values of the 225 soil samples in this study were validated. By comparing with the observed values, thervalue of the measured and predicted SOC values is 0.826, the RMSEP is 20.24, and the model passes T test of mean value. It implies that the SOC model which had been established in local area can be applied to larger scaled to predict SOC. However, the extended scale of SOC model obtained at a small scale and its prediction accuracy for upscaling needs to be further explored because there is the influence of spatial variability in soil properties.
Sun Yongmeng pointed out that, when the studied scale is large, and there is strong spatial variability, RMSEP increased accordingly, so the models established at different scales should not be compared directly[16]. Although the value of RMSEP of the empirical model proposed by Liu Jiao et al. is relatively large, the model shows strong prediction within certain accuracy range. Thus, their model can be employed for predicting SOC on the upper reaches of Heihe.
With the diversity of the methods, it is necessary to explore more effective modelling methods so as to achieve more accurate prediction and more comprehensive information concerning the distribution of SOC. This research established the best model for predicting SOC using the SLR and PLSR methods at a larger sampling scale. The obtained models in this research are more effective than the existing models[8]both in stability or prediction accuracy. Particularly, the SOC model based on PLSR method shows superior parameters, i.e., larger RMSEP (17.23) andrp(0.869) than those of existing empirical models and is more suitable for predicting SOC on the upper reaches of Heihe.
3 Conclusion
According to six spectral-related indices, the SOC models on the upper reaches of Heihe using the two methods of SLR and PLSR were established. By comparing the related parameters during model establishment and validation processes, among the established SOC models using the six spectral-related indices, The two models using the index LR for both the PLSR and SLR methods were very effective for predicting SOC on the upper reaches of Heihe. Furthermore, the SOC~LR model obtained by the PLSR method was more accurate than the model obtained by the SLR method. Therefore, SOC~LR model obtained with the PLSR method is selected as the best model among several established models and it is suitable for predicting SOC on the upper reaches of Heihe.
[1] Wang H J, Shi X Z, Yu D S, et al. Ecology and Environmental Sciences, 2010, 19: 197.
[2] Bao S D. Soil and Agricultural Chemistry Analysis. Beijing: China Agriculture Press, 2000. 27.
[3] Palacios-Orueta A, Ustin S L. Remote Sensing of Environment, 1988, 65(2): 170.
[4] Liu S B, Li Y, He C S. Soil Science, 2013, 178(3): 138.
[5] Zhang F S, Qu W, Yin G H, et al. Chinese Journal of Applied Ecology, 2010, 21(4): 883.
[6] Zhou S, Wang Q L, Peng J, et al. Earth Sciences, 2014, 57(7):1671.
[7] Bilgili A V, van Es H M, Akbas F, et al. Journal of Arid Environments, 2010, 74: 229.
[8] Liu J, Li Y, Liu S B. Spectrosc. Spectr. Anal., 2012, 33(12): 3354.
[9] Qin J, Ding Y J, Wu J K, et al. Journal of Arid Land, 2013, 5(3): 366.
[10] Peng H T. Horton R, Lei T W, et al. Journal of Soils and Sediments, 2015, 15: 937.
[11] Ge Y F, Morgan C L S, Grunwald S, et al. Geoderma, 2011, 161: 202.
[12] Feng Y Z, Sun D W. Talanta, 2013, 105: 244.
[13] Li Y, Liu S B, Liao Z H, et al. Canadian Journal of Soil Science, 2012, 92(6): 845.
[14] Mark J, Michael A. The Appraisal Journal, 2001. 89.
[15] Li L N, Li Q B, Yan H L, et al. Spectrosc. Spectr. Anal., 2010, 30(11): 3041.
[16] Sun Yongmeng, Ding Jianli, Qu Juan, et al. Transactions of the Chinese Society of Agricultural Engineering, 2012, 28(20): 180.
*通讯联系人
S123
A
基于光谱反射率的两种土壤有机质数学建模方法对比
张 沛1, 李 毅1,2*
1. 西北农林科技大学水利与建筑工程学院, 陕西 杨凌 712100
2. 西北农林科技大学中国旱区节水农业研究院, 陕西 杨凌 712100
已有土壤有机质的光谱预测模型其适用性受建模样本的采样尺度、 土壤类型及光谱参数限制, 需要在大尺度及范围上进一步检验适用性, 并比较分析不同建模方法的建模效果以寻求适用性更好、 精度更高的定量模型。 在黑河上游大尺度范围采得225个土壤样品, 进行了土壤有机质(SOC)及光谱反射率测定后将样本划分为建模集(180个土样)与验证集(45个土样)。 将土壤光谱反射率(R)变换处理后得到连续统去除(CR)、 倒数(REC)、 倒数之对数(LR)、 一阶微分(FDR)及Kubelka-Munck变换系数共6种指标, 针对建模集分别采用逐步线性回归与偏最小二乘回归方法建立12种光谱指标与SOC的数学模型, 并采用验证集进行模型预测效果评价。 结果表明: (1)采用逐步线性回归或偏最小二乘回归方法建模, LR指标对SOC变化的解释效果都是最好, 是SOC的最优预测因子。 (2)基于LR指标建立的SOC模型中, 采用偏最小二乘回归模型比逐步线性回归模型的预测精度更好, 相较于黑河上游已有的经验模型, 偏最小二乘回归法建立的模型的预测效果也更好。 (3)采用本实验的225个土壤样品对比验证了黑河上游仅有的SOC模型。 该模型的SOC预测值与实测值通过了均值T检验且Pearson相关系数达0.826, 表明在局部典型区域建立的SOC预测模型, 可以应用到更大尺度上的土壤有机质预测研究。
黑河上游; 逐步线性回归; 偏最小二乘回归; 有机质预测模型; 光谱
2014-12-13,
2015-04-18)
2014-12-13; accepted: 2015-04-18
National Natural Science Foundation of China (No. 51579213), the National High Technology Research and Development Program of China (No. SS2013AA100904), the China 111 Project (No. B12007), and China Scholarship Council for Studying Abroad (201506305014)
10.3964/j.issn.1000-0593(2016)03-0903-08
Biography: ZHANG Pei,(1990-),Master Degree in College Water Resources and Architecture Engineering, Northwest A&F University e-mail: zpr0803@163.com *Corresponding author e-mail: liyikitty@126.com
猜你喜欢
印制电路信息(2022年11期)2022-11-30
海洋通报(2022年4期)2022-10-10
光谱学与光谱分析(2022年4期)2022-04-06
家庭影院技术(2021年2期)2021-03-29
建材发展导向(2019年10期)2019-08-24
文学港(2019年5期)2019-05-24
淄博师专论丛(2019年1期)2019-04-04
汽车文摘(2018年2期)2018-11-27
甘肃林业(2016年2期)2016-11-07
铁道通信信号(2016年1期)2016-06-01
- 光谱学与光谱分析的其它文章
- 基于SVM与RF的苹果树冠LAI高光谱估测
- 基于非均匀B样条的拉曼光谱基线校正算法
- 不同硬实率紫花苜蓿种子的近红外光谱分析
- 衰减全反射红外光谱法快速检测沥青性质的研究
- Vibrational Spectroscopic Study of N-[4-[1-Hydroxy-2-[(1-Methyl Ethyl) Amino] Ethyl] Phenyl] Methane Sulfonamide
- A Relative Humidity Pulse Approach to Observe Mass Transfer Processes Controlled by Bulk and Surface for Aerosols