
未来百年夏季青藏高原臭氧变化趋势及可能机制
2016-06-22 02:51苏昱丞郭栋郭胜利施春华刘仁强刘煜宋刘明徐建军
大气科学学报 2016年3期
苏昱丞,郭栋,郭胜利**,施春华,刘仁强,刘煜,宋刘明,徐建军
① 南京信息工程大学 气象灾害教育部重点实验室/气候与环境变化国际合作联合实验室/气象灾害预报预警与评估协同创新中心,江苏 南京 210044;② 空间天气研究所,江苏 南京 210044;③ 中国气象科学研究院,北京 100081;④ 浙江省嘉兴市气象局,浙江 嘉兴 314050
未来百年夏季青藏高原臭氧变化趋势及可能机制
苏昱丞①②,郭栋①*,郭胜利①②**,施春华①,刘仁强①,刘煜③,宋刘明④,徐建军①
① 南京信息工程大学 气象灾害教育部重点实验室/气候与环境变化国际合作联合实验室/气象灾害预报预警与评估协同创新中心,江苏 南京 210044;② 空间天气研究所,江苏 南京 210044;③ 中国气象科学研究院,北京 100081;④ 浙江省嘉兴市气象局,浙江 嘉兴 314050
2014-09-25收稿,2014-12-05接受
国家重点基础研究发展计划(973计划)项目(2010CB428605);国家自然科学基金资助项目(41305039;91537213;41375047;41375092;41475140;41575057;41205065);江苏省高校自然科学研究计划项目(13KJB170009);江苏高校优势学科建设工程项目(PAPD)
摘要利用全大气气候通用模式(WACCM3)对政府间气候变化专门委员会排放情景特别报告中2001年到2099年A1B、A2、B1三种排放情景进行了模拟,分析了三种排放情景下青藏高原地区未来百年臭氧总量在夏季(6—8月)的变化趋势及引起该变化的可能机制。结果表明:在三种排放情景下未来百年夏季高原区臭氧总量均呈现增长趋势,其中A2情景下臭氧增长最快,B1情景下增长最慢,但相对于同纬度其他地区,高原区的臭氧总量增长较慢,即高原区臭氧谷加深。高原区高空污染物的减少以及局域Hadley环流的减弱是未来高原区臭氧总量增加的原因;而南亚高压的增强,以及与之相对应的辐散增强则可能是高原区臭氧谷继续加深的原因。
关键词
臭氧
青藏高原
未来百年
趋势
机制
平流层臭氧可以通过对太阳紫外辐射的吸收直接影响地球系统及气候变化,因此臭氧研究一直是气候变化研究的热点(IPCC,2007)。近期,极区臭氧洞的气候效应研究成为了国际热点(Hartmann et al.,2000;Pienitz and Vincent,2000;Ungar,2000;Perlwitz et al.,2008)。
除了极区的臭氧洞外,青藏高原夏季也存在臭氧的低值区,该臭氧低值区也可能对局地气候产生显著的影响。周秀骥等(1995)通过对TOMS卫星资料分析,发现青藏高原上空夏季会形成一个臭氧总量低值区,称为臭氧谷。Guo et al.(2015)分析了MLS卫星资料,发现臭氧谷存在双心结构,较强的中心位于对流层顶附件,较弱的中心位于上平流层。周秀骥等(1995)推测与夏季高原上空上升运动相关的动力和化学作用可能是其形成的原因。卞建春等(1997)和郭栋等(2012)分析了大尺度环流对该臭氧谷的作用。Liu et al.(2003)、Tian and Lu(2009)和Guo et al.(2012)利用三维化学气候模式模拟了该现象,认为高原臭氧谷形成过程中动力过程起主要作用,化学过程较弱。Guo et al.(2015)将MLS资料中白天和黑夜的青藏高原臭氧谷做了比较。白天和夜晚,UTLS区的臭氧谷都存在,没有显著差别。然而,在平流层上层,白天的臭氧谷存在,而夜晚的臭氧谷消失了。因此,光化学反应可能对夏季上平流层青藏高原臭氧谷有重要作用。而且10 hPa的HCl和ClO浓度的纬向偏差在青藏高原和其邻近地区存在明显的高值区,因此氯对臭氧的催化损耗可能在夏季青藏高原臭氧谷的上平流层中心的形成中起到重要作用。后来,Zhou and Zhang(2005)研究了近20 a来高原区平流层温度降低、对流层温度升高可能导致了臭氧总量的持续减少。刘煜和李维亮(2001)利用二维化学模式得到青藏高原臭氧总量在1993年达到谷值,并且于1995年开始恢复,但在2050年时也未达到1980年时的水准。郭世昌等(2008)研究了北半球Hadley环流指数与东亚臭氧的关系,发现他们存在显著的共振周期,并且由后向轨迹模式得出高原区对流层Hadley环流的水平平流可以使得高原区臭氧浓度减少。Zhang et al.(2014)研究了青藏高原区气候变暖导致冬季臭氧减少的趋势及可能原因。
尽管,已经有一些学者对青藏高原臭氧的变化及其机制进行了探讨。然而,在节能减排的背景下,未来高原臭氧的变化特征及可能机制的研究仍须被重视。类似研究可能对未来国家相关政策的制定提供理论支持。
1模式与方法
政府间气候变化专门委员会排放情景特别报告(SRES)中给出了强迫因子各异的6种排放情景,本文只使用其中的A1B(各种能源平衡发展的、经济高速增长的未来社会)、A2(多元化发展的未来社会)以及B1(趋同发展的未来世界)三种排放情景作为外强迫因子(IPCC,2007)。
WACCM(Whole Atmosphere Community Climate Model)是美国大气研究中心基于CAM(Community Atmosphere Model)合作发展的大气化学气候模式,其垂直范围由地面延伸至大气热层低层。本文使用的模式版本WACCM3包括了CAM3模式的所有物理参数化方案,只改变了重力波拖曳和垂直扩散的参数化方案。此外,WACCM3有所改进:包含详细的中层大气中性化学过程,考虑了化学反应导致的加热,极端紫外波长的短波加热参数化,非局地热力学平衡条件下的红外迁移。由于化学交互反应的重要性,WACCM3模式的动力核心只使用有限元法。这种方法明确计算了一个给定空间内进入和流出的物质通量,从而保证了物质守恒。
WACCM3垂直分层66层,范围由地面至4.5×10⁻⁶hPa(约145 km)。与CAM3模式一样,WACCM3在100 hPa以下使用的是地形跟随坐标系,而在100 hPa以上则使用等压坐标系。垂直分辨率随高度变化,在65 km高度以上为3.5 km,平流层顶附近(50 km)为1.75 km,低于30 km的低平流层区域为1.1~1.4 km;在对流层的分辨率为1.1 km,但是在接近地面的区域,例如行星边界层,有更高的垂直分辨率。模式分辨率使用的是1.9°×2.5°(纬度×经度)。
Hadley环流使用经向风的无辐散部分,即V=Vψ+Vχ中的Vψ的质量流函数来进行表示。这里使用王盘兴(1994)从环流定常假设出发,提出的新的计算双向(向上、向下)叠加的计算方法来计算Hadley环流的强度。
南亚高压(SAH,South Asian High)使用陈延聪等(2009)定义的强度指数表征。SAH的强度p定义为将100 hPa位势高度上搜索范围内H≥1 680 dagpm的格点减去1 680的平均值。
2未来百年夏季青藏高原臭氧变化趋势及可能机制
2.1臭氧总量的变化趋势及可能机制
如图1a所示,WACCM3模式输出资料中,A1B、A2和B1三种排放情景下,全球2001—2099年来的全球臭氧总量均呈增长趋势,即臭氧恢复,且A2情景下柱总量增长最快,B1情景下增长最慢。线性回归系数分别为A2(0.38)、A1B(0.28)和B1(0.19),且都通过了0.05信度的显著性检验。三种情境下,青藏高原区(75~105°E,26~38°N)的臭氧总量的变化与全球臭氧类似,基本上是臭氧恢复(图1b),但是其恢复的速度较全球的慢。
全球臭氧恢复的主要原因是人类氟氯化碳排放的减少(Perlwitz et al.,2008;Son et al.,2008;Polvani et al.,2011)。而高原区臭氧总量的恢复,要从化学和动力两个方面考虑。对于化学方面,如图2所示,夏季青藏高原区上空,氯的总含量以及70 hPa(即臭氧低值中心处)的氯浓度,在未来百年均有下降趋势。高原区氯的总含量在A1B、A2、B1三种情景下线性回归系数分别为-0.018、-0.020和-0.017,均通过了0.05信度的显著性检验。夏季青藏高原区上空,2090—2099年与2001—2010年氯的总含量之差为-1.75×10⁻¹⁰kg,夏季青藏高原区上空70 hPa,2090—2099年与2001—2010年氯浓度之差约为-1.5×10⁻¹⁵mol·mol-1,整个北半球均通过了0.05信度的显著性检验。因此,化学方面与臭氧的全球性恢复类似,未来百年内的节能减排是高原区臭氧恢复的原因之一。

图1 2001—2099年夏季A1B、A2、B1三种排放情景下全球平均臭氧总量变化(a)和青藏高原区(75~105°E,26~38°N)平均臭氧总量变化(b)(单位:DU;细线为臭氧柱总量;粗线为变化趋势线)Fig.1 The (a)global average total ozone and (b)average total ozone over the Tibetan Plateau(26—38°N,75—105°E) under three emissions scenarios(A1B,A2,B1) in summer 2001—2099(units:DU;thin lines are total ozone;thick lines are trend lines)

图2 A1B情景下高原区夏季氯总量(a;单位:10-10 kg;灰色阴影为青藏高原)、70 hPa等压面上2090—2099年与2001—2010氯质量之差(b;单位:10-15 mol·mol-1),以及2001—2099年夏季A1B、A2、B1三种排放情景下青藏高原区氯质量变化(c;单位:10-10 kg;细线为氯实际质量;粗线为变化趋势线)Fig.2 (a)The Cl mass difference in summer between 2090—2099 and 2001—2010 under the A1B emissions scenario(units:10-10 kg)(statistically significant at the 95% confidence level in the whole of the Northern Hemisphere;shaded area indicates the Tibetan Plateau;(b)As in (a) but for the Cl concentration at 70 hPa(units:10-15 mol·mol-1);(c)Cl mass of chlorine over the Tibetan Plateau under the A1B emissions scenario in summer 2001—2099,thin lines indicate Cl mass;thick lines are trend lines)
动力方面主要与高原区特殊环流形势的变化有关。近期许多工作表明(Liu et al.,2003;Tian and Lu,2009;Bian et al.,2011;郭栋等,2012),夏季高原上空存在的大尺度上升运动与高原区臭氧低值有密切联系。一方面,上升运动可以将部分污染物输送至平流层,从而消耗臭氧。另一方面,上升运动可以将对流层低臭氧浓度的空气输送到平流层低层,并在对流层顶附近向高原外辐散,导致高原区臭氧总量的减少。如图3所示,对于2001—2099年的平均情况,夏季高原上空也存在较强的上升运动,能达到100~70 hPa。相对应的,高原区上空70 hPa附近也存在臭氧纬向偏差的负值中心,即臭氧低值中心。因此,未来百年夏季高原区上空,上升气流的强度变化必然导致该地区臭氧总量的变化。

图3 A1B情景下2001—2099年夏季青藏高原区(75~105°E)平均的经圈环流(a;箭矢,垂直速度放大了100倍;等值线为垂直风速,单位:102 Pa·s-1)和臭氧平均浓度(b;等值线为臭氧纬向偏差;单位:108mol·mol-1)(黑色阴影为地形)Fig.3 (a)Vectors indicate the 2001—2099 mean 75—105°E mean meridional circulation(vertical wind speed is multiplied by 100) under the A1B scenario in summer,contours indicate vertical wind speed(units:102 Pa·s-1);(b)2001—2099 mean 75—105°E mean concentration of ozone under the A1B scenario in summer(units:108 mol·mol-1)(shading indicates the terrain)
高原区的上空在未来百年始终保持上升运动,而高原区2090—2099年与2001—2010年垂直速度的差为正,如图4a所示。说明在2090—2099年间上升运动的强度要弱于2001—2010年间的强度,即未来百年高原上空的上升运动减弱。根据局域Hadley环流质量流函数的定义,上升气流的强度可以由速度的质量流函数判定。通过WACCM3模式输出的纬向风V,可由叠加法(王盘兴,1994)算出高原地区局域Hadley环流的质量流函数。并参照全域Hadley环流的上升支的强度定义,定义高原区上升支南北两边距离最近的高低值中心值的差为高原Hadley环流上升支的强度,即可得到三种排放情景下,未来100 a青藏高原夏季局域Hadley环流的上升支的强度变化趋势(图4b)。对上升支的强度做一元线性回归。三种排放情景下,回归系数分别为-0.018 4、-0.016 4、-0.003 86,上升支的强度均呈现减弱趋势,且A1B、A2情景下都通过了0.1信度的显著性检验。即高原区上升运动减弱,也是未来百年内高原区臭氧总量增加的原因之一。

图4 A1B情景下夏季青藏高原区(75~105°E)平均的2090—2099年与2001—2010年间垂直速度之差(单位:102 Pa·s-1)(a),以及2001—2099年A1B、A2、B1三种排放情景下夏季青藏高原的局域Hadley环流强度变化(b;单位:1;粗线为趋势线)Fig.4 (a)The difference of 75—105°E mean vertical velocity in summer between 2090—2099 and 2001—2010 under the A1B emissions scenario(units:102 Pa·s-1)(shading indicates the terrain);(b)Thin lines indicate the variation of local Hadley Circulation intensity over the Tibetan Plateau under three emissions scenario(A1B,A2,B1) in summer 2001—2099,thick lines are trend lines(units:1)]

图5 A1B情景下夏季青藏高原区(75~105°E)臭氧浓度纬向偏差(a;单位:10-8mol·mol-1;灰色阴影表示通过0.05信度的显著性检验;黑色阴影为地形)和70 hPa上臭氧浓度纬向偏差(b;单位:10-8mol·mol -1;灰色阴影表示通过0.05信度的显著性检验;白色线为高原轮廓)(2090—2099年与2001—2010年的差值)Fig.5 (a)Difference of 75—105°E mean ozone concentration zonal deviation (units:10-8 mol·mol-1)in summer between the 2090—2099 mean and 2001—2010 mean under the A1B emissions scenario(statistically significant differences at the 95% level are shaded gray,;the Tibetan Plateau is shaded black);(b)Difference of ozone concentration zonal deviation(units:10-8 mol·mol-1)in summer between the 2090—2099 mean and 2001—2010 mean at 70 hPa under the A1B emissions scenario(statistically significant differences at the 95% level are shaded gray;white outline indicates the Tibetan Plateau)
2.2臭氧谷的变化趋势及可能机制
由于三种情景结果类似,下面详述A1B情景的结果。由图1a可得,未来百年内全球臭氧柱总量约增加约25 DU(A1B情景),而高原区(图1b)只有约8 DU(A1B情景)。高原区臭氧相对全球背景下增长较为缓慢,即高原臭氧谷在未来百年内存在加深趋势。为了更具体地看到高原区的臭氧变化趋势,将2090—2099年平均和2001—2010年平均的臭氧做了差值(图5)。对全球臭氧求纬向偏差,并把高原区(75~105°E)范围的均值作为高原区平均做剖面(图5a)分析。可以得出,2090—2099年高原区上空30~100 hPa臭氧浓度纬向偏差比2001—2010年的低了5×10⁻⁸mol·mol-1,且通过了0.05信度的显著性检验。由于70 hPa是高原臭氧低值的中心(图3b),因此未来百年该中心会加深并向上偏移。由2090—2099年和2001—2010年70 hPa的臭氧纬向偏差(图5b),可以明显看到,未来百年高原臭氧谷有显著的加深趋势。
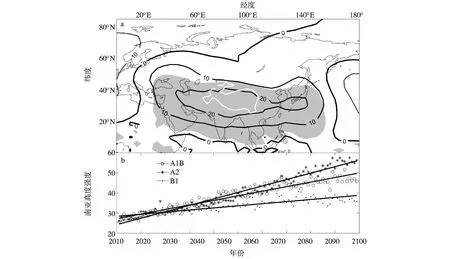
图6 A1B情景下夏季青藏高原区70 hPa上位势高度纬向偏差(a;单位:gpm;2090—2099年与2001—2010年的差值;白色线为高原轮廓;灰色阴影通过0.05信度的显著性检验),以及2001—2099年夏季A1B、A2、B1三种排放情景下南亚高压强度变化(b;单位:1;粗线为变化趋势线)Fig.6 (a)The difference of the zonal deviation of geopotential height in summer between 2090—2099 and 2001—2010 at 70 hPa under the A1B emissions scenario(units:gpm)(white outline indicates the Tibetan Plateau,values in the gray shaded area are statistically significant at the 95% level);(b)Thin lines indicate variation in the intensity of the South Asian high under the A1B emissions scenario in summer 2001—2099,thick lines are trend lines(units:1)
利用模式输出的位势高度资料,同样以A1B情景为例,对70 hPa的位势高度求纬向偏差,使用同样的方法对高原区70 hPa的高度场进行了分析(图6a)。可以看出在70 hPa高原区与周边的位势高度纬向偏差增加了20 gpm,高压增强。为了清晰地显示这百年内高压的变化,使用陈延聪等(2009)定义的南亚高压强度对未来百年高原区的高压参数化,并作其时序(图6b)。A1B、A2和B1的回归系数分别为0.23、0.32、0.10,且都通过了0.05信度的显著性检验。可以看出南亚高压的强度在未来呈增强趋势。
然后通过70 hPa等压面上的水平速度计算其散度(图7)。图7a为未来百年夏季70 hPa等压面上水平速度的平均散度,可以看出高原上气流辐散。图7b为2090—2099年平均散度与2001—2010年平均散度之差,其显示了高原区辐散增强。因此使得臭氧通量幅散增强,高原区臭氧谷加深,即高原区臭氧恢复速度比同纬度其他地区要慢。

图7 A1B情景下夏季青藏高原区70 hPa上2001—2099年平均水平散度(a;单位:10-6s-1;阴影表示青藏高原),以及平均水平散度之差(b;单位:10-6s-1;2090—2099年与2001—2010年的差值;阴影表示通过0.05信度的显著性检验的区域;灰线表示青藏高原)Fig.7 (a)2001—2099 mean horizontal divergence at 70 hPa under the A1B emissions scenario(units:10-6 s-1)(shading indicates the Tibetan Plateau);(b)Difference of horizontal divergence in summer between the 2090—2099 mean and 2001—2010 mean at 70 hPa under the A1B emissions scenario(units:10-6 s-1)(values in the shaded area are statistically significant at the 95% level;gray outline indicates the Tibetan Plateau)
3结果与讨论
本文以SRES中给出的A1B(中排)、A2(高排)、B1(低排)三种未来排放情景作为外强迫因子,使用WACCM3模拟了未来百年青藏高原区臭氧变化。结果表明:
1)未来百年夏季高原区臭氧总量呈现增长趋势,但相对于同纬度其他地区增长较慢,即高原区臭氧谷加深。
2)高原区高空污染物的减少以及局域Hadley环流减弱是高原区臭氧总量增加的原因;
3)南亚高压增强,对应的辐散增强则可能是高原区臭氧谷加深的原因。
本文仅从定性的角度讨论的青藏高原区夏季臭
氧恢复以及臭氧谷增强的可能原因,以后还可以利用计算臭氧通量输送与化学反应速率定量的分析其臭氧恢复的原因。
参考文献(References)
卞建春,李维亮,周秀骥,等.1997.青藏高原及其邻近地区流场结构季节性变化的特征分析[M]//中国地区大气臭氧变化及其对气候环境的影响(二).北京:气象出版社:273.Bian J C,Li W L,Zhou X J,et al.1997.Characteristics of seasonal variation of flow field structure in the Tibet Plateau and its adjacent areas[M]//Changes of atmospheric ozone and its impact on climate and environment in China(2).Beijing:Meteorological Press:273.(in Chinese).
Bian J C,Yan R C,Chen H B,et al.2011.Formation of the summertime ozone valley over the Tibetan Plateau:The Asian summer monsoon and air column variations[J].Adv Atmos Sci,28(6):1318-1325.
陈延聪,王盘兴,周国华,等.2009.夏季南亚高压的一组环流指数及其初步分析[J].大气科学学报,32(6):832-838.Chen Y C,Wang P X,Zhou G H,et al.2009.A preliminary analysis of circulation indices about the summer South Asian high pressure[J].Trans Atmos Sci,32(6):832-838.(in Chinese).
Guo D,Wang P X,Zhou X J,et al.2012.The dynamic effects of the south Asian high on the ozone valley over the Tibetan Plateau[J].Acta Meteorologica Sinica,26(2):216-228.
郭栋,周秀骥,刘煜,等.2012.南亚高压对青藏高原臭氧谷的动力作用[J].气象学报,70(6):1302-1311.Guo D,Zhou X J,Liu Y et al.2012.The dynamic effects of the south Asian high on the ozone valley over the Tibetan Plateau[J].Acta Meteorologica Sinica,70(6):1302-1311.(in Chinese).
Guo D,Su Y C,Shi C H,et al.2015.Double core of ozone valley over the Tibetan Plateau and its possible mechanisms [J].J.Atmos Sol-Terr Phy,130-131:127-131.
郭世昌,李琼,戴敏,等.2008.Hadley环流上升支特征及其与东亚臭氧变化的关系[J].云南大学学报:自然科学版,30(3):269-275.Guo S C,Li Q,Dai M,et al.2008.Features of Hadley circulation ascending branch and its relation to the variation of ozone in East Asia[J].Journal of Yunnan University(Natural Science),30(3):269-275.(in Chinese).
Hartmann D L,Wallace J M,Limpasuvan V,et al.2000.Can ozone depletion and global warming interact to produce rapid climate change?[J].Proceedings of the National Academy of Sciences,97(4):1412-1417.
IPCC.2007.Climate Change 2007:A comprehensive report.Switzerland:104.
刘煜,李维亮.2001.青藏高原臭氧低谷的加深及其可能的影响[J].气象学报,59(1):97-106.Liu Y,Li W L.2001.Deepening of ozone valley over Tibetan Plateau and its possible influences[J].Acta Meteorologica Sinica,59(1):97-106.(in Chinese).
Liu Y,Li W L,Zhou X J,et al.2003.Mechanism of formation of the ozone valley over the Tibetan Plateau in summer-transport and chemical process of ozone[J].Adv Atmos Sci,20(1):103-109.
Perlwitz J,Pawson S,Fogt R L,et al.2008.Impact of stratospheric ozone hole recovery on Antarctic climate[J].Geophys Res Lett,35(8):135-157.
Pienitz R,Vincent W F.2000.Effect of climate change relative to ozone depletion on UV exposure in subarctic lakes[J].Nature,404(6777):484-487.
Polvani L M,Previdi M,Deser C.2011.Large cancellation,due to ozone recovery,of future Southern Hemisphere atmospheric circulation trends[J].Geophysical Research Letters,38,L04707.doi:10.1029/2011GL046712.
Son S W,Polvani L M,Waugh D W,et al.2008.The impact of stratospheric ozone recovery on the Southern Hemisphere westerly jet[J].Science,320(5882):1486-1489.
Tian W S,Lu D R.2009.Impact of increasing stratospheric water vapor on ozone depletion and temperature change[J].Adv Atmos Sci,26(3):423-437
Ungar S.2000.Knowledge,ignorance and the popular culture:Climate change versus the ozone hole[J].Public Understanding of Science,9(3):297-312.
王盘兴.1994.垂直低分辨率GCM 模式大气平均经圈环流的诊断[J].南京气象学院学报,17(2):200-204.Wang P X.1994.Diagnosis of mean meridional circulation of the model atmosphere in the GCM with low resolution vertically[J].J Nanjing Inst Meteor,17(2):200-204.(in Chinese).
Zhang J,Tian W,Xie F,et al.2014.Climate warming and decreasing total column ozone over the Tibetan Plateau during winter and spring[J].Tellus B,66(8):136-140.
Zhou S,Zhang R.2005.Decadal variations of temperature and geopotential height over the Tibetan Plateau and their relations with Tibet ozone depletion[J].Geophy Res Lett,32(18):109-127.
周秀骥,罗超,李维亮,等.1995.中国地区臭氧总量变化与青藏高原低值中心[J].科学通报,40(15):1396-1398.Zhou X J,Luo C,Li W L,et al.1995.The change of total ozone in China and the low value center of the Tibetan Plateau[J].Chin Sci Bull,40(15):1396-1398.(in Chinese).
Ozone research has been a hot spot in research on climate change because stratospheric ozone can directly affect the earth system and climate change by absorbing solar ultraviolet radiation.The ozone valley over the Tibetan Plateau in summer has a significant impact on local climate.Against the background of energy conservation and emissions reduction,studying the characteristics and possible mechanism of ozone change in the future can provide theoretical support for the future development of relevant policies.
To understand future ozone trends over the Tibetan Plateau in summer and their possible mechanism,version 3 of the Whole Atmosphere Community Climate Model(WACCM3),with a horizontal resolution of 1.9°×2.5°(longitude×latitude)and vertical resolution of 1.1 km in the upper troposphere and lower stratosphere region,was used to simulate three emissions scenarios of the Special Report of the Intergovernmental Panel on Climate Change(IPCC).The three emissions scenarios were A1B(“[which] describes a future world of very rapid economic growth,global population that peaks in mid-century and declines thereafter,and the rapid introduction of new and more efficient technologies.Major underlying themes are convergence among regions,capacity building,and increased cultural and social interactions,with a substantial reduction in regional differences in per capita income.Direction of technological change in the energy system is a balance across all sources.”),A2(“[which] describes a very heterogeneous world.The underlying theme is self-reliance and preservation of local identities.Fertility patterns across regions converge very slowly,which results in continuously increasing global population.Economic development is primarily regionally oriented and per capita economic growth and technological change are more fragmented and slower than in other storylines.”),and B1(“[which] describes a convergent world with the same global population that peaks in mid-century and declines thereafter,as in the A1 storyline,but with rapid changes in economic structures toward a service and information economy,with reductions in material intensity,and the introduction of clean and resource-efficient technologies.The emphasis is on global solutions to economic,social,and environmental sustainability,including improved equity,but without additional climate initiatives.”).
The simulation results showed that,under A1B,A2 and B1,2001—2099 global total ozone has an increasing trend,which means ozone recovery.The increasing trend of total ozone under A2 is strongest,and the increasing trend of total ozone under B1 is weakest.In the three emissions scenarios,total ozone over the Tibetan Plateau area(26—38°N,75—105°E) shows an increasing trend,but the speed of recovery is slower than that of the global total ozone;that is,the ozone valley over the Tibetan Plateau will significantly deepen.Total chlorine content over the Tibetan Plateau in summer and the chloride concentration at 70 hPa near the center of the ozone valley over the Tibetan Plateau in summer showed decreasing trends for the next 100 years.Meanwhile,the ascending branch of local Hadley Circulation over the Tibetan Plateau in summer has a decreasing trend.These two factors lead to an increase in total ozone over the Tibetan Plateau in summer in the future.On the other hand,the intensity of the South Asia high in the future will enhance,the divergence near the South Asian high will strengthen,and the ozone flux divergence near the South Asian high will strengthen too,which may be the reason for the deepening of the ozone valley over the Tibetan Plateau.
In summary,in the period 2001—2099,based on the A1B,A2 and B1 emissions scenarios,total ozone is expected to increase over the Tibetan Plateau,caused by pollutants reduction and a weakening of local Hadley Circulation;the deepening of the ozone valley over the Tibetan Plateau may be controlled by the enhancement of the South Asia high.
ozone;Tibetan Plateau;future projection;trends;mechanism
(责任编辑:张福颖)
Ozone trends over the Tibetan Plateau in the next 100 years and their possible mechanism
SU Yuchen1,2,GUO Dong1,GUO Shengli1,2,SHI Chunhua1,LIU Renqiang1,LIU Yu3,SONG Liuming4,XU Jianjun1
1KeyLaboratoryofMeteorologicalDisaster,MinistryofEducation(KLME)/JointInternationalResearchLaboratoryofClimateandEnvironmentChange(ILCEC)/CollaborativeInnovationCenteronForecastandEvaluationofMeteorologicalDisasters(CIC-FEMD),NanjingUniversityofInformationScience&Technology,Nanjing210044,China;2InstituteofSpaceWeather,Nanjing210044,China;3ChineseAcademyofMeteorologicalSciences,Beijing100081,China;4JiaxingMeteorologicalBureau,Jiaxing314050,China
doi:10.13878/j.cnki.dqkxxb.20140925002
引用格式:苏昱丞,郭栋,郭胜利,等.2016.未来百年夏季青藏高原臭氧变化趋势及可能机制[J].大气科学学报,39(3):309-317.
SuYH,GuoD,GuoSL,etal.2016.OzonetrendsovertheTibetanPlateauinthenext100yearsandtheirpossiblemechanism[J].TransAtmosSci,39(3):309-317.doi:10.13878/j.cnki.dqkxxb.20140925002.(inChinese).
*联系人,E-mail:*002344@nuist.edu.cn;**shlguo@nuist.edu.cn
猜你喜欢
今日农业(2022年3期)2022-11-16
粮食问题研究(2022年2期)2022-04-25
军事文摘(2021年20期)2021-11-10
纺织检测与标准(2021年3期)2021-07-06
毛纺科技(2020年10期)2021-01-05
科学大众(2020年10期)2020-07-24
空间科学学报(2020年6期)2020-07-21
通信电源技术(2018年5期)2018-08-23
辽东学院学报(自然科学版)(2017年3期)2017-09-19
儿童故事画报·智力大王(2016年6期)2016-09-14
