
GUT MICROBIOTA OF BIGHEAD CARP (ARISTICHTHYS NOBILIS) AND PADDLEFISH (POLYODON SPATHULA) AFFECTED BY THEIR DIETS
2016-08-10 06:16WANGQinXIONGBangXiLUOGuoQiangSUYanQiuandLIUHaiYanChengduTongweiAquaticSCITechCoLTDChengdu6008ChinaCollegeofFisheryHuazhongAgriculturalUniversityWuhan430070China
水生生物学报 2016年4期
WANG Qin, XIONG Bang-Xi, LUO Guo-Qiang, SU Yan-Qiuand LIU Hai-Yan(. Chengdu Tongwei Aquatic SCI. & Tech Co. LTD, Chengdu 6008, China; . College of Fishery, Huazhong Agricultural University, Wuhan 430070, China)
GUT MICROBIOTA OF BIGHEAD CARP (ARISTICHTHYS NOBILIS) AND PADDLEFISH (POLYODON SPATHULA) AFFECTED BY THEIR DIETS
WANG Qin1, XIONG Bang-Xi2, LUO Guo-Qiang1, SU Yan-Qiu1and LIU Hai-Yan1
(1. Chengdu Tongwei Aquatic SCI. & Tech Co. LTD, Chengdu 610081, China; 2. College of Fishery, Huazhong Agricultural University, Wuhan 430070, China)
The gastrointestinal microbiota plays an important role in the growth, nutrition and well being of fishes and it would be necessary to know the microflora structure in the gastrointestinal tract and the influence factors. In this background, we used nested polymerase chain reaction-denaturing gradient gel electrophoresis (PCR-DGGE) and sequence analysis to investigate microbiota in the intestine of bighead carp and paddlefish. In this research, bighead carp was fed with live feed (BI-L) and compound feed (BI-C), and paddlefish was fed with live feed (PI-L, PS-L) and compound feed (PI-C, PS-C). A total of 16 bacterial species were identified by phylogenetic analysis. The Firmicutes group (31.25%, 5 OTU) totally dominated the bacterial communities in bighead carp and paddlefish. The other identified bacterial species included γ-Proteobacteria (25%, 4 OTU), Bacteroidetes (12.5%, 2 OTU), Fusobacteria (12.5%, 2 OTU), Cyanobacteria (6.25%, one OTU), Actinobacteria (6.25%, one OTU) and β-Proteobacteria (6.25%, one OTU). The higher similarities (above 49% in paddlefish and 59% in bighead carp) of the DGGE band patterns in intestinal bacteria between two groups feeding with different feed indicated that there are more stable microbial communi ties existed in these specifically ecological niches in both bighead carp and paddlefish. However, the microflora structure in the stomach has considerable difference in the two groups of paddlefish feeding with different feed, probably indicating that the community structures in stomach of paddlefish were affected by diet easily and significantly.
Bighead carp; Paddlefish; Microbiota; DGGE; Gastrointestinal tract
Bighead carp is one of four domestic Chinese carps, and is also the main fish in our traditional poly culture mode. Recently, according to the reports, paddlefish which has the same niche with bighead carp has partly substituted bighead carp in the traditional pond poly culture mode. It achieves a harvest both in economy and ecology, and obtains certain effects. The gastrointestinal microbiota plays an important role in the growth, nutrition and well being of fishes[1], and it would be necessary to know the microflora structure in the gastrointestinal tract and the influence factors.
To date, most studies about the microflora in the digestive tract of fish have been based on culturing techniques. However, these studies have limited the understanding of the complexity of the fish gut ecosystem. Studies on fish and a variety of water environmental samples suggest that only a minor percentage of the total microbial community present can be captured by using culture-based techniques[2]because of the non-culturability of many bacterial species[3, 4]. More recently, molecular methods have facilitated culture-independent studies and widened our knowledge of the gastrointestinal tracts of humans and animals[5, 6]. Several applications based on 16S rRNA genes, such as fluorescence in situ hybridization, denaturing or temperature gradient gel electrophoresis (DGGE or TGGE)[7, 8]and 16S rDNA clone librarieshave been successfully used for analysis of complex microbial communities. Many domestic researchers have adopted culture-independent methods in investigations on the bacterial communities in many fish species such as Silurus soldatovi meridonalis[9], grass carp[10], allogynogenetic crucial carp[11], Coilia nasus[12], yellow grouper[13]. These methods typically rely on the detection of microbial DNA directly from samples to infer information on the microbial populations and provide a unique perspective on the constituents of the microbiota.
Many researchers have carried out studies on growth and reproduction of paddlefish[14]and bighead carp[15]. Yan, et al.[16]have used PCR-DGGE to analyze intestinal contents of filter-feeding fishes silver carp and bighead carp. However, to our knowledge, no investigation of the gastrointestinal tract microbiota in bighead carp and paddlefish fed with compound diets and live diets has been undertaken and little information is available regarding comparation of the gastrointestinal tract microbiota diversity of two fishes.
Against this background, we used polymerase chain reaction denaturing gradient gel electrophoresis (PCR-DGGE) and DNA sequence analysis of individual amplicons[17]to perform a survey of the bacterial community structures in the gastrointestinal tract of paddlefish and bighead carp fed with live diets (most of the Cladoceran and small part of the copepods) and compound feeds, and simultaneously discuss the possible effect of diets on the microbiota in fish gastrointestinal tract.
1 Materials and methods
1.1 Fish and rearing conditions
The experimental fish were acquired from the 973 Experimental base locates at the College of Fisheries, Huazhong Agricultural University (HZAU),China. They were stocked in tanks and fed with live feed for two weeks prior to the 60 days of culture. The live feed was caught from the high-yield ponds in the vicinity of Huazhong Agricultural University,Wuhan, China. The analysis on nutrients of live feed is listed in Tab. 1[18].
The compound feed is designed according nutrient composition of live feed and other sturgeon nutritional requirements. The compound feed had better buoyancy (diameter 1.0—1.2 mm). The nutrition of compound feed was showed in Tab. 2[19].
The experiment was conducted at the Aquaculture Research Center, College of Fisheries, Huazhong Agriculture University, Wuhan, China. Mean initial weight of the 72 paddlefishes was (65.93±6.94) g, and all the fishes were randomly stocked at 2.01 m3(160 cm diameter×100 cm deep) six tanks with 12 fishes per experimental tank. During the experimental period, fishes were fed with live feed and compound feed at 9:00 am and 4:00 pm daily. Tanks were cleaned in every morning before feeding. The culture water was continuously changed circulatory after treatment through filtration and purification system. Water temperature ranged from 18—23℃, DO 6.5—8.2 mg/L,pH 7.1—7.9, ammonia nitrogen 0.3—0.5 mg/L and nitrite nitrogen 0.04—0.07 mg/L. The trial continued for 60 days.
Three fish per tank were randomly selected,weighed and measured after the culture trial. Mean terminal weight of 36 paddlefishes fed in live feed was (163.30±14.75) g and fed in compound feed was (147.72±7.92) g, respectively. Three samples were taken from each tank and then tested. A total of eighteen samples tested.
1.2 Sample preparation and collection of bacteria cell
The ventral belly surface of the fish was opened to expose the peritoneal cavity. The spleen, gall bladder, liver and fat deposits surrounding the gastrointestinal tract were removed. The digestive tracts were excised. The intestine and stomach contents of three randomly selected fishes from each group were squeezed out.
1.3 DNA extraction
Total bacterial genomic DNA was extracted by using omega E.Z.N.A.TMstool DNA kit (OMEGA,USA), according to the producer's protocol. The total DNA concentration was measured using spectrophotometric analysis. The genomic DNA was dissolved in 50 μL sterile ultrapure water and were stored at -20 ℃.
1.4 PCR of 16S rDNA
The full-length sequence of 16S rDNA was amplified by using a pair of bacterial universal primers[20]. The primer sequences were as follows: U8f (5′-AGAGTTTGATCMTGGCTCAG-3′) and U1492r (5′-TACGGYTACCTTGTTACGACTT-3′). Polymerase chain reaction (PCR) was carried out by using the TaKaRa Ex TaqTM(TaKaRa Biotechnology,Dalian, China), according to the producer's protocol by adding 1 mL template DNA and 10 pmol of each primer in a 25 mL total reaction volume. PCR was performed by using the PTC-100 Peltier Thermal Cycler (Bio-Rad, Hercules, CA, USA) with the following thermo-profiles: an initial denaturation at 95℃for 5min; 25 cycles of 94℃for 30s, 52℃for 30s and 72℃ for 1.5min; and a final extension step at 72℃for 10min. The product was used as the template inthe next amplification for the variable V3 region of 16S rDNA.
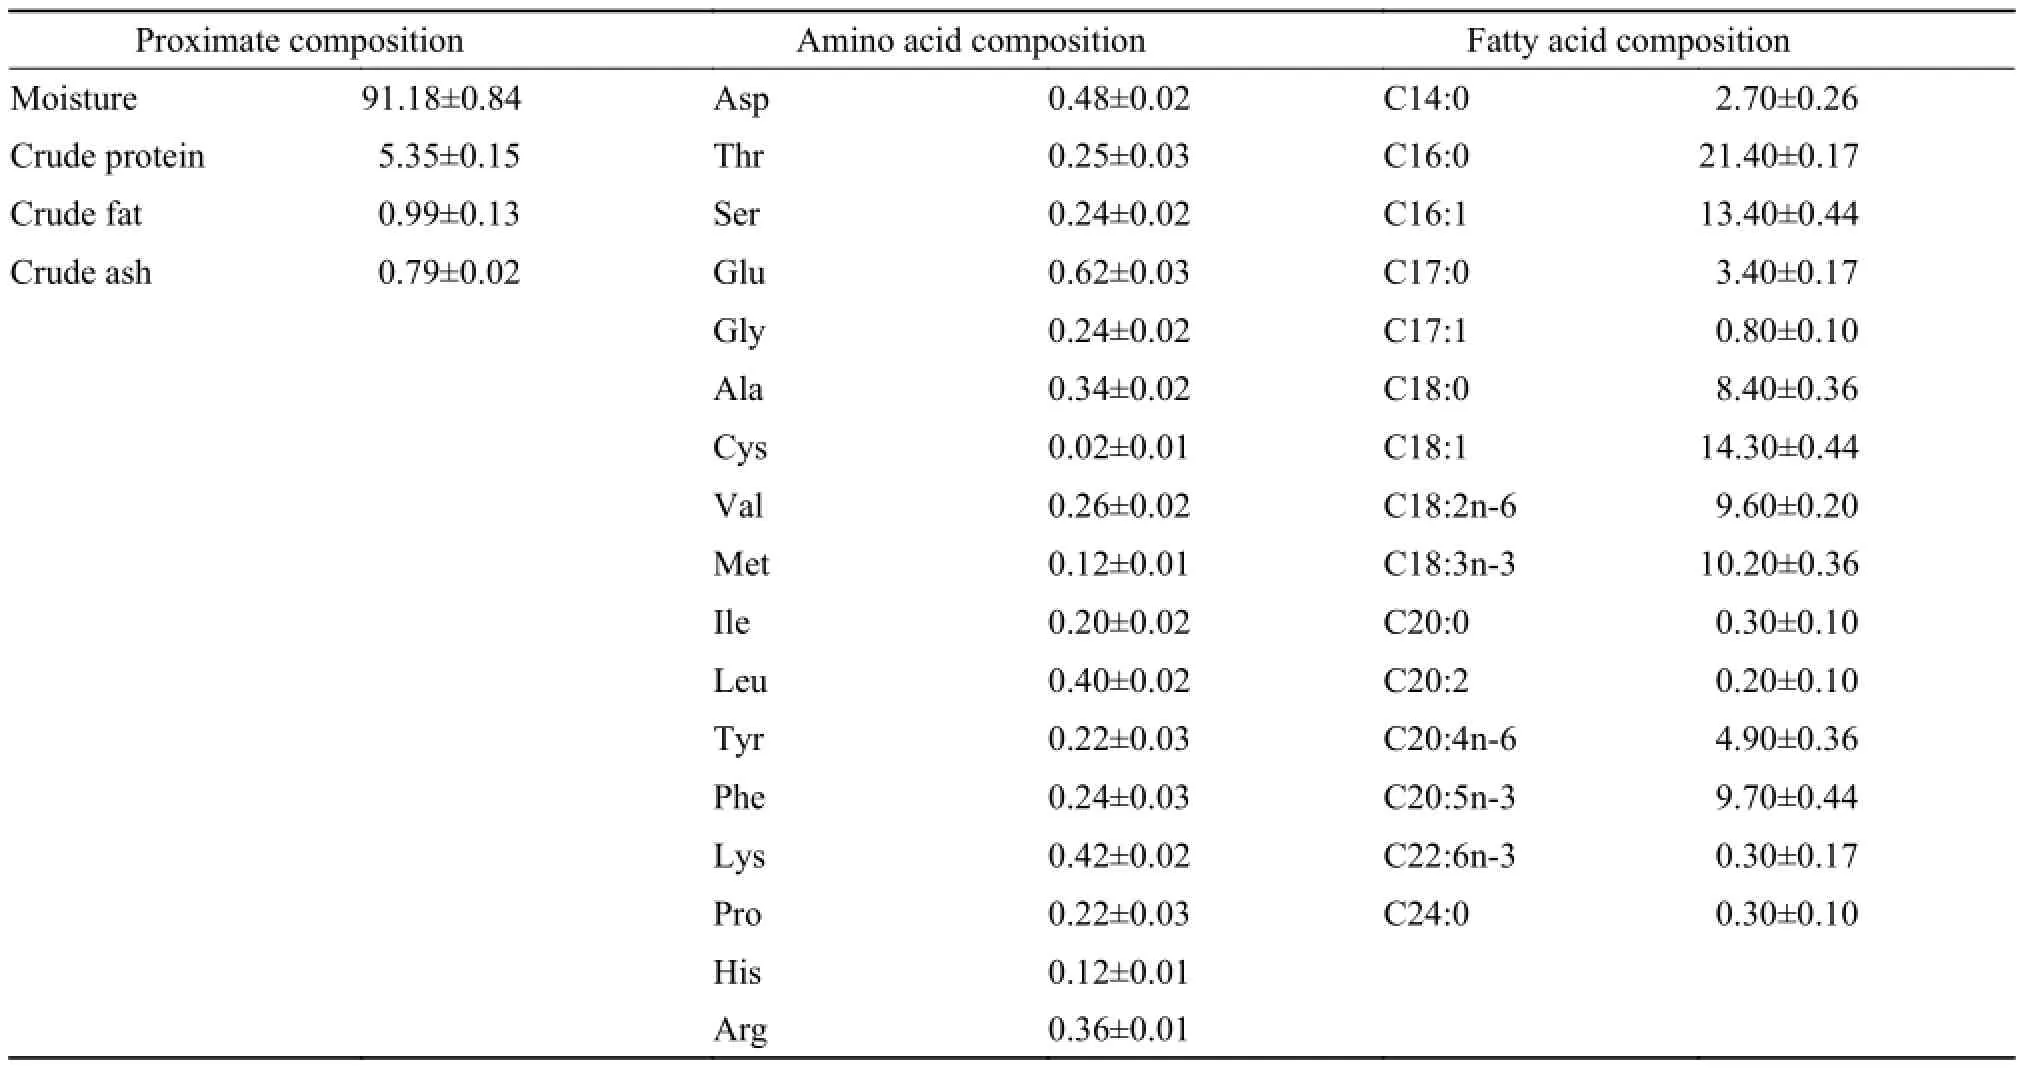
Tab. 1 The analysis on nutrients of live feed (%)
A combination of primers 357f and 518r was used to amplify the V3 region of 16SrDNA in the second round of PCR. The primer and GC clamp sequences were as follows: primer357f, 5′-CGCC CGCCGCGCCCCGCGCCCGGCCCGCCGC CCCCGCCCCCCTACGGGAGGCAGCAG-3′;primer 518r, 5′-ATTACCGCGGCTGCTGG-3′. The primer 357f contains a GC-rich clamp attached to its 5′ end and is specific for most bacteria. PCR was carried out using the TaKaRa Ex TaqTMaccording to the manufacturer's protocol by adding 1 μL of the first amplification product DNA and 20 pmol of eachprimer in a 50 mL total reaction volume. Amplification start an initial denaturation at 94℃ for 4min, 10 cycles of touchdown PCR were performed (94℃ for 30s, 61℃ for 30s, with a 0.5℃ per cycle decrement,and 72℃for 1min), followed by 25 cycles of PCR (94℃for 30s, 56℃ for 30s, and 72℃ for 1min), and a final extension step at 72℃ for 7min. All the above PCR products were analysed using electrophoresis in a 1% (w/v) agarose gel containing GoldView (0.5% v/v).
1.5 DGGE and sequencing of 16S rDNA
Denaturing gradient gel electrophoresis was performed by using a INGENYphorU-2 System (INGENY International BV, the Netherlands) to separate the above PCR products. The DNA bands on the DGGE gel should represent the apparent bacterial diversity Polymerase chain reaction samples were applied directly onto 9% (w/v) polyacrylamide gels in a 0.5 TAE buffer with a denaturing gradient ranging from 40% to 70% of denaturing (100% corresponds to 7 mol/L urea and 40% [v/v] formamide). Electrophoresis was performed with a constant voltage of 120V at 60℃ for about 12h. Gels were incubated for 30min in 1×TAE buffer containing SYBR-GREENⅠ (1∶10000 [v/v]), photographed with Gel Documentation XR system (Bio-Rad, America).
The selected main DGGE bands were excised from the gels for sequencing and identification. For the bands at the same distance from the well in different lanes, only one band was cut representing the same bacterial 16S rDNA. The band was excised from the DGGE gel, eluted and amplified again with the same primers 357f (without GC clamp) and 518r. The PCR product mixture was subsequently cloned into the pMD 18-T vector (TaKaRa Biotechnology). Plasmid DNA was purified from the resulting clones using the Qiagen Mini-Prep plasmid purification kit (Qiagen, Valencia, CA, USA).16 bands were sequenced by Shanghai Sunny Biotechnology Co., Ltd.
1.6 Data analysis
The 0/1 matrix of DGGE bands was extracted using the Quantity One software package. The similarity matrix was calculated based on the 0/1 matrix and the UPGMA clustering was conducted by the Quantity One software package. All sequences were submitted for similarity searches using the BLAST program[21]. The closest relatives and phylogenetic affiation of the obtained sequences were determined using the BLASTN programin GenBank at the NCBI web site. The construction of the phylogenetic tree was performed using the neighbour-joining method[22]. The percentages of replicate trees in which the associated taxa are clustered together in the bootstrap test (1000 replicates) are shown next to the branches[23]. The evolutionary distances were computed using the maximum composite likelihood method[24]and are in the units of the number of base substitutions per site. Phylogenetic analyses were conducted in MEGA4.1[25].
2 Results
2.1 DGGE pattern of different samples
Sixteen bands (1-16) were excised from the DGGE gel (Fig. 1). Cluster analysis of the DGGE band patterns showed the community similarity among all the samples in two groups of fish (Fig. 2). Two main clusters were observed ignored BI-L2 and PI-C3 (Fig. 2): (1) the first cluster including paddlefish intestinal samples of Group C and Group L as well as paddlefish stomach samples of Group L with 42% similarity and (2) the second cluster comprising bighead carp intestinal samples of Group C and Group L as well as paddlefish stomach samples of Group C with 59% similarity. The higher similarities in intestinal samples between two groups of fish indicated that more stable microbial communities existed in these ecological niches in bighead carp and paddlefish. The lower similarity between paddlefish stomach samples of two groups possibly indicated that diets had a significant influence on the composition of the stomach samples. In addition, we also noted that the three individuals of paddlefish intestinal samples of group L showed higher similarity (PI-L,84%), the same as the three individuals of paddlefish stomach samples of group L (PS-L, 69%), three individuals of paddlefish stomach samples of group C (PS-C, 78%), two individuals of paddlefish intestinal samples of group C (PI-C1&PI-C2, 64%), two individuals of bighead carp intestinal samples of group C (BI-C2 &BI-C3, 91%), two individuals of bighead carp intestinal samples of group L (BI-L1& BI-L3,73%). But PI-C3 only showed 28% similarity with the remaining two individuals, and BI-L2 just showed 23% similarity with the remaining two individuals.
2.2 Sequence and system analysis
A total of 16 bands were successfully sequenced from the DGGE gel (Tab. 1); these sequences (named band1-band16) and each of their closest sequences obtained from BLASTN searches in the GenBank database, were used to construct phylogenetic trees (Fig. 3). These sequences of approximately 169—195 bp were compared by using an online classifier tool in RDP and also shown in Tab. 3. The bacteria identified from two groups of bighead carp and paddlefish were closely related to one of the following groups:Firmicutes group (31.25%, five sequences), γ-Proteo-bacteria (25%, four sequences), Bacteroidetes (12.5%,two sequences), Fusobacteria (12.5%, 2 sequences),Cyanobacteria (6.25%, one sequence), Actinobacteria(6.25%, one sequence) and β-Proteobacteria (6.25%,one sequence). However, the bacteria were identified as uncultured, accounting for 37.5% (six sequences). Band 3 and Band 4 showed similarities to the closest relatives obtained with 95% and 91% only, respectively, indicating that they might represent two new species. There were no significant differences in the bacterial community composition in the gastrointestinal samples between two groups of bighead carp and paddlefish.
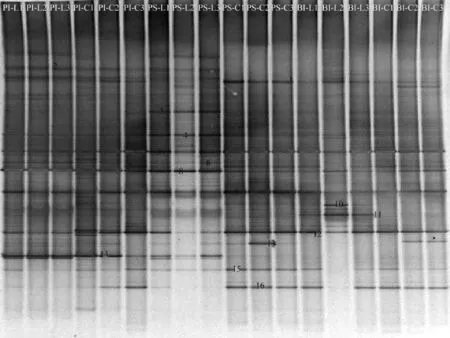
Fig. 1 PCR-DGGE 16S rDNA banding profiles of the gastrointestinal microbiota from bighead carp and paddlefish PI, BI, PS are represented as the samples from Paddlefish intestine, bighead carp intestine and Paddlefish stomach; the-L,-C are represented as the fishes fed live feed and compound feed. The number1, 2, 3 represents the different individuals of same treatment group. The same applies below
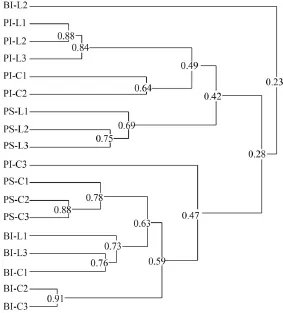
Fig. 2 The result of UPGMA clustering based on the 0/1 similarity matrix of the gastrointestinal microbiota from bighead carp and paddlefish
3 Discussion
Denaturing gradient gel electrophoresis of the 16S rRNA gene has been successfully used to characterize bacterial populations associated with fish gastrointestinal tract[9—12, 26]. The banding patterns can reflect the composition of the dominant bacterial community, and further, the relative intensity of each DGGE band corresponded at least semi-quantitatively to the abundance of the corresponding original species[27]. Therefore, we adopted PCR-DGGE to analyze the gastrointestinal bacterial community in bighead carp and paddlefish in the present study.
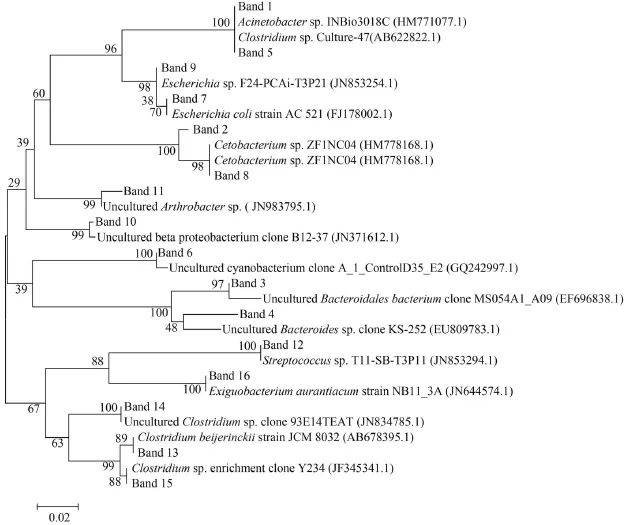
Fig. 3 Neighbour-joining phylogenetic tree showing the relationship of bacterial 16S rDNA gene
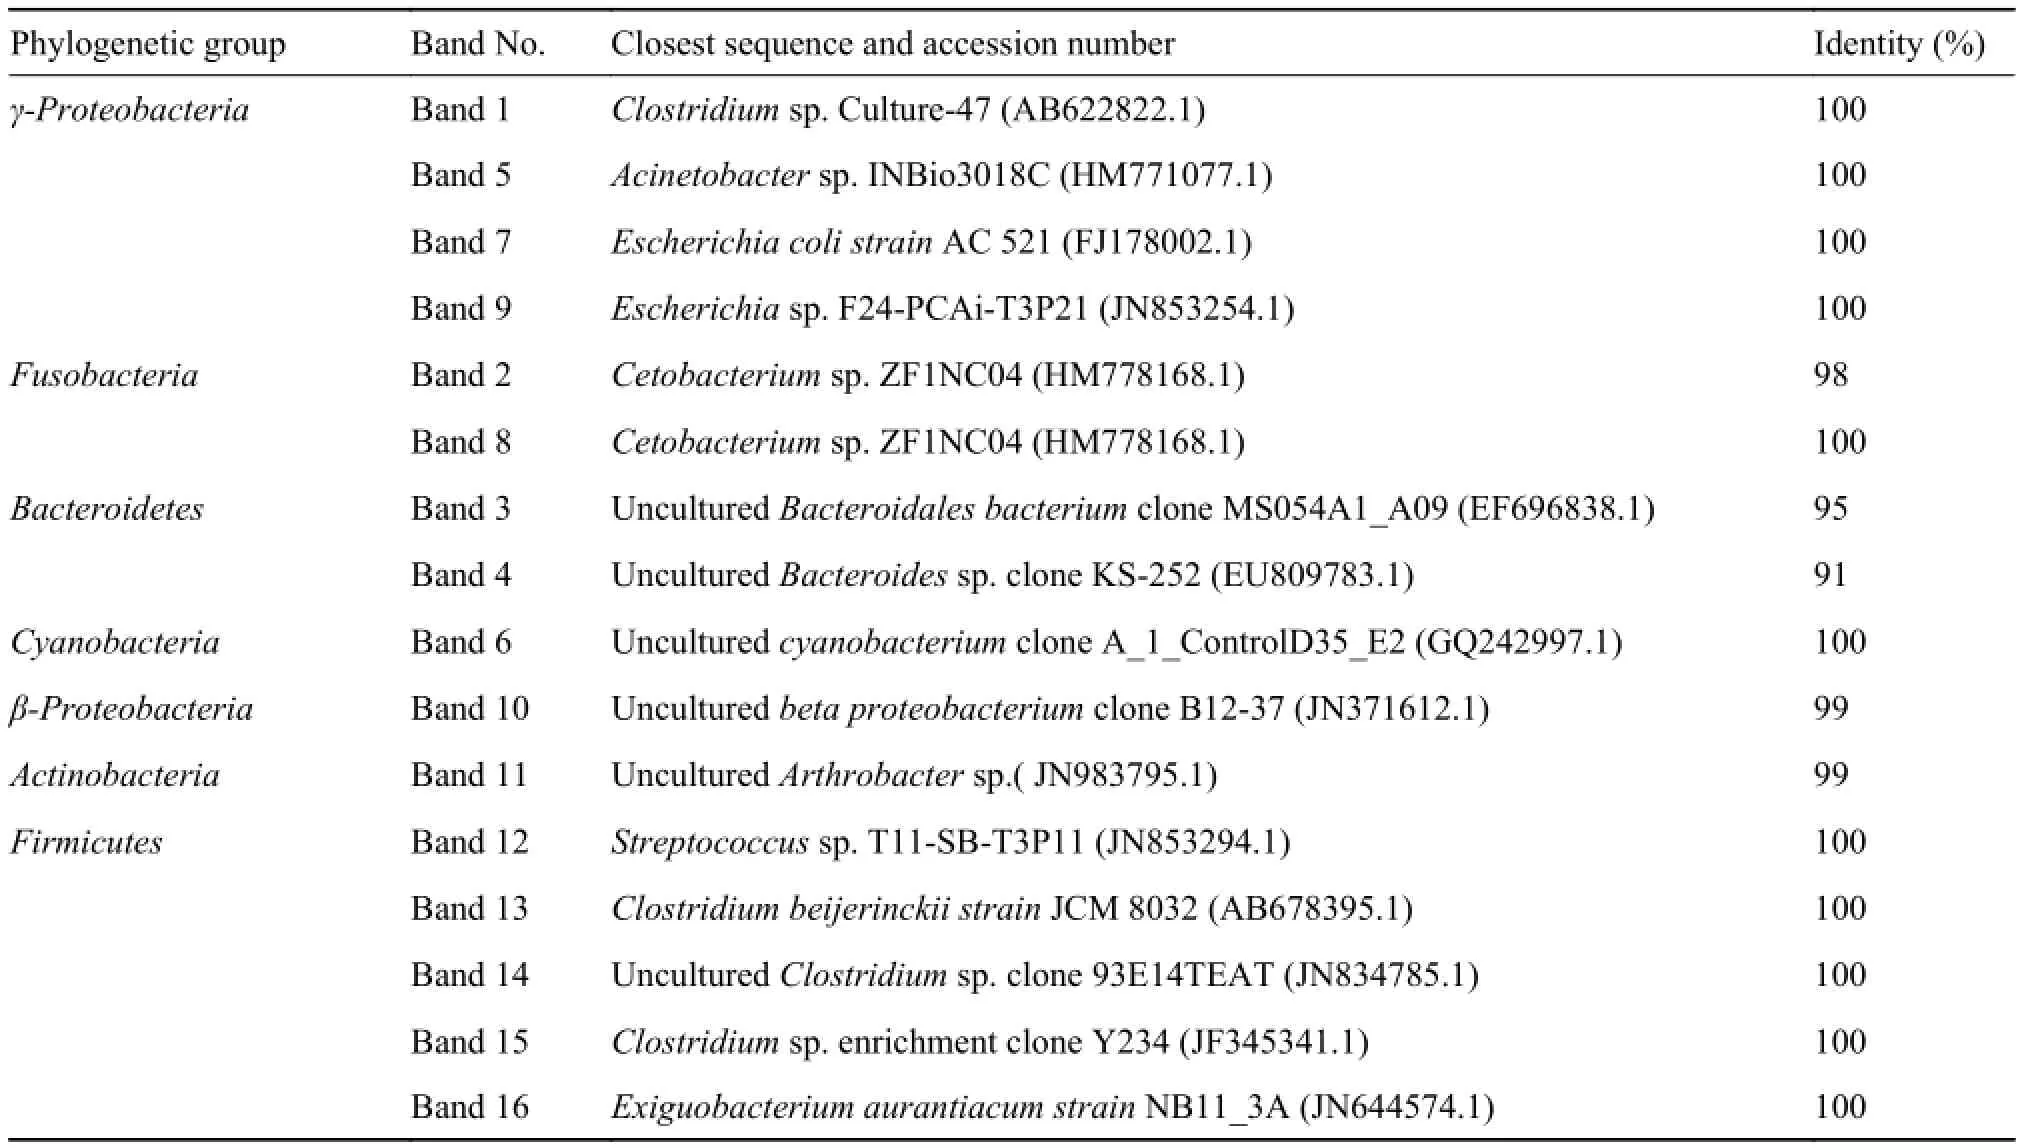
Tab. 3 16S rDNA V3 sequence similarities to closest relatives of DNA recovered from the respective bands in DGGE gels
Previously, many researchers[26, 28, 29]had founddifferences in the microbial communities in intestines in fish fed with different diets through investigation,indicating that diets had an influence on the intestinal microbiota in fish. Dietary manipulation influenced the species composition of the intestinal microbiota in fish such as Arcticcharr (Salvelinus alpinus L.)[28]and Atlantic cod[30]. In this study, there were no significant differences in the community structures in intestinal samples between two groups of bighead carp and paddlefish, indicated that more stable microbial communities existed in these specifically ecological niches in two fishes. This was consistent with the results of Feng et al.[26],higher similarities (above 91%) of the DGGE band patterns in skin, gill and intestinal-non-adherent bacteria between the two groups of yellow grouper, although these fish were fed with different diets and held in two rearing systems[26]. Considerable differences existed between two groups of paddlefish stomach samples, probably indicating that the community structures in stomach were easily and significantly affected by diets. The results indicated that more stable microbial communities existed in these specifically ecological niches (intestinal digesta) in bighead carp and paddlefish in the present study. We speculated that possibly the intestinal microbial communities mainly depended on the water body in the rearing systems and animal species. As the culture freshwater bodies of the compound diet group were identical to the live diet group and both groups of fish belonged to the same animal species (bighead carp and paddlefish), these microbial communities in intestinal digesta between two groups of fish were highly similar,but some researchers showed that intestinal tract bacteria was not the same as the aquaculture water flora[31], so we speculated that animal species are the main determinant of the intestinal microbiota, this was consistent with the results of Li et al[32, 33]. Li et al.[32]investigated the influence of host species on intestinal microbiota by comparing the gut bacterial community structure of four cohabitating freshwater fish larvae, silver carp, grass carp, bighead carp, and blunt snout bream, using denaturing gradient gel electrophoresis of the amplified 16S and 18S rRNA genes, and demonstrated distinct dominant intestinal microbiota in four fish larvae reared in the same environment and species is a strong determinant of the intestinal microbiota. However, the lower similarity (only 28%) between paddlefish stomach samples indicated the possible role of diets. Similar to the above analysis, the difference in the communities in the intestinal samples should not be attributed to the differences in fish diet and other rearing conditions, except for fish species. Similarly, both of the highly identical culture water body and the same fish species between two experimental groups perhaps have little influence on the community structures of the stomach samples of paddlefish. Therefore, it was more likely that the differences in microbiota in the stomach samples of paddlefish were mainly attributed to the diet factor.
We observed that PI-C3 only showed 28% similarity with the remaining two individuals, and BI-L2 just showed 23% similarity with the remaining two individuals, indicating that different conditions within a host may influence the composition of intestinal bacteria, this was consist with kim et al.[34]who have found that fish fed with the same feed under identical conditions did not possess the same microflora in similar proportions. This individual variation in bacterial diversity was also found in other studies[14, 35]. Our results showed that the Firmicutes and γ-Proteobacteria group dominated completely in all the bacterial species identified by sequencing and phylogenetic analysis, which was consistent with the results of previous studies, indicating high levels of Proteobacteria in fish[13, 32]. Li et al.[32]investigated the gut bacterial community structure of four cohabitating freshwater fish larvae, silver carp, grass carp, bighead carp,and blunt snout bream also showed Proteobacteria,Actinobacteria, Bacteroidetes, Firmicutes, and Cyanobacterial are the major phyla.
In conclusion, the Firmicutes and γ-Proteobacteria completely dominated in all the bacterial species identified from bighead carp and paddlefish gastrointestinal tract fed with two diets. The higher similarities (above 49% and 47%) of the DGGE band patterns in paddlefish and bighead intestinal samples of group-L and group-C indicated that more stable microbial communities existed in these specifically ecological niches in two fishes. However, considerable differences existed between two paddlefish stomach samples, probably indicating that the community structures in stomach were easily and significantly affected by diets.
Acknowledgments:
We thank Ni Jia-Jia and Li Hao for their assistance in sampling and molecular experiments.
References:
[1]Nayak S K. Role of gastrointestinal microbiota in fish [J]. Aquaculture Research, 2010, 41(11): 1553—1573
[2]Tanaka R, Sugimura I, Sawabe T, et al. Gut microflora of abalone Haliotis discus hannai in culture changes coincident with a change in diet [J]. Fisheries Science, 2003, 69(5):951—958
[3]Spanggaard B, Huber I, Nielsen J, et al. The microflora of rainbow trout intestine: a comparison of traditional and molecular identification [J]. Aquaculture, 2000, 182(1—2):1—15
[4]Huber I, Spanggaard B, Appel K F, et al. Phylogenetic analysis and in situ identification of the intestinal microbial community of rainbow trout (Oncorhynchus mykiss, Walbaum) [J]. Journal of Applied Microbiology, 2004, 96(1):117—132
[5]Zoetendal E G, Akkermans A D L, Devos W M. Temperature gradient gel electrophoresis analysis of 16S rRNA from human fecal samples reveals stable and host-specific communities of active bacteria [J]. Applied and Environmental Microbio-logy, 1998, 64(10): 3854—3859
[6]Konstantinov S R, Zhu W Y, Williams B A, et al. Effect of fermentable carbohydrates on piglet faecal bacterial communities as revealed by denaturing gradient gel electrophoresis analysis of 16S ribosomal DNA [J]. FEMS Microbiology Ecology, 2003, 43(2): 225—235
[7]Rosenbaum V, Riesner D. Temperature-gradient gel electrophoresis: Thermodynmic analysis of nucleic acids and proteins in purified form and in cellular extracts [J]. Biophysical Chemistry, 1987, 26(2—3): 235—246
[8]Muyzer G, De Waal E C, Uitterlinden A G. Profiling of complex microbial populations by denaturing gradient gel electrophoresis analysis of polymerase chain reaction-amplified genes coding for 16S rRNA [J]. Applied and Environmental Microbiology, 1993, 59(3): 695—700
[9]Li J J, Ni J J, Li X M, et al. Relationship between gastrointestinal bacterial structure and development of Silurus soldatovi meridonalis Chen [J]. Acta Hydrobiologica Sinica, 2013, 37(4): 613—619 [李金金, 倪加加, 李雪梅, 等.南方大口鲇消化道细菌群落结构与其胃肠分化的关系. 水生生物学报, 2013, 37(4): 613—619]
[10]Wang C, Ni J J, Yan Q Y, et al. Comparison of the intestinal bacterial communities between grass carp (Ctenopharyngodon idellus) and bluntnose black bream (Megalobrama amblycephala) [J]. Acta Hydrobiologica Sinica, 2014, 38(5):868—875 [王纯, 倪加加, 颜庆云, 等. 草鱼与团头鲂肠道菌群结构比较分析. 水生生物学报, 2014, 38(5): 868—875]
[11]Li X H, Yan Q Y, Hu H J, et al. Effects of refeeding on the diversity of intestinal microflora in allogynogenetic crucial carp (Carassius auratus gibelio) [J]. Acta Hydrobiologica Sinica, 2014, 38(5): 854—859 [李星浩, 颜庆云, 胡红娟, 等.异育银鲫消化道微生物群落对恢复投喂的响应. 水生生物学报, 2014, 38(5): 854—859]
[12]Nie Z J, Xu G C, Du F K, et al. PCR-DGGE fingerprinting and diversity analysis of the predominant bacterial community in Coilia nasus [J]. Acta Hydrobiologica Sinica,2015, 39(5): 1019—1026 [聂志娟, 徐钢春, 杜富宽, 等. 长江刀鲚体内菌群PCR-DGGE 指纹图谱及多样性比较分析.水生生物学报, 2015, 39(5): 1019—1026]
[13]Zhou Z, Liu Y, Shi P, et al. Molecular characterization of the autochthonous microbiota in the gastrointestinal tract of adult yellow grouper (Epinephelus awoara) cultured in cages [J]. Aquaculture, 2009, 286(3—4): 184—189
[14]Zhu X Y, Zhong T, Pandya Y, et al. 16S rRNA-based analysis of microbiota from the cecum of broiler chickens [J]. Applied and Environmental Microbiology, 2002, 68(1):124—137
[15]Creme M C, Smitherman R O. Food habits and growth of silver and bighead carp in cages and ponds [J]. Aquaculture,1980, 20(1): 57—64
[16]Yan Q Y, Yu Y H, Zhang T L, et al. PCR-DGGE fingerprinting analysis on intestinal contents of filter-feeding fishes (Hypophthalmichthys molirix and Aristichthys nobilis) [J]. Journal of Fisheries of China, 2009, 33(6): 972—979 [颜庆云, 余育和, 张堂林, 等. 滤食性鲢、鳙肠含物PCRDGGE指纹分析. 水产学报, 2009, 33(6): 972—979]
[17]Muyzer G. DGGE/TGGE a method for identifying genes from natural ecosystems [J]. Current Opinion in Microbiology, 1999, 2(3): 317—322
[18]Shi P S, Wang Q, Zhu Y T, et al. Comparative study on muscle nutritional composition of juvenile bighead carp (Aristichthys nobilis) and paddlefish (Polyodon spathula) fed live feed [J]. Turkish Journal of Zoology, 2013, 37(3):321—328
[19]Shi P S, Zhu Y T, Wang Q, et al. Comparison of nutrition compositions of juvenile paddlefish (Polyodon spathula) fed with live feed and formula feed [J]. Turkish Journal of Fishe ries and Aqutic Sciences, 2013, 13(2): 271—279
[20]Gomila M, Gascó J, Busquets A, et al. Identification of culturable bacteria present in haemodialysis water and fluid [J]. FEMS Microbiology Ecology, 2005, 52(1): 101—114
[21]Altschul S F, Gish W, Miller W, et al. Basic local alignment search tool [J]. Journal of Molecular Biology, 1990, 215(3):403—410
[22]Saitou N, Nei M. The neighbor-joining me-thod: a new method for reconstructing phylogenetic trees [J]. Molecular Biology and Evolution, 1987, 4(4): 406—425
[23]Felsenstein J. Confidence limits on phylogenies: an approach using the bootstrap [J]. Evolution, 1985, 39(4):783—791
[24]Tamura K, Nei M, Kumar S. Prospects for inferring very large phylogenies by using the neighbor-joining method [J]. Proceedings of National Academy of Sciences (USA), 2004,101(30): 11030—11035
[25]Tamura K, Dudley J, Nei M, et al. MEGA4: molecular evolutionary genetics analysis (MEGA) software version 4.0 [J]. Molecular Biology and Evolution, 2007, 24(8): 1596—1599
[26]Feng J, Hu C, Luo P, et al. Microbiota of yellow grouper (Epinephelus awoora Temminck & Schlegel, 1842) fed two different diets [J]. Aquaculture Research, 2010, 41(12):1778—1790
[27]Boon N, Windt W D, Verstraete W, et al. Evaluation of nes-ted PCR-DGGE (denaturing gradient gel electrophoresis)with group-specific 16S rDNA primers for the analysis of bacterial communities from different wastewater treatment plants [J]. FEMS Microbiology Ecology, 2002, 39(2):101—112
[28]RingØ E, Olsen R E. The effect of diet on aerobicbacterial flora associated with intestine of Arctic charr (Salvelinus alpinus L.) [J]. Journal of Applied Microbiology, 1999,86(1): 22—28
[29]Refstie S, Landsverk T, Bakke-McKellep A M, et al. Digestive capacity, intestinal morphology, and microflora of 1-year and 2-year old Atlantic cod (Gadus morhua) fed standard or bioprocessed soybeanmeal [J]. Aquaculture, 2006,261(1): 269—284
[30]RingØ E, Sperstad S, Myklebust R, et al. The effect of dietary inulin on aerobic bacteria associated with hindgut of arctic charr (Salvelinus alpinus L.) [J]. Aquaculture Research,2006, 37(9): 891—897
[31]Zhang H, Zhou T, Wang Y. Bacterial composition in the intestine of freshwater pearl mussel and co-cultured fishes in an integrated culture pond [J]. Acta Hydrobiologica Sinica, 2013, 37(5): 824—835 [张涵, 周涛, 王岩. 综合养殖池塘中三角帆蚌和鱼类肠道细菌的组成. 水生生物学报, 2013,37(5): 824—835]
[32]Li X M, Yu Y H, Feng W S, et al. Host species as a strong determinant of the intestinal microbiota of fish larvae [J]. The Journal of Microbiology, 2012, 50(1): 29—37
[33]Li X M, Yu Y H, Xie S Q, et al. PCR-DGGE fingerprinting analysis on intestinal microbial community of three indoor rearing fishes [J]. Acta Hydrobiologica Sinica, 2011, 35(3):321—429 [李雪梅, 余育和, 解绶启, 等. 三种室内饲养鱼类肠道微生物群落PCR-DGGE指纹分析. 水生生物学报,2011, 35(3): 321—429]
[34]Kim D H, Brunt J, Austin B. Microbial diversity of intestinal contents and mucus in rainbow trout (Oncorhynchus mykiss) [J]. Journal of Applied Microbiology, 2007, 102(6):1654—1664
[35]Spanggaard B, Huber I, Nielsen J, et al. The microflora of rainbow trout intestine: a comparison of traditional and molecular identification [J]. Aquaculture, 2000, 182(1—2):1—15
10.7541/2016.105
S965.1; S965.2 Document code: A Article ID: 1000-3207(2016)04-0814-09
date: 2015-05-29; Accepted date: 2015-12-14
Supported by State Key Development Program (973) for Basic Research of China (Grant No. 2009CB118706)
Brief introduction of author: Wang Qin (1985—), female, born in Hubei, Master student, major in ecological fishery. E-mail: wangqin3992@126.com
Xiong Bang-Xi, E-mail: bangxix8@mail.hzau.edu.cn
猜你喜欢
教育周报·教育论坛(2021年21期)2021-04-14
小哥白尼(趣味科学)(2021年11期)2021-02-28
小天使·一年级语数英综合(2020年10期)2020-12-16
书香两岸(2020年3期)2020-06-29
短篇小说(原创版)(2017年6期)2017-08-29
中华肩肘外科电子杂志(2017年1期)2017-01-11
环境科技(2016年4期)2016-11-08
自动化学报(2016年8期)2016-04-16
青少年科技博览(中学版)(2015年7期)2015-08-12
长江蔬菜(2014年1期)2014-03-11
