
The experiment and analysis of transitional flow in pipe*
2016-10-14 12:23JunWANG王军GuangshengDU杜广生JingyingWANG王京盈JieGENG耿介DongLI李冬
水动力学研究与进展 B辑 2016年2期
关键词:王军
Jun WANG (王军),Guang-sheng DU (杜广生),Jing-ying WANG (王京盈),Jie GENG (耿介),Dong LI (李冬)
1.School of Energy and Power Engineering,Shandong University,Jinan 250061,China
2.School of Thermal Engineering,Shandong Jianzhu University,Jinan 250101,China,E-mail:wwjjy99@126.com
The experiment and analysis of transitional flow in pipe*
Jun WANG (王军)1,2,Guang-sheng DU (杜广生)1,Jing-ying WANG (王京盈)1,Jie GENG (耿介)1,Dong LI (李冬)1
1.School of Energy and Power Engineering,Shandong University,Jinan 250061,China
2.School of Thermal Engineering,Shandong Jianzhu University,Jinan 250101,China,E-mail:wwjjy99@126.com
The transitional flow in a pipe is important for delivery,but its characteristics remain to be explored.In this paper,the two-dimensional laser Doppler velocimetry (LDV) is used for the study,focusing on the attenuation characteristics of the axial velocity,the variation of the velocity gradient,the effect of the angle between the axis and the resultant velocity vector,and the relationship between the energy coefficient and the flow state.The attenuation characteristics of the axial velocity along the radial direction are obtained.It is shown that with the increase of the Reynolds number,the change rate of the velocity gradient slows down with a similar distribution,and a rapid decrease is seen in the near wall region.The amplitude and the frequency of the angular variation are obviously improved with the increase of the Reynolds number.The instability of the velocity field is enhanced with the increase of the energy coefficient.
transitional flow,attenuation,velocity gradient,flow instability,energy coefficient
Introduction
The pipe flow is one of the most common phenomena in industrial processes,the flow in the pipe is complicated,unstable,and related with a complex fluid dynamics.Aravinth[1]studied the heat and mass transfer processes of the turbulent fluid flow in the pipe,and proposed formulas obtained from a wide range of experimental data.References [2,3]analyzed the fully developed turbulent pipe flow by experiments,and obtained the velocity distribution and the von Karman' s coefficient in the pipe.
Most of the researches mentioned above deal with the turbulence.The transition from the laminar to the turbulent flows has not been paid due attention,while there are significant differences between theflow field of a fully developed turbulence and that in the transitional area.A simplified flow model is often adopted to analyze it,and the experimental results focus on the change of the turbulent velocity field in the pipe.
The transitional flow may be found in civil and industrial processes,and it is often treated as a turbulence.Using this method to design the pipe system and to make the flow measurement will cause a remarkable error,therefore,it is important to make a study of the flow of the transition area.The difference between a simplified theoretical model and the actual flow will bring about some errors,as the simplified model cannot fully reflect the essence of the pipe flow.In this paper,we study the transition area in the pipe by the experimental method to avoid the disadvantage of the simplified model.In the meantime,the factors affecting the pipe flow are discussed based on the velocity field.
The Navier-Stokes (N-S) equation[4]of the incompressible fluid is usually used in the study of the pipe flow.In order to analyze the flow situation,the traditional method of analysis is to simplify the N-S equation by a dimensionless method.The dimensionless N-S equation takes the form
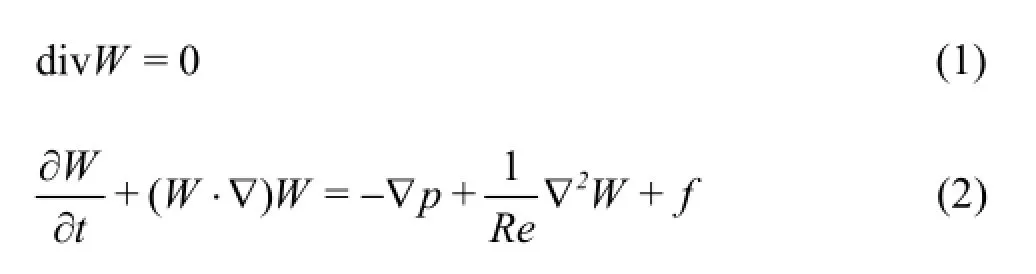
In Eq.(1) and Eq.(2),W is the speed,t is the time,p is the pressure,Re is the Reynolds number andf is the volume force.
It can be found from the dimensionless equations that the flo w states with the same Reynolds number are similar.It is seen that the speed item plays an important part in the flow process,so that the attenuation and the change of the velocity in the pipe can affect the flow significantly.In this paper,we use the two-dimensional laser Doppler velocimetry (LDV)[5,6]for the measurements in the transition area of the pipe flow.Because of the measuring advantage of the LDV[7,8]in the near wall region,the results can reflect the true state of the flow due to the uniformity of distribution and the good flow property of the natural impurities in water.The test area is arranged depending on the structural characteristics of the three-dimensional coordinate frame.
From the pipe wall to the axis in the radial direction,the LDV is utilized sequentially for different positions and sections of the flow at different Reynolds numbers to obtain the flow parameters.From the experiment results,we can further analyze the variation and the attenuation of the flow and check the effects of the relevant parameters on the flow state.A reference can be provided for the numerical simulation of the pipe,the design of the piping system and the flow measuring device.
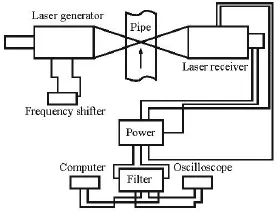
Fig.1 Doppler testing system
1.Experiment devices
The experimental system includes a water circulation system[9-11]and a Doppler testing system,the water circulation system includes an upper water tank,a pipe system,an electromagnetic flow meter,a regulating valve,a circulating water pump and a lower water tank.The Doppler testing system is shown in Fig.1[12],the position of the measuring points can be adjusted by the use of a three-dimensional coordinate frame.
2.Experiment method
The water cycling system is started to form different flow states by the regulation of the valve opening,the flux is measured by the flow meter.To ensure the accuracy of the measurement,the LDV should be adjusted in accordance with the requirements of the experiment[12-14].The test section of the pipe is made of transparent plexiglass,its inner diameter is 0.04 m.The LDV is adjusted according to the technical parameters of the three-dimensional coordinates frame,the test area is shown in Fig.2.

Fig.2 Test area
According to the characteristics of the pipe flow,the flow velocity near the pipe wall changes greatly and the velocity decreases from the pipe center to the pipe wall.The measuring points near the wall are arranged densely to reflect the flow characteristics,the inner wall of the pipe is the starting point,on each section the beam intersection point is used as a measuring point and a set of data is obtained.There are 40 nodes in the radial direction and 70 nodes in the axial direction,the entire test area contains 2 800 nodes.A set of samples is chosen in the speed measurement,according to the initial setting of the test system,the average values are taken as the required data.The Reynolds number of the test area is from 2 000 to 8 000.On each test section,400 sets of data are obtained for every Reynolds number.
3.Analysis of test results
3.1 Attenuation characteristics of average axial velocity
The axial velocity distribution varies greatly in different flow areas in the pipe[15,16],the attenuation characteristics have much to do with the flow state.Six flow states in the experiment ( Re = 2 400,3 800,4 800,5 800,6 800,7 800) are selected.
Comparing the velocity of each measuring point with the average velocity in each flow state,it can befound that the proportion of the velocity below the average value is gradually decreased with the increase of the Reynolds number.When Re =2 400,the proportion of the measured velocity below the average speed is 40%,and it becomes 25% when Re =7800,and the flow state tends to be enhanced.The results of the experiment are shown in Table 1.
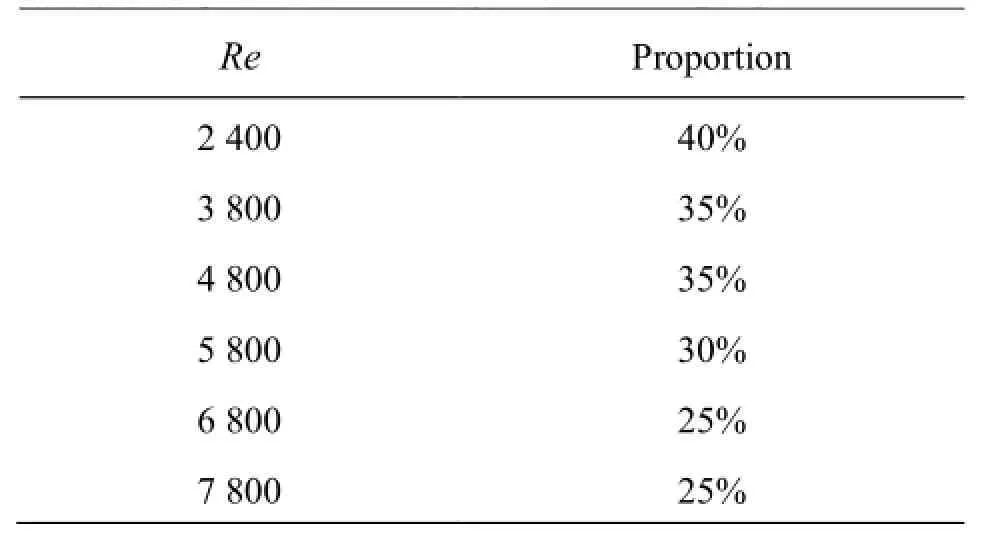
Table 1 Proportion of velocity below average speed
The attenuation characteristics in different flow states are analyzed.Considering the instantaneity and the mutability of the flow field,the radial coordinate is nondimensionalized.

Fig.3 Distributions of the average speed
Figure 3 shows the average velocity distribution along the radial direction.The center of the pipe is used as the starting point of the coordinater and the pipe wall is the end.Comparing the occurrence position of the average speed,it can be seen that the mainstream area is enlarged with the increase of the Reynolds number.In Fig.3,Curve 1 is the occurrence position of the average speed in the radial direction in different flow states,Curve 2 is the positional distribution when the speed is down to the 50 percent of the average velocity.The axial velocity is enhanced with the increase of the Reynolds number; because of the inertia force,the axial velocity at different measuring points shows a trend of overall increase,the occurrence position of the average speed gradually moves towards the pipe wall,reflecting the change of the velocity distribution in the flow field.With the increase of the Reynolds number,the distribution of the points on Curves 1 and 2 has an approximately linear relationship.Comparing Curve 1 with Curve 2,it can be found that the decaying rate at a high Reynolds number is significantly greater than that at a low Reynolds number on the basis of per unit length under different flow conditions,when the average speed declines gradually to its 50% in the radial direction,the attenuation improves greatly with the increase of the Reynolds number,and the decaying rate of the axial velocity in the radial direction has a close relationship with the flow state.
3.2 Analysis of flow changes near the pipe wall
The LDV performs well in the testing area near the pipe wall.The distribution of the flow velocity vector at different Reynolds numbers is shown in Fig.4.With the increase of the Reynolds number,the influence of the inertia force is gradually increased and that of the viscous force is weakened[17],the flow velocity near the pipe wall is increased,the velocity profile develops gradually and becomes full,the shape of the profile boundary changes from parabola to logarithmic curve,the flow state is gradually changed.The change extent of the profile shape is particularly evident near the pipe wall.
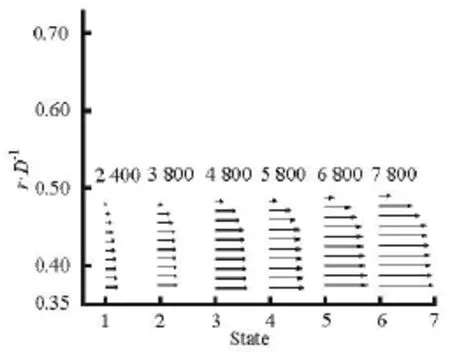
Fig.4 Distributions of the velocity vector near the pipe wall
In order to study the flow characteristics near the pipe wall quantitatively,the axial velocity profile composed of ten continuous measuring points is analyzed numerically and the distribution of the velocity gradient along the radial direction is obtained,from which the effective scope of the flow field can be determined.Based on the work of the Ref.[18],the velocity gradient is dealt with the dimensionless method to reach some general conclusions.The dimensionless uses the following method
where ∆u is the axial velocity change,V is theaverage velocity,∆r is the radius variation,andD is the diameter.The distribution of the dimensionless velocity gradient is shown in Fig.5.
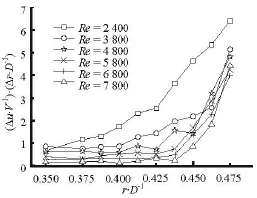
Fig.5 Distributions of the dimensionless velocity gradient
According to the distribution of the dimensionless velocity gradient,in the starting stage of the curve,six curves of the velocity gradient see a certain similarity.With the measuring point being moved from the axis to the pipe wall,the inertial force plays more important role than that of the viscous force at a low Reynolds number,the change of the velocity gradient along the radial direction is significant and has a certain continuity,the curve shows the state of a rapid uplift and the uplift location is far away from the pipe wall.
With the increase of the Reynolds number,the axial velocity is improved,the impact of the inertial force is enhanced and that of the viscous force is reduced.The mixing of the fluid particles is improved.It can be observed in Fig.5 that the similarity of the velocity gradient curve is apparent at a high Reynolds number.With the expansion of the axial velocity boundary,the front of the curve is relatively flat,with characteristics of a sharp improvement in the position close to the pipe wall.
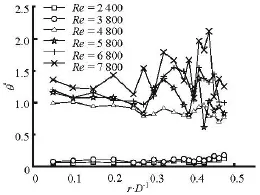
Fig.6 Axial angle distributions of the resultant velocity
3.3 The change of the angle between the resultant velocity vector and the pipe axis
In various sections of the pipe,the flow velocities are in the form of resultant vectors,and the change of the resultant velocity has an important impact on the pipe flow.According to the features of the Doppler velocimetry,the distribution of the resultant velocity on the longitudinal section of the pipe is analyzed.
Figure 6 shows the change of the angle between the resultant velocity vector on the longitudinal section in the pipe and the pipe axis at different Reynolds numbers.At a low Reynolds number,the angle changes but little.The tendency of the curve is relatively stable.Because of the viscous force,the impact of the radial velocity is weakened.Interference between different flow layers is small.
With the increase of the Reynolds number,the axial velocity becomes to play a leading role at the position close to the pipe axis because of the impact of the inertial force,the change of the angle is not significant,when the considered position moves continuously towards the pipe wall along the radial direction,there is a significant increase in the angle with the improvement of the effect of the viscous force,the angle sees a larger fluctuation,the direction of the resultant velocity changes frequently,which causes the interference between different flow layers.The radial velocity is severely affected in the area close to the pipe wall and the angle becomes to show a downward trend.
At a high Reynolds number,the position where the angle changes significantly moves forward obviously,the radial velocity plays a more important role with the reduction of the viscosity force effect,the region of the angle fluctuation is widened and the volatility is also increased.The variation and the frequency of the axial angle are improved and the uncertainty of the flow is enhanced,the disturbance and the mixing between flow layers lead to the change of the flow state.Because of the impact of the pipe wall,the radial velocity is reduced and the angle also shows a downward trend in the area close to the pipe wall.
3.4 The effect of energy coefficient
The kinetic energy is an important parameter to analyze the flow state,and the energy change in the fluid flow can be analyzed as

In Eq.(4),1u,1vand1ware,respectively,the root mean square values of the axial,radial and circumferential velocities,V is the average axial velocity and βis the energy coefficient.
In the experiment,the two-dimensional Doppler velocimetry is used as the testing instrument,and the experimental data contain only the radial and axial velocity components.It is assumed that the pipe flowis isotropic.To analyze the flow state,Eq.(4) can be simplified as
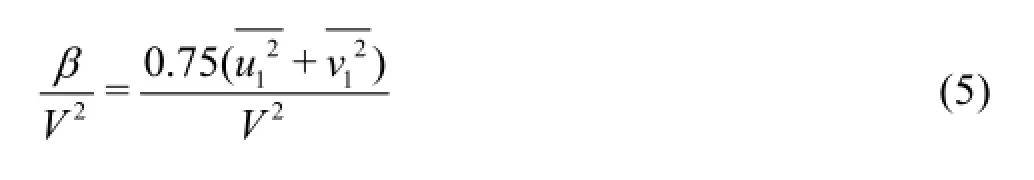
The relationship between the energy coefficient and the change of the flow state in the pipe can be studied according to the change of the energy coefficient.
Figure 7 is the distribution of the energy coefficient in three flow states.With the increase of the Reynolds number,the growth ofβis improved,the kinetic energy coefficient in three flow states can reach the maximum value at the pipe axis,with the radial velocity and the axial velocity increasing rapidly.At a high Reynolds number,there are more peak points of the kinetic energy coefficient on the curves,the change of the energy is more severe,and the randomness and the volatility of the flow are significantly increased.
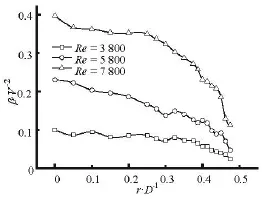
Fig.7 Distributions of the energy coefficients
The curves ofβin the three flowing states see a decrease in the region close to the pipe wall,the greater the Reynolds number,the more obvious the downward trend.At a low Reynolds number,the location where the curves show a downtrend trend is far from the pipe wall.With the increase of the Reynolds number,the curves rapidly decline at locations close to the pipe wall,which reflects the influence of the pipe wall on the velocity field in different flow states,that is,the region near the pipe wall has an inhibitory effect on the flow development.The shape of the curve shows irregular changes,by comparing the coefficient curves at different Reynolds numbers.It is found that the fluctuations of the curve at a high Reynolds number can appear in the whole radial area,which reflects the increase of the energy distribution instability.When moving along the radial direction,the velocity field changes due to the effect of the viscous force which leads to the change of the energy coefficient.
At a small Reynolds number,the acting area and the intensity of the viscous force are enlarged,the energy of the fluid changes slowly,and its kinetic coefficient curve is relatively flat.At a high Reynolds number,one sees the steep rise and drop in the curves,the instability of the flow is more severe.The energy coefficient curves in the three flowing states are in a downward trend,which indicates that the development of the flow in the near wall region is inhibited.In the flow process,the curve fluctuations are not significant near the pipe axis area,the fluctuations of the curves appear mainly in the movement from the pipe axis to the pipe wall.The interaction between the inertia force and the viscous force has a great bearing on the flow state in the flow region,and the distribution of the energy coefficient also sees a significant change.
4.Conclusions
The radial attenuation of the axial velocity is closely related to the flow conditions and the flow area,the attenuation is not significant at the area close to the pipe axis,and at a high Reynolds number,the attenuation is significantly increased near the pipe wall.Due to the intensification of the flow and the expansion of the flow area,the position where the average velocity changes steeply moves toward the pipe wall with the increase of the Reynolds number.
The variation of the velocity gradient can affect the flow state.Under different flow conditions,the tendencies of the velocity gradient curves are similar in the pipe axis region where the inertia force has a strong effect.When the observation point moves gradually to the pipe wall,the changing range of the velocity gradient is larger at a low Reynolds number.At a high Reynolds number,the velocity gradient sees a rapid decline in the area close to the pipe wall.
At a low Reynolds number,the angle between the resultant velocity vector and the pipe axis is small,the interference between different flow layers is weak,the effect of the viscous force is enhanced and the flow has better stability.At a high Reynolds number,the angle between the resultant velocity vector and the pipe axis is increased and sees fluctuations when moving to the pipe wall along the radial direction,the change of the velocity vector angle will increase the uncertainty of the fluid particle motion and promote the change of the flow state.
The energy coefficient can reflect the change of the flowing state,the instability of the flow improves with the increase of the energy coefficient,the trend is proportional to the increase of the Reynolds number,the fluctuation of the energy coefficient is mainly in the region between the pipe axis and the pipe wall.
[1]ARAVINTH S.Prediction of heat and mass transfer forfully developed turbulent fluid flow through pipes[J].International Journal of Heat and Mass Transfer,2000,43(8):1399-1408.
[2]DUGUET Y.,WILLIS A.P.and KERSWELL R.R.Slug genesis in cylindrical pipe flow[J].Journal of Fluid Mechanics,2010,663(11):180-208.
[3]FENG Bin-chun,CUI Gui-xiang and ZHANG Zhao-shun.Experimental study for fully developed turbulent pipe flow[J].Acta Mechanica Sinica,2002,34(2):156-167(in Chinese).
[4]KOEHLER C.,BERAN P.and VANELLA M.et al.Flows produced by the combined oscillatory rotation and translation of a circular cylinder in a quiescent fluid[J].Journal of Fluid Mechanics,2015,764(2):148-170.
[5]LIU You,YANG Xiao-tao and MA Xiu-zhen.Technique of flow field measurement based on laser Doppler velocimetry[J].Laser and Infrared,2012,42(1):18-21(in Chinese).
[6]TIAN Zhong,DENG Jun and FENG Xue-min.Investigation of flow Fields for plug dissipaters by LDV[J].Journal of Sichuan University (Engineering Science Edition),2014,46(4):1-5(in Chinese).
[7]SANTINI M.,SANTINI S.F.and COSSALI G.LDV characterization and visualization of the liquid velocity field underneath an impacting drop in isothermal conditions[J].Experiments in Fluids,2013,54(9):1593-1597.
[8]MOUAZE D.,BELORGEY P.M.Internally mounted laser-Doppler-anemometry system for boundary layer measureme[J].Experiments in Fluids,2001,30(1):111-114.
[9]LIU Yong-hui,DU Guang-sheng and LIU Li-ping et al.Experimental study of velocity distribution in the transition region of pipes[J].Journal of Hydrodynamics,2011,23(5):643-648.
[10]PAN Dong-yuan,WANG Tong and ZHANG Bin et al.PIV measurement on rotating disks flow in cylinder[J].Chinese Journal of Hydrodynamics,2009,24(2):200-206(in Chinese).
[11]TALPOS S.,APOSTOL M.Displaced logarithmic profile of the velocity distribution in the boundary layer of a turbulent flow over an unbounded flat surface[J].Physics Letters A,2015,379(47):3102-3107.
[12]SHEN Xiong.Principle and application of laser doppler testing technique[M].Beijing,China:Tsinghua University Press,2004(in Chinese).
[13]ZHOU Jian.Application of frequency spectrum refinementand correction technology in laser doppler velocimeter[J].Laser and Infrared,2010,40(2):146-151(in Chinese).
[14]WEN Yuan-fan,XIAO Hong-yin.A laser imaging-LDV coupling measurement of single bubble forming and rising in shear-thinning fluid[J].Journal of Thermal Science,2014,23(3):233-238.
[15]ARMAN M.,LYES K.and AFSHIN G.Measurement of fluid velocity development in laminar pipe flow using laser Doppler velocimetry[J].European Journal of Physics,2013,34(5):1127-1134.
[16]FENG Jian-jun,LUO Xing-qi and BENRA Friedrich-Kar et al.Experimental investigation of velocity fluctuations in a radial diffuser pump[J].Journal of Hydrodynamics,2015,27(3):332-339.
[17]SAD CHEMLOUL N.Experimental study of the drag reduction in turbulent pipe flow[J].Energy,2014,64(1):818-827.
[18]LAI Yong-bin,YANG Min-guan and GAO Bo.Experiment on axial circle flow in axially stirred tank[J].Journal of Jiangsu University (Natural Science Edition),2009,30(4):379-382(in Chinese).
10.1016/S1001-6058(16)60633-9
(Received October 23,2015,Revised February 20,2016)
* Project supported by the National Natural Science Foundation of China (Grant No.10972123).
Biography:Jun WANG (1969-),Male,Ph.D.Candidate,Associate professor
Guang-sheng DU,E-mail:du@sdu.edu.cn
2016,28(2):313-318
猜你喜欢
红蜻蜓·低年级(2021年9期)2021-09-22
好孩子画报(2020年5期)2020-06-27
音乐天地(音乐创作版)(2019年10期)2020-01-06
活力(2019年19期)2020-01-06
作文周刊·小学二年级版(2019年32期)2019-10-15
作文周刊·小学二年级版(2019年28期)2019-09-06
中华建设(2019年4期)2019-07-10
水动力学研究与进展 B辑(2018年2期)2018-05-14
水动力学研究与进展 B辑(2014年5期)2014-06-01

- 水动力学研究与进展 B辑的其它文章
- Manoeuvring prediction based on CFD generated derivatives*
- Calculation of tip vortex cavitation flows around three-dimensional hydrofoils and propellers using a nonlinear k -ε turbulence model*
- Hull form optimization of a cargo ship for reduced drag*
- Numerical simulation of self-similar thermal convection from a spinning cone in anisotropic porous medium*
- An axisymmetric model for draft tube flow at partial load*
- An iterative re-weighted least-squares algorithm for the design of active absorbing wavemaker controller*