
2016年1-7月全国商用车市场销售统计图表
2016-11-14 06:09习仲文整理
商用汽车 2016年9期
习仲文 整理
2016年1-7月全国商用车市场销售统计图表
习仲文 整理
Statistical Chart of Sales of Commercial Vehicles across China
This is a statistical chart of sales of commercial vehicles across China from Jan. to Jul. in 2016. All numbers and figures are collected from “News of Sales and Production of China Auto Industry”, and all kinds of commercial vehicles, including trucks,coaches and other segments are included in this chart.
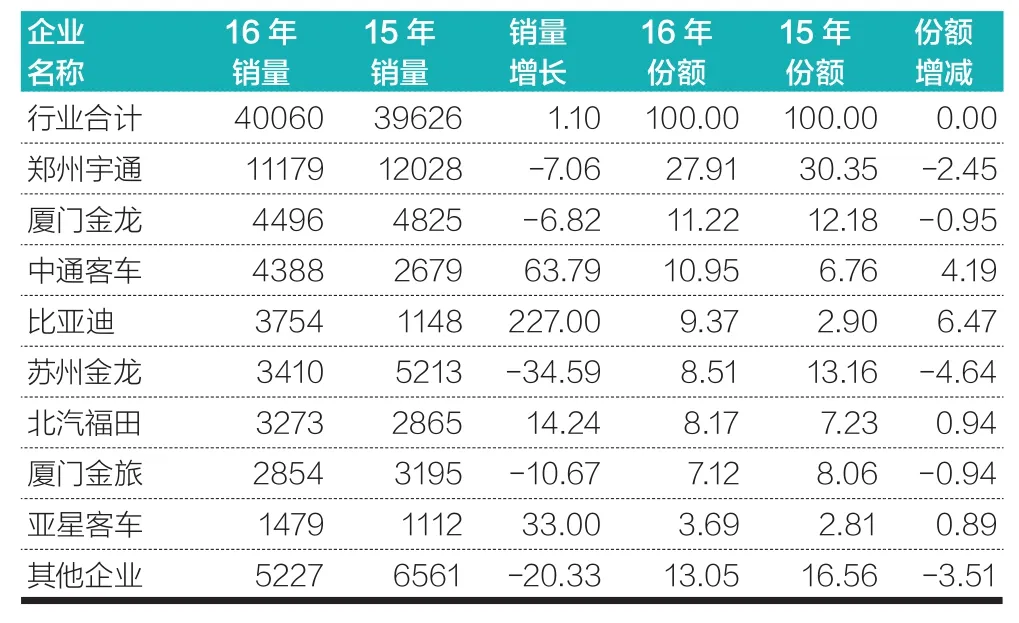
表1 1-7月大客主要生产企业累计销量及市场份额单位:辆,%
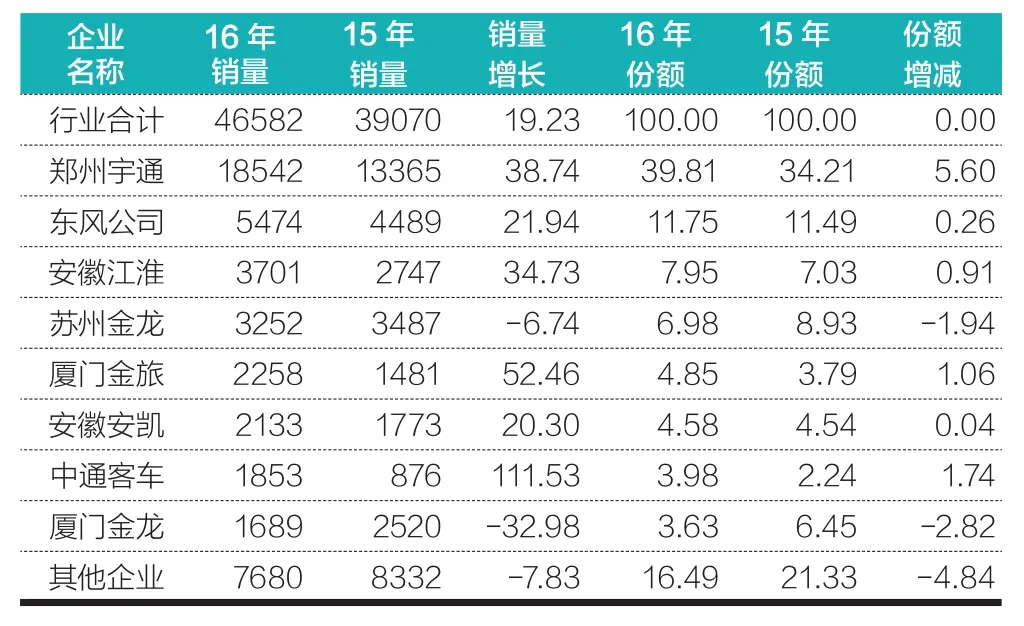
表2 1-7月中客主要生产企业累计销量及市场份额单位:辆,%
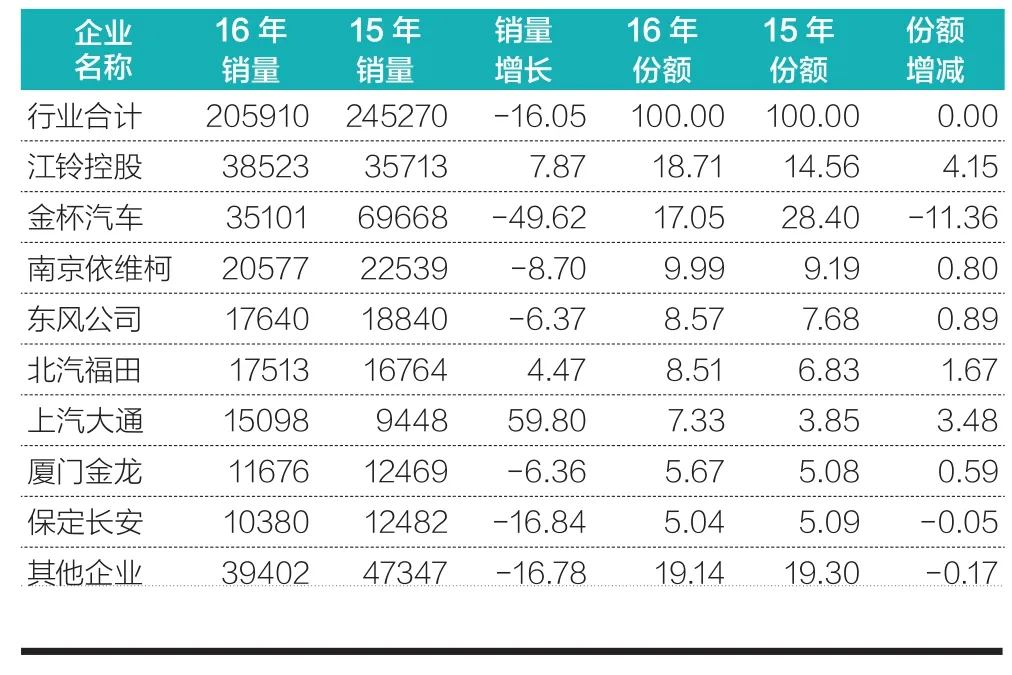
表3 1-7月轻客主要生产企业累计销量及市场份额单位:辆,%
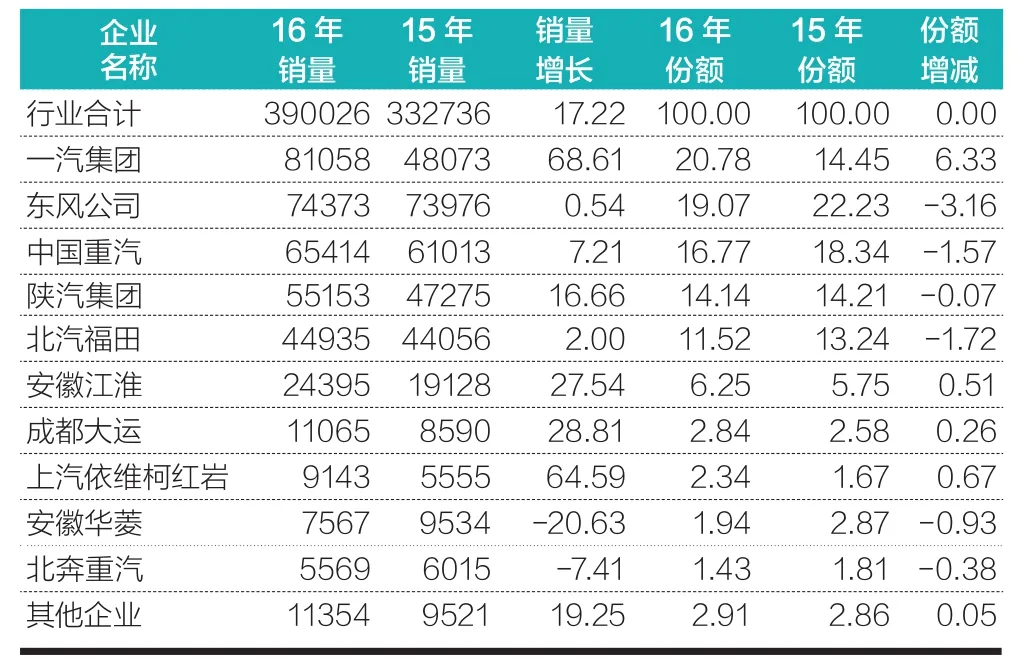
表4 1-7月重卡主要生产企业累计销量及市场份额单位:辆,%
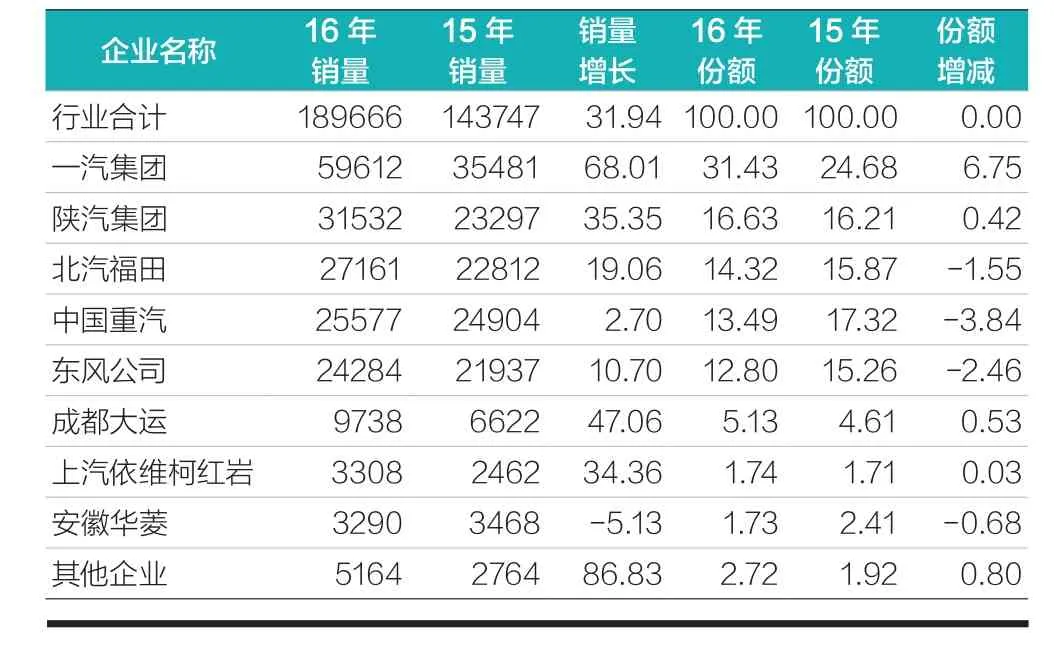
表5 1-7月半挂牵引车主要生产企业累计销量及市场份额单位:辆,%
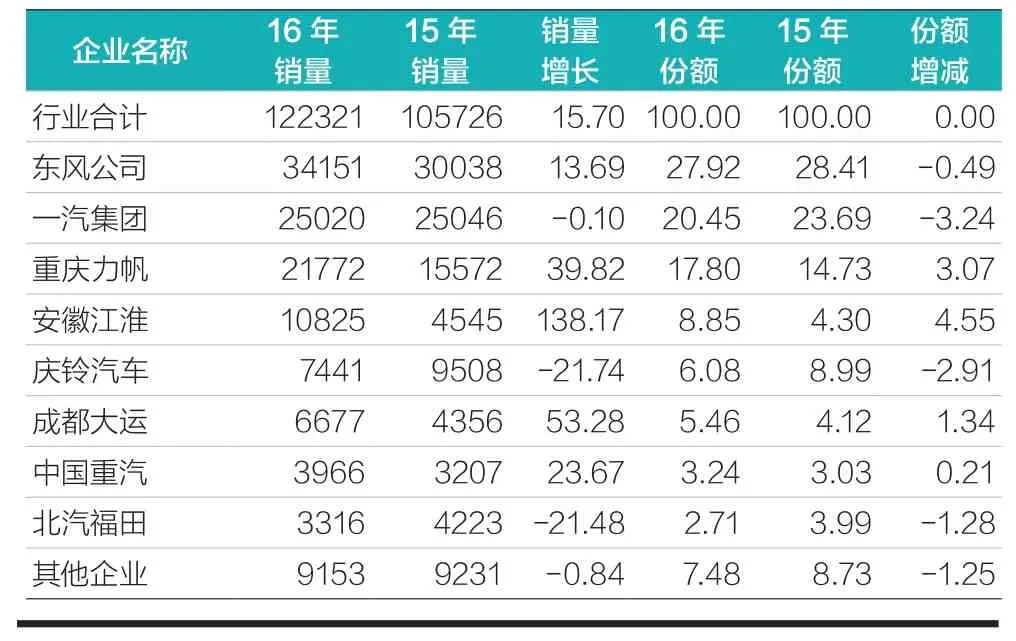
表6 1-7月中卡主要生产企业累计销量及市场份额单位:辆,%
猜你喜欢
汽车实用技术(2022年19期)2022-10-19
汽车实用技术(2022年17期)2022-09-16
商用汽车(2019年6期)2019-09-10
商用汽车(2019年5期)2019-09-10
中国计算机报(2019年22期)2019-07-31
汽车与安全(2019年3期)2019-06-21
汽车与安全(2019年12期)2019-05-14
商用汽车(2018年6期)2018-08-15
商用汽车(2017年1期)2017-07-26
当代县域经济(2017年5期)2017-05-19
