
Connectivity differences between adult male and female patients with attention deficit hyperactivity disorder according to resting-state functional MRI
2016-12-01 12:37BoyongParkHyunjinPark
中国神经再生研究(英文版) 2016年1期
Bo-yong Park, Hyunjin Park
1 Department of Electronic, Electrical and Computer Engineering, Sungkyunkwan University, Suwon, Korea
2 School of Electronic Electrical Engineering, Sungkyunkwan University, Suwon, Korea
3 Center for Neuroscience Imaging Research (CNIR), Institute for Basic Science, Suwon, Korea
RESEARCH ARTICLE
Connectivity differences between adult male and female patients with attention deficit hyperactivity disorder according to resting-state functional MRI
Bo-yong Park1, Hyunjin Park2,3,*
1 Department of Electronic, Electrical and Computer Engineering, Sungkyunkwan University, Suwon, Korea
2 School of Electronic Electrical Engineering, Sungkyunkwan University, Suwon, Korea
3 Center for Neuroscience Imaging Research (CNIR), Institute for Basic Science, Suwon, Korea
Attention deficit hyperactivity disorder (ADHD) is a pervasive psychiatric disorder that affects both children and adults. Adult male and female patients with ADHD are differentially affected, but few studies have explored the differences. The purpose of this study was to quantify differences between adult male and female patients with ADHD based on neuroimaging and connectivity analysis. Resting-state functional magnetic resonance imaging scans were obtained and preprocessed in 82 patients. Group-wise differences between male and female patients were quantified using degree centrality for different brain regions. The medial-, middle-, and inferior-frontal gyrus, superior parietal lobule, precuneus, supramarginal gyrus, superior- and middle-temporal gyrus, middle occipital gyrus, and cuneus were identified as regions with significant group-wise differences. The identified regions were correlated with clinical scores reflecting depression and anxiety and significant correlations were found. Adult ADHD patients exhibit different levels of depression and anxiety depending on sex, and our study provides insight into how changes in brain circuitry might differentially impact male and female ADHD patients.
neural regeneration; connectivity; attention deficit hyperactivity disorder; sex difference; functional magnetic resonance imaging; depression; anxiety; network analysis; degree centrality; diagnostic and statistical manual score
Introduction
Attention deficit hyperactivity disorder (ADHD) is a pervasive psychiatric disorder that affects both children and adults (Schneider et al., 2006; Castellanos and Proal, 2012). The symptoms of ADHD can be grouped into three subtypes: inattentive-, hyperactive/impulsive- and combined-types (American Psychiatric Association, 1994). Males and females are differentially affected by ADHD. Females with ADHD tend to exhibit less hyperactivity and externalizing behaviors and greater levels of depression and anxiety than males with ADHD (Biederman et al., 1994; Gaub and Carlson, 1997).
However, the reason for these sex differences is largely unknown. Many researchers have used neuroimaging techniques to identify the etiology of these differences, including magnetic resonance imaging (MRI), single photon emission computed tomography (SPECT), and positron emission tomography (PET) (Dougherty et al., 1999; Vles et al., 2003; Spencer et al., 2007). Functional MRI (fMRI) measures local brain activity using blood-oxygen-level-dependent (BOLD) contrast, which was used in this study to assess brain activations related to ADHD and other psychiatric diseases such as Parkinson’s disease (Booth et al., 2005; Cortese et al., 2012; Mallio et al., 2015). These neuroimaging data are typically processed using various software algorithms implemented in pre-processing pipeline packages (Fischl, 2012; Jenkinson et al., 2012). Results of applying these packages identify regions that reflect group-wise differences between disease and control groups. Another type of algorithm, connectivity analysis, focuses on how activities in one region correlate with activities in another region (Anwander et al., 2007; He et al., 2007; Bullmore and Sporns, 2009). Connectivity analysis allows for observation of the whole brain as a complex interconnected network and is thus well-suited for ADHD research (Schneider et al., 2006; Wang et al., 2009). Connectivity analysis typically requires regions of interest (ROIs) which might be specified by co-registering and then transferring structural or functional information from a predefined parcellation of the brain (Tzourio-Mazoyer et al., 2002; Craddock et al., 2012).
Connectivity measures can be used to quantify groupwise differences and as biomarkers for important clinical variables in ADHD research. Many studies have successfully established group-wise differences between children with ADHD and normal controls based on neuroimaging (Konrad et al., 2006; Fair et al., 2010). Less attention has been given to adult ADHD patients despite a large population suffering from this disorder (Faraone and Biederman, 2005). Adultmale and female patients with ADHD are differentially affected by the disease (Biederman et al., 1994), but very few studies have attempted to quantify sex differences. Thus, the focus of this study was to quantify differences between adult male and female patients with ADHD based on neuroimaging data.
Materials and Methods
Subjects and imaging data
Data used in this study were obtained from the human connectome project (HCP) database (http://www.humanconnectome.org/) (Van Essen et al., 2013). Eleven institutions that participated in the database and the institutional review board (IRB) at all participating institutions approved the study and written consent was obtained from all participants. Data were anonymized before being uploaded to the database. We used resting-state fMRI data from the HCP database. The database primarily consists of normal subjects but it does include ADHD subjects as well. The following imaging parameters were used on a Skyra 3T scanner (Siemens Healthcare, Malvern, PA, USA) housed at Washington University in St. Louis: image matrix = 104 × 90; pixel resolution = 2.0 mm isotropic; slice thickness = 2.0 mm; repetition time (TR) = 720 ms; echo time (TE) = 33 ms; number of TRs = 1,200; and field of view (FOV) = 180 mm. Unlike conventional fMRI data, HCP fMRI data contain two distinct phases that encode the directions “leftto-right” and “right-to-left.” We concatenated both data sets into a long sequence and considered it as time series data. A total of 82 participants were divided into ADHD (n = 41) and normal (n = 41) groups. ADHD subjects were classified using diagnostic and statistical manual (DSM) combined, inattention, and hyperactivity scores (American Psychiatric Association, 1994). The ADHD group consisted of male (n = 24) and female (n = 17) ADHD groups. The sex ratio of the male and female ADHD groups was similar to the naturally occurring sex ratio in the adult ADHD population (Simon et al., 2009). Subjects in the ADHD group suffered from inattentive-type (n = 13), hyperactive/impulsive-type (n = 4), and combined-type (n = 24) ADHD. Subjects in the male ADHD group consisted of 6 inattentive-type, 2 hyperactive/ impulsive-type, and 16 combined-type cases. Subjects in the female ADHD group consisted of 7 inattentive-type, 2 hyperactive/impulsive-type, and 8 combined-type cases. There were no significant differences (P > 0.05) between groups in terms of age or sex ratios (Table 1). The normal group consisted of male (n = 17) and female (n = 24) normal groups. There were no significant differences in age and DSM scores between male and female subjects within ADHD and normal groups. DSM scores between ADHD and normal groups showed significant differences (P < 0.05), and age and sex ratio did not show significant differences (Table 1). Head motion might produce false variance to the real time series that is similar to the real time series of a nearby voxel, and thus correlation between two different regions might be increased (Power et al., 2014). The HCP team performed the quality check of the imaging data so that data with excessive head movement were excluded (Van Essen et al., 2013).
Image preprocessing
The HCP database provided preprocessed fMRI data, accounting for many commonly performed spatial preprocessing steps (Jenkinson et al., 2002; Glasser and Van Essen, 2011; Van Essen et al., 2012; Glasser et al., 2013). Using this preprocessed data also removed potential errors and biases derived from the preprocessing procedures. The following preprocessing steps were performed using FreeSurfer (Martinos Center for Biomedical Imaging located at Charlestown, Massachusetts, USA) and FSL software (Oxford Centre for Functional MRI of the Brain, Oxford, UK) (Fischl, 2012; Jenkinson et al., 2012). Distortion due to gradient field non-linearity was corrected using the gradient_nonlin_ unwarp software package in FreeSurfer. Head motion was corrected by registering the time series data onto the single band reference image acquired at the beginning of data acquisition with six-degree of freedom (DOF) rigid body transformation using FSL’s FLIRT. Then, time series images were registered onto T1-weighted structural image, first using DOF FLIRT with a boundary-based registration (BBR) cost function, and then using FreeSurfer’s BBRegister for fine tuning. The co-registered images were nonlinearly registered onto the standard Montreal Neurological Institute (MNI) space. Intensity normalization of the 4D dataset was applied with a whole brain mean of 10,000. Brain extraction was performed by overlaying the MNI atlas brain mask onto the individual subject’s space. Then, temporal preprocessing was performed using AFNI software (Medical College of Wisconsin, Wisconsin, USA (Cox, 1996). Nuisance variables including six rigid motion parameters, white matter contribution, and cerebrospinal fluid contribution were regressed out using 3dDeconvolve package (a part of AFNI software), and a band-pass filter ranging between 0.009 and 0.08 Hz was applied to remove the slow drift in the data using 3dFourier package (a part of AFNI software).
Network construction using graph theory
Connectivity analysis requires identification of specific ROIs in order to investigate the correlations among them. We transferred predefined parcellations results onto the subject’s image via image co-registration (Craddock et al., 2012). This was possible as co-registration process spatially maps the parcellation information onto the intended image and both reside on the same spatial framework. Spatially constrained spectral clustering was applied to the fMRI data from 82 participants and extracted 292 ROIs across the whole brain (Craddock et al., 2012). Given a set of ROIs within the brain, connectivity was assessed using nodes and edges of a graph (He et al., 2007; Stam and Reijneveld, 2007; Bullmore and Sporns, 2009). Nodes were assigned ROIs that were transferred from the predefined parcellation. Each edge value was assumed to represent the correlation between two ROIs, which was entered into the matrix as an element. The matrix was referred to as the correlation matrix. We adopted a simple network model considering undirected and unweighted edges. The correlation matrix was converted into a binarymatrix using a fixed density threshold method, which assures that the network graphs being compared have the same number of edges. The raw correlation matrices were z-transformed using Fisher’s r-to-z transformation and then a wide range of density thresholds (between 2% and 50%) were applied to the z-transformed correlation matrices. Density was the threshold applied to the correlation matrix. Network construction and connectivity analysis were performed using MATLAB (Mathworks Inc., Natick, MA, USA).

Table 1 Demographic data of ADHD patients and normal controls

Table 2 Regions that showed significant differences in degree centrality and betweenness centrality values between male and female ADHD patients (corrected P value)

Table 3 Correlations between degree values and DSM scores for the chosen brain regions

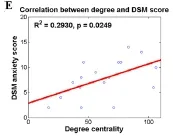
Figure 2 Correlations between degree values and DSM scores for various brain regions.

Figure 1 Brain regions showing significant differences between male and female ADHD patients.
Connectivity analysis
Degree centrality and betweenness centrality are local parameters used to describe the brain network and can be calculated for each brain region in order to quantify the importance of a given node in terms of network organization. Degree is the number of edges connected to a node, which quantifies the information able to pass through that particular node. Betweenness centrality is the number of shortest paths between any two nodes that run through that node, which represents the information flow of a given node (Rubinov and Sporns, 2010). A node with high degree centrality or betweenness centrality values is regarded as a hub node which plays an important role in overall network organization (Zhu et al., 2012; Xia et al., 2014). The degree was computed at the minimum density at which all ROIs are connected (Seo et al., 2013). Brain regions showing significant group-wise differences between males and females were quantified using degree centrality and betweenness centrality for both the ADHD and normal groups. If brain regions were identified both in the ADHD and normal groups, they were excluded from further analysis as they were considered as differences stemming from general sex differences. We only considered brain regions with significant sex differences unique to the ADHD group.
Correlation with DSM score
DSM depression and anxiety scores were measured by self-report (American Psychiatric Association, 1994). The correlation of degree values of identified brain regions with DSM depression and anxiety scores in male and female ADHD groups was analyzed to determine if the identified connectivity measures were consistent with known traits of adult male and female ADHD subjects. Degree centrality was used for the correlation with DSM scores. We applied a linear regression model using degree value as the predictor variable and DSM score as the dependent variable. The general form of the linear regression model was as follows: DSM = α + β · degree, where α was a constant and β was the estimated coefficient. The significance of the correlation of DSM score with degree was quantified with R-squared value and P-value statistics. Brain regions showing significant correlation were identified.
Statistical analysis
We constructed correlation matrices using 292 ROIs for each participant. The multiple comparison issue occurred when identifying group-wise differences unique to distinguishing between male and female ADHD subjects. It was corrected using permutation tests (Smith et al., 2013b). Permutation tests were performed by randomly assigning male and female subjects within ADHD and normal groups respectively 10,000 times. Differences in degree centrality and betweenness centrality values were deemed significant if it did not belong to the 95% of the null distribution derived from the permutation tests (P < 0.05, corrected). The significance of the linear regression between DSM score and degree wasassessed with R-squared and P-values. All statistical analyses were performed using MATLAB (Mathworks Inc.).
Results
Differences in connectivity
Brain regions with significant (P < 0.05, corrected) sex differences in degree centrality and betweenness centrality values unique to the ADHD group were identified (Table 2). Significant brain regions using degree centrality values are shown in Figure 1. The primary brain network associated with ADHD is the cingulo-fronto-parietal (CFP) network, which regulates the attention system (Schneider et al., 2006; Bush, 2010; Hoekzema et al., 2014). CFP network consists of dorsolateral-, and ventrolateral-prefrontal cortex, cingulate cortex, and parietal cortex (Bush, 2010). Our analysis identified the medial-, middle-, and inferior-frontal gyrus (Brodmann areas 9, 10, 44, 45, and 46), superior parietal lobule, precuneus, and supramarginal gyrus using degree centrality. We identified medial- and inferior-frontal gyrus, posterior cingulate cortex, supramarginal gyrus, and paracentral lobule using betweenness centrality. Several ADHD studies have reported the temporal cortex and occipital cortex to be regions affected by ADHD since they are partly responsible for attention processing (Schneider et al., 2006; Oldehinkel et al., 2013). We identified middle temporal gyrus, middle occipital gyrus, and cuneus as significant regions using degree centrality. We identified superior- and middle-temporal gyrus, middle occipital gyrus, and lingual gyrus using betweenness centrality. The identified regions were slightly different between degree centrality and betweenness centrality. Some regions were identified in both sets of analyses. Common regions were right inferior frontal gyrus, right supramarginal gyrus, right superior temporal gyrus, left middle temporal gyrus, and bilateral middle occipital gyrus.
Correlation between degree value and DSM score
We identified several regions in which the male and female ADHD patients could be distinguished based on degree value. We further investigated whether degree values of those regions were correlated with DSM scores for depression and anxiety in order to determine if the connectivity measures could be extended to explain depression and anxiety. Depression and anxiety were investigated as they are key symptoms that differ between adult male and female ADHD patients (Biederman et al., 1994; Gaub and Carlson, 1997). Correlations between degree values and DSM scores are shown in Table 3. Brain regions that showed significant correlation with DSM scores are shown in Figure 1. The correlation between degree values of the left middle frontal gyrus, left superior parietal gyrus, left middle temporal gyrus, and right middle occipital gyrus and DSM depression score showed a significance only in the female ADHD group but not in the male counterpart (R2= 0.5590 and P < 0.001; R2= 0.2860 and P = 0.0270; R2= 0.2600 and P = 0.0364; R2= 0.3000 and P = 0.0229, respectively). Similarly, the correlation between degree values of the left middle temporal gyrus and DSM anxiety score showed a significance only in the female ADHD group (R2= 0.2930 and P = 0.0249). Analyses of significant correlation results are shown in Figure 2.
Discussion
We obtained resting-state fMRI data from a research database, the human connectome project (HCP) (Van Essen et al., 2013). Connectivity analysis was utilized to investigate differences between male and female ADHD patients. Group-wise differences between males and females were quantified using a connectivity parameter, degree centrality. As a brief summary of the findings, we identified significant group-wise differences in degree centrality values for certain brain regions between male and female patients with ADHD and found significant correlations between degree centrality values of identified regions and DSM depression and anxiety scores.
Eleven regions using degree centrality values and thirteen regions using betweenness centrality values showing significant ADHD sex differences were identified in the present study. These results might be interpreted as different levels of functional connections in the identified regions of male and female ADHD patients. Using degree centrality values, we identified the medial-, middle-, and inferior-frontal gyrus, superior parietal lobule, precuneus, and supramarginal gyrus as a significant region. The frontal and parietal cortices are important regions in ADHD patients as they regulate attention systems (Schneider et al., 2006; Bush, 2010; Hoekzema et al., 2014). We additionally identified superior- and middle-temporal gyrus, middle occipital, and cuneus. These regions are parts of temporal and occipital cortices that are partly responsible for attention processing (Schneider et al., 2006; Oldehinkel et al., 2013). The regions we identified corroborated existing ADHD research (Schneider et al., 2006; Bush, 2010; Hoekzema et al., 2014). We adopted additional connectivity metric, betweenness centrality and re-performed the analysis. The identified regions were slightly different between degree centrality and betweenness centrality. Some regions were identified in both sets of analyses. Common regions were right inferior frontal gyrus, right supramarginal gyrus, right superior temporal gyrus, left middle temporal gyrus, and bilateral middle occipital gyrus. There is no consensus as to what connectivity metric is best for investigating various neurodegenerative diseases. Further research regarding what connectivity metric to use is left for future work.
Our study identified several regions linked with depression and anxiety to be useful for distinguishing between adult male and female ADHD patients. We identified middle frontal gyrus, superior parietal lobule, middle temporal gyrus, and middle occipital gyrus as regions that showed differences between sex and strong correlation with DSM scores only in the female ADHD group. Frontal gyrus and parietal lobule are known to play a critical role in attention processing (Wolpert et al., 1998; Behrmann et al., 2004; Japee et al., 2015). Temporal gyrus function as language and memory processing, and occipital gyrus function as object recognition (Grill-Spector et al., 2001; Onitsuka et al., 2004). These regions are partly associated with personal moodsuch as depression and anxiety (Engels et al., 2010; Waugh et al., 2012; Foland-Ross et al., 2013; Pannekoek et al., 2015). Female ADHD subjects are known to be more susceptible to depression and anxiety than male ADHD subjects (Biederman et al., 1994; Gaub and Carlson, 1997). Thus, the regions that showed differences between sex and strong correlation with DSM scores could be the regions that are specific to female ADHD subjects. The identified regions and the associated connectivity measures might be used as image biomarkers for further research exploring ADHD sex differences.
Males and females are differentially affected by ADHD. Male ADHD patients often show externalizing behaviors such as hyperactivity or impulsivity, while female ADHD patients often show internalizing behaviors such as depression or anxiety (Berry et al., 1985; Biederman et al., 2002). Such symptoms are related to brain dysfunction, and we adopted fMRI that could assess brain functions non-invasively. Using fMRI to distinguish between male and female ADHD patients could provide complementary information besides conventional ADHD assessment based on DSM.
ADHD is grouped into three subtypes; inattentive-, hyperactive/impulsive-, and combined-type based on the DSM criteria. Inattentive-type ADHD patients predominantly show inattention behaviors, hyperactive/impulsive-type ADHD patients show hyperactive and impulsive behaviors, and combined-type ADHD patients show both inattention and hyperactive/impulsive behaviors. Each subtype shows different behavior patterns (Barnard et al., 2010). Inattentive-type ADHD patients are easily distracted and have a difficult time focusing on a given task. Hyperactive/impulsive-type ADHD patients usually intrude on others. Combined-type ADHD patients show all symptoms of inattentive- and hyperactive/ impulsive-type ADHD patients. We did not consider ADHD subtypes in this study as the main focus was to characterize the differences between male and female ADHD patients. Characterizing differences among ADHD subtypes with connectivity analysis is an important research topic we want to pursue in future studies.
ADHD is typically diagnosed based on psychological questionnaires and physician’s assessments. Our study characterized ADHD sex differences using quantitative measures (i.e., brain connectivity). Brain connectivity is an important factor in neural regeneration and this study adopted brain connectivity to quantify ADHD sex differences.
Our study has several limitations. First, we applied a bandpass filter ranging from 0.009 to 0.08 Hz to the time-series data. Some researchers argue that meaningful time-series signal exists at frequencies over 0.2 Hz (Smith et al., 2013a). These frequency components increase the noise allowed into the preprocessing steps and thus negatively affect the groupwise comparison results. We intend to explore alternative approaches to include these frequency components in future studies. Second, our study did not employ multi-modal approaches. Brain networks can be assessed not only using fMRI, but also other imaging modalities including diffusion tensor imaging (Makris et al., 2008). Multi-modal analysis of the brain network allows incorporation of complementary information derived from different modalities in order to better quantify differences between male and female ADHD patients. Third, we did not consider onset age and duration of disease. Factors such as onset age and duration of disease affect brain connectivity and thus it is desirable to include them in the analyses. Unfortunately, we obtained fMRI data from HCP database, which lacked such information. Finally, using fMRI to assess brain activity and connectivity has merits such as being non-invasive, but fMRI suffers from limitations including issue of temporal resolution.
Acknowledgments: Data were provided in part by the Human Connectome Project, WU-Minn Consortium (Principal Investigators∶ David Van Essen and Kamil Ugurbil; 1U54MH091657) funded by the 16 NIH Institutes and Centers that support the NIH Blueprint for Neuroscience Research; and by the McDonnel Center for Systems Neuroscience at Washington University.
Author contributions: BYP performed data analysis and wrote the paper. HP was the guarantor of this work, had full access to all the data in the study, and took responsibility for the integrity of the data and the accuracy of data analysis. Both of these two authors approved the final version of this paper.
Conflicts of interest: None declared.
Plagiarism check: This paper was screened twice using Cross-Check to verify originality before publication.
Peer review: This paper was double-blinded and stringently reviewed by international expert reviewers.
American Psychiatric Association (1994) Diagnostic and Statistical Manual of Mental Disorders, 4thed. Washington, DC: American Psychiatric Press.
Anwander A, Tittgemeyer M, von Cramon DY, Friederici AD, Knösche TR (2007) Connectivity-based parcellation of Broca’s area. Cereb Cortex 17:816-825.
Barnard L, Stevens T, To YM, Lan WY, Mulsow M (2010) The importance of ADHD subtype classification for educational applications of DSM-V. J Atten Disord 13:573-583.
Behrmann M, Geng JJ, Shomstein S (2004) Parietal cortex and attention. Curr Opin Neurobiol 14:212-217.
Berry CA, Shaywitz SE, Shaywitz BA (1985) Girls with attention deficit disorder: a silent minority? A report on behavioral and cognitive characteristics. Pediatrics 76:801-809.
Biederman J, Faraone SV, Spencer T, Wilens T, Mick E, Lapey KA (1994) Gender differences in a sample of adults with attention deficit hyperactivity disorder. Psychiatry Res 53:13-29.
Biederman J, Mick E, Faraone SV, Braaten E, Doyle A, Spencer T, Wilens TE, Frazier E, Johnson MA (2002) Influence of gender on attention deficit hyperactivity disorder in children referred to a psychiatric clinic. Am J Psychiatry 159:36-42.
Booth JR, Burman DD, Meyer JR, Lei Z, Trommer BL, Davenport ND, Li W, Parrish TB, Gitelman DR, Mesulam MM (2005) Larger deficits in brain networks for response inhibition than for visual selective attention in attention deficit hyperactivity disorder (ADHD). J Child Psychol Psychiatry 46:94-111.
Bullmore E, Sporns O (2009) Complex brain networks: graph theoretical analysis of structural and functional systems. Neuroscience 10:186-198.
Bush G (2010) Attention-deficit/hyperactivity disorder and attention networks. Neuropsychopharmacology 35:278-300.
Castellanos FX, Proal E (2012) Large-scale brain systems in ADHD: beyond the prefrontal-striatal model. Trends Cogn Sci 16:17-26.
Cortese S, Kelly C, Chabernaud C, Proal E, Martino A Di, Milham MP, Castellanos FX (2012) Toward systems neuroscience of ADHD: a meta-analysis of 55 fMRI studies. Am J Psychiatry 169:1038-1055.
Cox RW (1996) AFNI: software for analysis and visualization of functional magnetic resonance neuroimages. Comput Biomed Res 29:162-173.
Craddock RC, James GA, Holtzheimer PE, Hu XP, Mayberg HS (2012) A whole brain fMRI atlas generated via spatially constrained spectral clustering. Hum Brain Mapp 33:1914-1928.
Dougherty DD, Bonab AA, Spencer TJ, Rauch SL, Madras BK, Fischman AJ (1999) Dopamine transporter density in patients with attention deficit hyperactivity disorder The phantom of progressive dementia in epilepsy. Lancet 354:2132-2133.
Engels AS, Heller W, Spielberg JM, Warren SL, Sutton BP, Banich MT, Miller GA (2010) Co-occurring anxiety influences patterns of brain activity in depression. Cogn Affect Behav Neurosci 10:141-156.
Fair DA, Posner J, Nagel BJ, Bathula D, Dias TG, Mills KL, Blythe MS, Giwa A, Schmitt CF, Nigg JT (2010) Atypical default network connectivity in youth with attention-deficit/hyperactivity disorder. Biol Psychiatry 68:1084-1091.
Faraone S V, Biederman J (2005) What is the prevalence of adult ADHD? Results of a population screen of 966 adults. J Atten Disord 9:384-391.
Fischl B (2012) FreeSurfer. Neuroimage 62:774-781.
Foland-Ross LC, Hamilton JP, Joormann J, Berman MG, Jonides J, Gotlib IH (2013) The neural basis of difficulties disengaging from negative irrelevant material in major depression. Psychol Sci 24:334-344.
Gaub M, Carlson CL (1997) Gender differences in ADHD: a meta-analysis and critical review. J Am Acad Child Adolesc Psychiatry 36:1036-1045.
Glasser MF, Van Essen DC (2011) Mapping human cortical areas in vivo based on myelin content as revealed by T1- and T2-weighted MRI. J Neurosci 31:11597-11616.
Glasser MF, Sotiropoulos SN, Wilson JA, Coalson TS, Fischl B, Andersson JL, Xu J, Jbabdi S, Webster M, Polimeni JR, Van Essen DC, Jenkinson M (2013) The minimal preprocessing pipelines for the Human Connectome Project. Neuroimage 80:105-124.
Grill-Spector K, Kourtzi Z, Kanwisher N (2001) The lateral occipital complex and its role in object recognition. Vision Res 41:1409-1422.
He Y, Chen ZJ, Evans AC (2007) Small-world anatomical networks in the human brain revealed by cortical thickness from MRI. Cereb cortex 17:2407-2419.
Hoekzema E, Carmona S, Ramos-Quiroga JA, Richarte Fernández V, Bosch R, Soliva JC, Rovira M, Bulbena A, Tobeña A, Casas M, Vilarroya O (2014) An independent components and functional connectivity analysis of resting state fMRI data points to neural network dysregulation in adult ADHD. Hum Brain Mapp 35:1261-1272.
Japee S, Holiday K, Satyshur MD, Mukai I, Ungerleider LG (2015) A role of right middle frontal gyrus in reorienting of attention: a case study. Front Syst Neurosci 9:1-16.
Jenkinson M, Bannister P, Brady M, Smith S (2002) Improved optimization for the robust and accurate linear registration and motion correction of brain images. Neuroimage 17:825-841.
Jenkinson M, Beckmann CF, Behrens TE, Woolrich MW, Smith SM (2012) Fsl. Neuroimage 62:782-790.
Konrad K, Neufang S, Hanisch C, Fink GR, Herpertz-Dahlmann B (2006) Dysfunctional attentional networks in children with attention deficit/ hyperactivity disorder: evidence from an event-related functional magnetic resonance imaging study. Biol Psychiatry 59:643-651.
Makris N, Buka SL, Biederman J, Papadimitriou GM, Hodge SM, Valera EM, Brown AB, Bush G, Monuteaux MC, Caviness VS, Kennedy DN, Seidman LJ (2008) Attention and executive systems abnormalities in adults with childhood ADHD: A DT-MRI study of connections. Cereb Cortex 18:1210-1220.
Mallio C, Zobel B, Quattrocchi C (2015) Evaluating rehabilitation interventions in Parkinson’s disease with functional MRI: a promising neuroprotective strategy. Neural Regen Res 10:702-703.
Oldehinkel M, Francx W, Beckmann CF, Buitelaar JK, Mennes M (2013) Resting state FMRI research in child psychiatric disorders. Eur Child Adolesc Psychiatry 22:757-770.
Onitsuka T, Shenton ME, Salisbury DF, Dickey CC, Kasai K, Toner SK, Frumin M, Kikinis R, Jolesz F a, McCarley RW (2004) Middle and inferior temporal gyrus gray matter volume abnormalities in chronic schizophrenia: an MRI study. Am J Psychiatry 161:1603-1611.
Pannekoek JN, van der Werff SJ, van Tol MJ, Veltman DJ, Aleman A, Zitman FG, Rombouts SA, van der Wee NJ (2015) Investigating distinct and common abnormalities of resting-state functional connectivity in depression, anxiety, and their comorbid states. Eur Neuropsychopharmacol 25:1933-1942.
Power JD, Mitra A, Laumann TO, Snyder AZ, Schlaggar BL, Petersen SE (2014) Methods to detect, characterize, and remove motion artifact in resting state fMRI. Neuroimage 84:320-341.
Rubinov M, Sporns O (2010) Complex network measures of brain connectivity: uses and interpretations. Neuroimage 52:1059-1069.
Schneider M, Retz W, Coogan A, Thome J, Rösler M (2006) Anatomical and functional brain imaging in adult attention-deficit/hyperactivity disorder (ADHD)--a neurological view. Eur Arch Psychiatry Clin Neurosci 256 Suppl:i32-41.
Seo EH, Lee DY, Lee JM, Park JS, Sohn BK, Lee DS, Choe YM, Woo JI (2013) Whole-brain functional networks in cognitively normal, mild cognitive impairment, and Alzheimer’s disease. PLoS One 8:e53922.
Simon V, Czobor P, Bálint S, Mészáros A, Bitter I (2009) Prevalence and correlates of adult attention-deficit hyperactivity disorder: meta-analysis. Br J psychiatry 194:204-211.
Smith SM, Beckmann CF, Andersson J, Auerbach EJ, Bijsterbosch J, Douaud G, Duff E, Feinberg DA, Griffanti L, Harms MP, Kelly M, Laumann T, Miller KL, Moeller S, Petersen S, Power J, Salimi-Khorshidi G, Snyder AZ, Vu AT, Woolrich MW, et al. (2013a) Resting-state fMRI in the Human Connectome Project. Neuroimage 80:144-168.
Smith SM, Vidaurre D, Beckmann CF, Glasser MF, Jenkinson M, Miller KL, Nichols TE, Robinson EC, Salimi-Khorshidi G, Woolrich MW, Barch DM, Uğurbil K, Van Essen DC (2013b) Functional connectomics from resting-state fMRI. Trends Cogn Sci 17:666-682.
Spencer TJ, Biederman J, Madras BK, Dougherty DD, Bonab AA, Livni E, Meltzer PC, Martin J, Rauch S, Fischman AJ (2007) Further evidence of dopamine transporter dysregulation in ADHD: a controlled PET imaging study using altropane. Biol Psychiatry 62:1059-1061.
Stam CJ, Reijneveld JC (2007) Graph theoretical analysis of complex networks in the brain. Nonlinear Biomed Phys 1:1-19.
Tzourio-Mazoyer N, Landeau B, Papathanassiou D, Crivello F, Etard O, Delcroix N, Mazoyer B, Joliot M (2002) Automated anatomical labeling of activations in SPM using a macroscopic anatomical parcellation of the MNI MRI single-subject brain. Neuroimage 15:273-289.
Van Essen DC, Glasser MF, Dierker DL, Harwell J, Coalson T (2012) Parcellations and hemispheric asymmetries of human cerebral cortex analyzed on surface-based atlases. Cereb Cortex 22:2241-2262.
Van Essen DC, Smith SM, Barch DM, Behrens TEJ, Yacoub E, Ugurbil K (2013) The WU-Minn Human Connectome Project: an overview. Neuroimage 80:62-79.
Vles JS, Feron FJ, Hendriksen JG, Jolles J, van Kroonenburgh MJ, Weber WE (2003) Methylphenidate down-regulates the dopamine receptor and transporter system in children with attention deficit hyperkinetic disorder (ADHD). Neuropediatrics 34:77-80.
Wang L, Zhu C, He Y, Zang Y, Cao Q, Zhang H, Zhong Q, Wang Y (2009) Altered small-world brain functional networks in children with attention-deficit/hyperactivity disorder. Hum Brain Mapp 30:638-649. Waugh CE, Hamilton JP, Chen MC, Joormann J, Gotlib IH (2012) Neural temporal dynamics of stress in comorbid major depressive disorder and social anxiety disorder. Biol Mood Anxiety Disord 2:11.
Wolpert DM, Goodbody SJ, Husain M (1998) Maintaining internal representations: the role of the human superior parietal lobe. Nat Neurosci 1:529-533.
Xia S, Foxe JJ, Sroubek AE, Branch C, Li X (2014) Topological organization of the “small-world” visual attention network in children with attention deficit/hyperactivity disorder (ADHD). Front Hum Neurosci 8:1-14.
Zhu W, Wen W, He Y, Xia A, Anstey KJ, Sachdev P (2012) Changing topological patterns in normal aging using large-scale structural networks. Neurobiol Aging 33:899-913.
Copyedited by Mallio CA, Mutoh R, Yao XF, Li CH, Song LP, Zhao M
10.4103/1673-5374.175056
How to cite this article: Park BY, Park H (2016) Connectivity differences between adult male and female patients with attention deficit hyperactivity disorder according to resting-state functional MRI. Neural Regen Res 11(1)∶119-125.
Funding: This study was supported in part by the Institute for Basic Science (to HP), No. IBS-R015-D1.
*Correspondence to: Hyunjin Park, Ph.D., hyunjinp@skku.edu.
orcid: 0000-0001-5681-8918 (Hyunjin Park)
http://www.nrronline.org/
Accepted: 2015-12-20
- 中国神经再生研究(英文版)的其它文章
- Direct reprogramming of somatic cells into neural stem cells or neurons for neurological disorders
- Vascular endothelial growth factor: an attractive target in the treatment of hypoxic/ischemic brain injury
- Glucocorticoids and nervous system plasticity
- RhoA/Rho kinase in spinal cord injury
- The potential of neural transplantation for brain repair and regeneration following traumatic brain injury
- Letter from the Editors-in-Chief