
A pilot longitudinal study on cerebrospinal fluid (CSF) tau protein in Alzheimer’s disease and vascular dementia
2016-12-09 09:29HaihongWANGTaoWANGShixingQIANLiBAZhiguangLINShifuXIAO
上海精神医学 2016年5期
Haihong WANG, Tao WANG, Shixing QIAN, Li BA, Zhiguang LIN, Shifu XIAO*
•Original research article•
A pilot longitudinal study on cerebrospinal fluid (CSF) tau protein in Alzheimer’s disease and vascular dementia
Haihong WANG, Tao WANG, Shixing QIAN, Li BA, Zhiguang LIN, Shifu XIAO*
Alzheimer’s disease; vascular dementia; tau protein; phosphorylated tau protein
1. Background
Alzheimer’s disease (AD) is a primary degenerative brain disease with that develops slowly, has insidious onset and is irreversible. Cognitive impairment is considered the prominent clinical feature in AD. Since the first clinical report by Alzheimer Alois in 1907,it has been studied for more than 100 years. The typical pathological features of AD are extracellular senile plaques (plagues senile, SPs) and intracellular neurof i brillary (NFTs)[1]AD is the most common type of dementia in the elderly. According to epidemiological data and autopsy reports, 50% to 70% of patients with dementia also had AD. It is an age related disease,where the prevalence rate in people over 65 years older is about 5.9%. There are about 10 million individuals with AD in China. Persons with AD tend to have a higher prevalence of disease, high mortality rate,long duration of illness, high medical costs and care difficulty. All of these AD related issues have combined to make Alzheimer’s one of the most serious social and economic problems in China’s rapidly graying society.Despite the magnitude of this problem and the massive efforts underway to study and prevent it, there has to date been no reliable and objective diagnostic criteria found for AD. In recent years, there have been many studies on the biological markers of cerebrospinal fluid in patients with AD, and the high level of the T-tau, P-tau founded in cerebrospinal fluid (CSF) is at this time an indisputable fact. However, the relationship between these markers and the severity of dementia, as well as the development of the disease, should be further studied. Some researchers suggested that tau protein in cerebrospinal fluid was related to the severity of dementia, but many follow-up studies have not found its changes. In addition, there are few research studies focused on severe dementia. Therefore, in our study,we divided the AD patients into a moderate AD group(10 ≤ MMSE ≤ 20) and a severe AD group (MMSE ≤ 9)according to the Mini Mental State Examination (MMSE)[2], and compared the cerebrospinal fluid concentration of T-tau and P-tau with the patients with severe vascular dementia (VD). Additionally we observed the changes of the disease development at a 6 month follow-up.
2. Methods
2.1 Participants
The Alzheimer’s group was made up of 21 outpatients and inpatients seen from September 2007 to March 2009 at the geriatrics department of the Shanghai Mental Health Center. They all met the criteria for Alzheimer’s disease according to the Diagnostic and Statistical Manual of Mental Disorders, 4thedition (DSMIV). MMSE scores were interpreted in the following manner: score of 17 or under was considered as having no education, a score of 17 to 20 was considered having a primary school education, and a score of 20 or above was considered having a secondary education or above.Scores of 10 or above on the Hamilton Depression Scale(HAMD) and 4 or more on the Hachinski ischemia idex were considered significant. Cases were excluded from this study based on the history of illness, or because of the results of other physical, mental or imaging(i.e. CT or MRI) examinations (we excluded cases with dementia caused by other diseases or because of use of psychoactive substances).
The vascular dementia group was made up of 7 outpatients and inpatients seen from September 2007 to March 2009 at the geriatrics department of the Shanghai Mental Health Center. All participants in this group met the diagnostic criteria for vascular dementia according to the DSM- IV. Cases with dementia caused by other diseases or psychoactive substances were excluded. All participants or their guardians provided written informed consent to participate in this study.This study was approved by the ethics committee of the Shanghai Mental Health Center.
According to the MMSE score, severity of dementia was rated as mild (MMSE > 20), moderate (10 ≤ MMSE≤ 20), or severe (MMSE ≤ 9). The AD group was divided into the moderate AD group (11 cases) and severe AD group (10 cases), and all the patients of the VD group had severe dementia. All patients were treated with standard therapy treatments for dementia.
We carried out assessment using scales and alumbar puncture to collect the patients’ cerebrospinal fluid at baseline and after 6 months. 33.3% (7/21) of the participants with AD and 85.7% (6/7) of those with VD completed the scale assessments and collections of cerebrospinal fluid at both baseline and after 6 months.At baseline, we compared the cerebrospinal fluid levels of T-tau and P-tau231between the AD group and VD group, severe AD group and severe VD group, moderate AD group and severe AD group. We also compared the cerebrospinal fluid levels of T-tau and P-tau231at baseline and after 6 months between the AD group (7 patients) and VD group (6 patients).
2.2 Sample collection and laboratory examination
A lumbar puncture was performed on all participants to collect samples of cerebrospinal fluid in a 3ml sterile polyacrylamide tube. The samples were placed on ice and centrifuged for 15 minutes at 4OC and 3500 rpm.In order to avoid repeated freezing and thawing, the samples were sub-packed and frozen at -80OC for testing. It took a total of 2 hours from collecting of the samples to storage in the refrigerator. The laboratory examinations were conducted in the biochemical laboratory at the Shanghai Mental Health Center.
ELISA kits were used to determine the concentrations of T-tau and P-tau231of the samples. The kits were invitrogenTMT-tau (No. KHB0042) and P-tau231(No. KHB7051), which are produced by an American Biosource company. Molecular devices of the DENLEY DRAGON Wellscan MK 3 (Thermo company, Finland)were used to read the absorbance value at 450nm.Ascent software for Multiskan was used to directly read the samples’ concentrations.
T-tau test: (1) the reagent kit and the sample were at room temperature for 30 minutes, and then the reference standards were prepared at the following concentrations: 2000, 1000, 500, 250, 125, 62.5, 31.2 pg/mL. (2) The samples and reference standards were added with a different concentration into the 96 hole plate which had been wrapped, then were incubated for 2 hours at room temperature. (3) the plate was washed,and the fi rst antibody was added, and was incubated for 1 hour at room temperature. (4) the plate was washed,and the second antibody was added labeled with horseradish peroxidase, and incubated for 30 minutes at room temperature. (5) the plate was washed, and color agent was added, incubating for 30 minutes at room temperature. (6) termination solution was added, and the absorbance value was read at 450 nm.

Figure 1. Flow chart of the study
P-tau231 detection: (1) the reagent kit and the sample were placed at room temperature for 30 minutes, and then the reference standards were prepared at the following concentrations: 800, 400, 200,150, 25, 12.5, pg/mL. (2) the samples and reference standards were added with different concentrations into the 96 hole plate which had been wrapped, then the first antibody was added and incubated overnight at 4oC. (3) the plate was washed, and the second antibody labeled with horseradish peroxidase was added, and allowed to incubate for 30 minutes at room temperature. (4) the plate was washed, and color agent was added, and allowed to incubate for 30 minutes at room temperature. (5) termination solution was added,and the absorbance value was read at 450 nm.
2.3 Statistical analysis
SPSS 17.0 was used for the data analysis. Fisher’s exact test was used to test data related to gender, education,etc. Since our sample size was small, the Mann-Whitney test was used to test data related to age, age of onset,history of illness, MMSE score, and concentration of tau protein. Wilcoxon signed rank test was used to compare data at baseline and after 6 months follow-up.
3. Results
3.1 Comparisons of the cerebrospinal fluid concentrations of T-tau and P-tau231 between the AD and VD groups at baseline.
3.1.1 General demographic data and MMSE scores
The AD group AD was made up of 6 males (28%) and 15 females (71%). One participant was illiterate (5%), 10 participants (48%) had a primary school education, and 10 participants (48%) had a secondary school education.Age of participants ranged from 54 to 89 years old and the mean (sd) age was 73 (10). History of illness ranged from 2 to 15 years and the mean (sd) was 5(3). The age of onset ranged from 51 to 86 years and the mean (sd)age of onset was 68 (10) years. MMSE scores ranged from 0 to 20 with a mean (sd) of 8.6 (7.1). (see table 1).
The VD group was made up of 2 male participants(29%) and 5 female participants (71%). Education level of VD group participants was the following: 2 participants (29%) were illiterate, 3 participants (43%)had a primary school education, 2 participants (29%)had a secondary school education. Age of participants ranged from 74 to 82 years old with a mean (sd) age of78 (3) years. The total history of illness was 4 to 10 years with a mean (sd) of 7.3 (2.4) years. The age of onset ranged from 64 to 78 years with a mean (sd) of 71 (5)years. MMSE scores ranged from 0 to 3 with a mean (sd)of 1.0 (1.1). (see table 1).

Table 1. Comparison of mean (sd) demographic data and cerebrospinal fluid level of T-tau and P-tau231 between the Alzheimer's disease group (AD) and the vascular dementia group (VD)
There were no statistically significant differences in gender (X2=0.000, p = 1), age (Z = -1.331, p = 0.192),education level (X2=2.936, p= 0.247), and age of onset(Z = -0.931, p = 0.367) between the two groups. The differences in the history of illness (Z = -2.032, p = 0.042)and MMSE scores (Z = -2.026, p = 0.043) between the two groups were statistically significant, with the VD group having a longer history of illness and more serious cognitive impairment. (see Table 1).
3.1.2 Comparisons of the cerebrospinal fluid (CSF)concentrations of T-tau and P-tau231between the two groups
The CSF mean (sd) concentration of T-tau in the AD group was 470.08 (263.58) pg/mL and 208.76(42.24) pg/mL in the VD group. The CSF mean (sd)concentration of P-tau231was 90.94 (49.86) pg/mL in the AD group and 42.96 (13.10) pg/mL in the VD group. The differences of CSF concentrations of T-tau (Z= -3.369,p<0.001) and P-tau231(Z = -3.237,p <0.001) between the two groups were both statistically significant (see Table 1).school education and 6 participants had a secondary school education or above. Ages ranged from 63 to 86 with a mean (sd) age of 77 (8.2) years. The total history of illness was 5 to 15 years with a mean (sd) of 7.5 (3.0)years. Age of onset ranged from 57 to 79 years old with a mean (sd) of 69.4 (8.3) years. MMSE scores ranged from 0 to 8 with a mean (sd) of 2.0 (3.1). (see table 2).
In the severe VD group there were 2 males (29%)and 5 females (70%). Educational level was the following: 2 participants were illiterate, 3 had a primary school education and 2 participants had a secondary education or higher. The mean (sd) age was 78.1 (3.2)years. The mean (sd) history of illness was 7.3 (2.4),and the mean (sd) age of onset was 71 (5.1) years. The mean (sd) MMSE score for the severe VD group was 1.0(1.1). (see table 2) There were no statistically significant differences in gender (X2=0.000, p=1.000), age (Z=-0.293, p =0.769), education (X2=1.921, p= 0.536), age of onset (Z=-1.745, p=0.081) , history of illness ( Z=-0.049,p=0.961), and MMSE scores (Z=-0.106, p=0.916)between the two groups (see Table 2).
3.2 Comparisons of the cerebrospinal fluid concentrations of T-tau and P-tau231 between the severe AD group and the VD group at baseline.
3.2.1 General demographic data and MMSE scores
In the severe AD group there were 3 (30%) males and 7 (70%) females. Education level was the following:1 person was illiterate, 3 participants had a primary
3.2.2 Comparisons of the cerebrospinal fluid concentrations of T-tau and P-tau231between the severe AD and VD groups
The differences of CSF concentrations of T-tau (Z=-2.830,p=0.005) and P-tau231(Z=-2.392, p=0.017) between the two groups were both statistically significant. The CSF concentrations of T-tau and P-tau231in the severe AD group were higher than those in the VD group (see Table 2).
3.3 Comparisons of the cerebrospinal fluid concentrations of T-tau and P-tau231 between the moderate AD group and severe AD group at baseline

Table 2. Comparisons of demographic data, MMSE score, T-tau level, and P-tau231 level between the severe Alzheimer's disease group (AD) and the vascular dementia group (VD)
3.3.1 General demographic data and MMSE scores
In the moderate AD group there were 3 males (27%)and 8 females (73%). In terms of educational level there were 7 individuals (64%) with a primary school education, and 4 participants (36%) with a secondary school or higher education. Ages of participants in this group ranged from 53 to 89 years with a mean (sd) of 69.2 (11.1) years. The total history of disease was 2 to 4 years with a mean (sd) of 3.0 (0.7), and an age of onset ranging from 50 to 86 years with a mean (sd) of 66.3(11.2) years. MMSE scores ranged from 10 to 20 with a mean (sd) of 14.6 (3.0). (see table 3).
There were no statistically significant differences in gender (X2=0.019, p=1.000), age (Z=-1.797, p=0.072),level of education (X2=2.818, p=0.270), age of onset(Z=-0.776, p=0.438) between the two groups. The differences in length of illness (Z=-3.932, p<0.001) and MMSE scores (Z=-3.927, p<0.001) between the two groups were statistically significant, with the severe VD group having a longer length of illness and more serious cognitive impairment. (see table 3).
In the AD group there were 2 males (29%) and 5 females (71%). Educational level of participants was the following: 1 person (14%) was illiterate, 3 people (43%)had a primary school education, and 3 people (43%)had a secondary school education or higher. Ages of participants in this group ranged from 63 to 84 years old with a mean (sd) age of 77.0 (8.9) years. The total length of illness ranged from 3 to 10 years with a mean(sd) of 6.3 (2.1) years, and the age of onset ranged from 57 to 79 years with a mean (sd) of 70.7 (9.1) years.MMSE scores ranged from 0 to 13 with a mean (sd)of 3.1 (5.2). (See table 5). ))))))))In the VD Group there were 2 males (33%) and 4 females (44%). Educational level of the participants was as follows: 1 person was illiterate, 3 people had a primary school education only and 2 participants had a secondary education or higher.Within this group the ages ranged from 74 to 82 years old with a mean (sd) age of 77.8 (3.4) years. The total history of illness ranged from 4 to 10 years with a mean(sd) 7.5 (2.6) years, and the age of onset ranged from 64 to 78 years with a mean (sd) of 70.3 (5.3) years. (see table 4). MMSE scores within this group ranged from 0 to 2 with a mean (sd) of 0.7 (0.8) (see table 5).
3.3.2 Comparisons of the cerebrospinal fluid concentrations of T-tau and P-tau231between the moderate AD group and severe AD group
The difference of CSF concentrations of P-tau231(Z=-2.605, p=0.009) between the two groups was statistically significant. There was no statistically significance difference in the CSF concentration of T-tau(Z=-1.127, p=0.260) between the two groups (see Table 3).
3.4 Comparisons of the cerebrospinal fluid concentrations of T-tau and P-tau231 between the AD group and VD group after 6 months follow up
3.4.1 General demographic data and MMSE scores
33.3% (7/21) of participants with AD and 85.7% (6/7) of participants with VD completed the 6 months follow-up.
3.4.2 Comparison of MMSE scores and the cerebrospinal fluid concentrations of T-tau and P-tau231between the baseline and after 6 months follow-up in the AD group and VD group
In the AD group, the MMSE scores of participants at 6 month follow-up were not significantly different from baseline (Z=0.000, p=1.000). Also, there were also no statistically significant differences in the levels of CSF T-tau (Z = -1.782, p =0.094) and CSF P-tau231(Z =-1.153, p=0.313) at baseline and 6 month follow-up (see Table 5).Meanwhile, in the VD group, participants MMSE scores at the 6 month follow-up were not significantly different from those at baseline (Z=-1.633, p=0.250). There were also no statistically significant differences in the levels of CSF T-tau (Z=-1.483, p=0.188) and CSF P-tau231(Z=-0.135,
p=1.000) between baseline and 6 months follow-up (see Table 5).
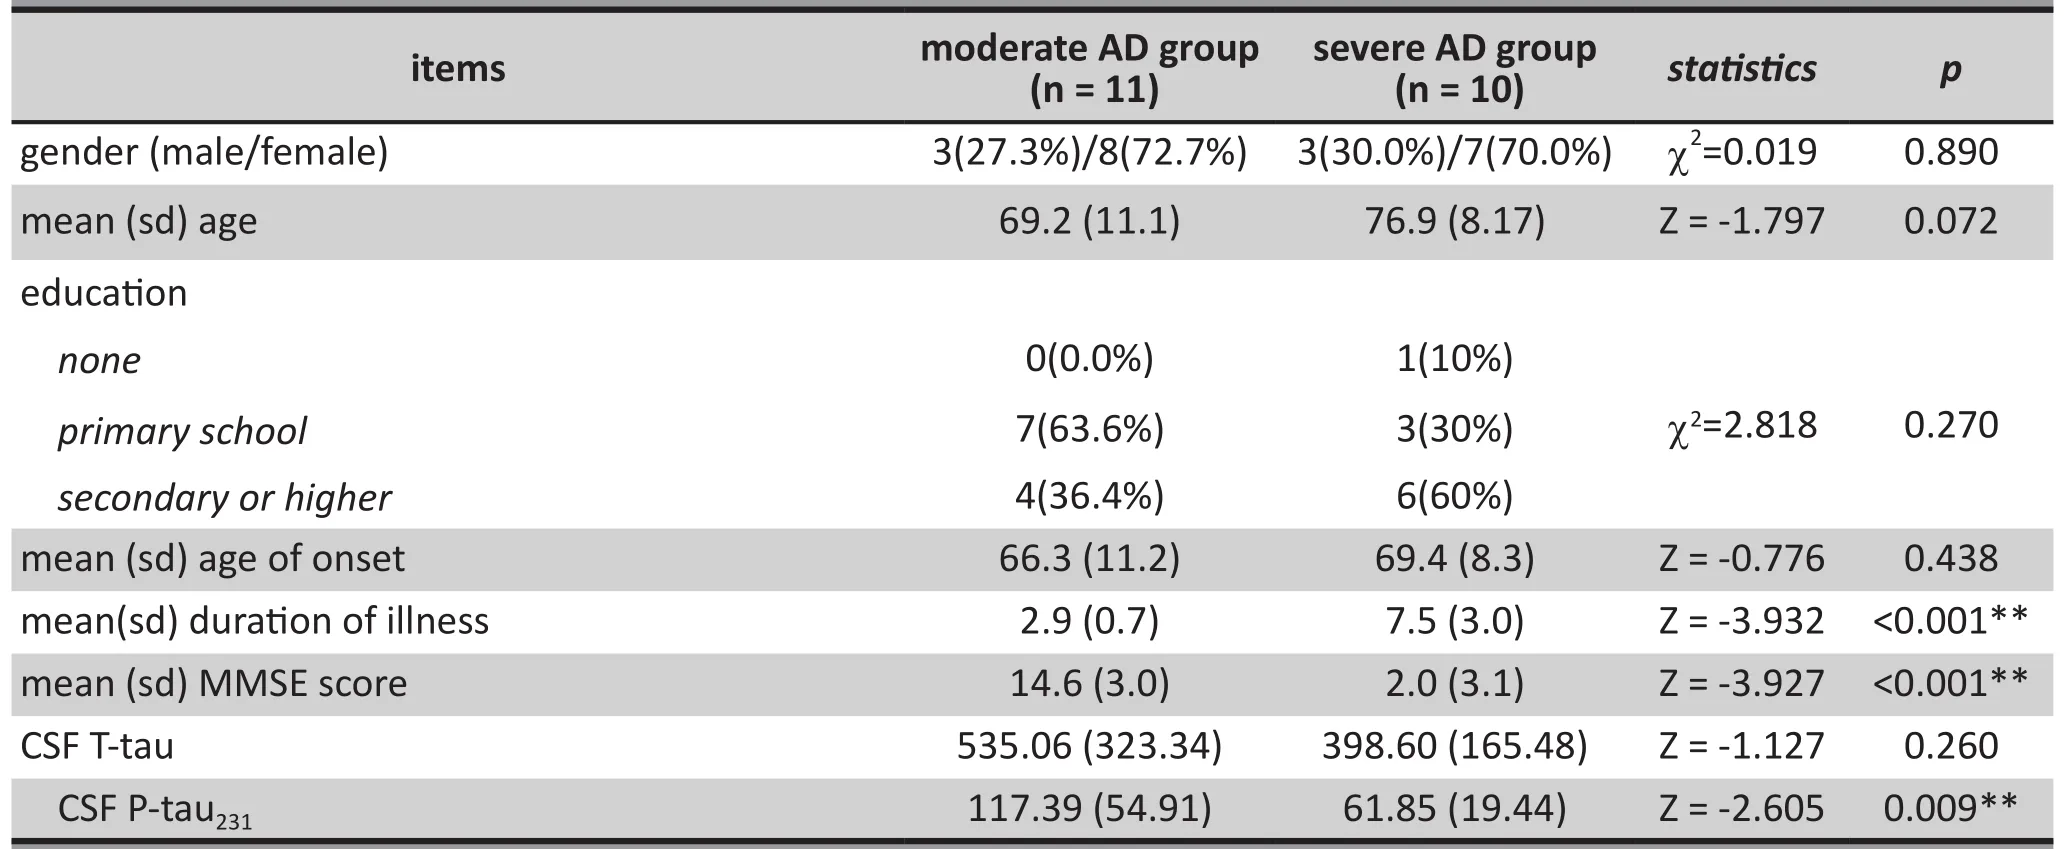
Table 3. Comparisons of the demographic data, MMSE score, T-tau level, and P-tau231 level between the moderate Alzheimer's disease group (AD) and the severe Alzheimer's disease group (AD)

Table 4. Demographic data of participants with Alzheimer's disease (AD) and vascular dementia (VD) at the 6 month follow-up

Table 5. Comparisons of the MMSE scores, cerebrospinal fluid level of T-tau and P-tau231 between baseline and 6 month follow-up in the Alzheimer's disease group (AD) and the vascular dementia group (VD) (median (Q3-Q1))
4. Discussion
4.1 Findings
In 1993, Vandermeeren and colleagues[3]fi rst reported that the CSF T-tau in individuals with AD was higher than that in normal controls. Later, this conclusion was further supported.[4]However, the use of T-tau was limited to distinguishing AD from other neurological disorders. At present, the level of T-tau may only be considered as an indicator of the severity of axonal injury and neuronal degeneration and necrosis.[5]In addition, the cerebrospinal fluid T-tau in was also reported to be increased in those with VD,[6-8], but other reports did not agree with this conclusion.[9-13]
At present, ELISA has been able to quantitatively detect the phosphorylated tau protein at specific sites,which is positively correlated with the concentration of T-tau. Some studies have reported that[14-18]T-tau and P-tau231will increase in the mild cognitive impairment(MCI) stage[19,20], and then decrease along with the development of the disease.[19,21]In the early stage of AD, the changes of T-tau and P-tau231 can be detected before clinical cognitive impairment is detected.Therefore, the changes of T-tau and P-tau231can be detected before the clinical symptoms of cognitive impairment occur. This would be helpful for diagnosis and treatment of AD in the early stage, and would be of great benef i t to patients.
Our results showed that the concentrations of CSF T-tau and P-tau231in the groups with moderate and severe AD were both significantly higher than those seen in the severe VD group. This result is similar to studies published in other countries.[22-24]Some researchers reported that the concentrations of CSF P-tau231and T-tau decreased with the development of the disease.[14-15,19]Our results indicated that, compared with the group with moderate AD, the concentrations of CSF P-tau231in the group with severe AD was significantly higher(Z=-2.605, p=0.009). However, there was no significant difference in the concentration of T-tau (Z=-1.127,p=0.260). So we speculated that the concentration of CSF P-tau231may decrease faster than T-tau. However,the results at the 6 month follow-up showed that there were no statistical differences in the concentrations of CSF T-tau and P-tau231 between baseline and follow-up in the AD and VD groups. These results are consistent with the findings of other studies.[25,26]
4.2 Limitations
There are several limitations in our study. Cerebrospinal fluid collection is an invasive examination, so its clinical application is greatly restricted. It was very difficult for the patients with dementia to complete the cerebrospinal fluid collection twice, so we did not have many cases and there were even fewer participants who completed the 6 month follow-up. Most of our cases were enrolled from inpatients with moderate and severe AD and the patients with severe VD, among which we could not find many patients with mild dementia.Though we had a longitudinal observation period of 6 months, the follow-up time was relatively short, and the sample size was small.
At present, the most widely used scales for evaluating the severity of dementia are the MMSE and Alzheimer’s Disease Assessment Scale-cognitive subscale(ADAS-Cog).[27]Assessing the severity of dementia using MMSE is relatively inaccurate, so the scores of many patients with severe AD were 0. ADAS-Cog is mainly used for patients with mild and moderate dementia,and the cases in our study had severe dementia with cognitive functions that had been severely impaired and therefore they could not complete the testing using ADAS-cog, so we decided to use MMSE to grade the severity of dementia.
4.3 Implications
In a prospective study, Alessandro and colleagues[28]found that T-tau significantly increased more in the early stage of AD than in the later and more severe stage,indicating that the concentration of T-tau decreased as the disease developed. However, there were also studies reporting that T-tau did not change during the follow-up period,[25]and the concentration of CSF T-tau continued to stably increase for 12 months or longer.[26]
The results of the present study show that the concentration of T-tau and P-tau231in cerebrospinal fluid may have an increase and followed by a decrease during the course of AD. However, at the 6 month follow-up we found no change in the concentration of CSF T-tau and P-tau231. This may be because a 6 month follow up was too short; or because the subjects in our study were moderate and severe dementia cases and the concentration of CSF T-tau and P-tau231did not decrease as in the early stage.[28,29]
There have been many studies on the concentrations of CSF T-tau and P-tau and, apart from some minor differences, which they draw the same general conclusions. In recent years, cutoff values for the concentrations of P-tau and T-tau have been proposed for use in the diagnosis and differential diagnosis of AD.[5,17,18]However, cutoff values are different in different studies, which may be a result of the differences in cases in the studies, laboratory conditions, sample collection,processing, preservation of samples, or by the disease duration or severity. Our results suggest that the biological markers in the CSF of patients with AD should be classif i ed based on the course and the severity of the disease. The criteria for AD diagnosis can be determined only when the course and severity of the disease is clarified, so that the accuracy of biological markers in AD diagnosis can be improved without misdiagnosis or a missed diagnosis.
There are not many longitudinal studies of the concentration of CSF tau protein in patients with AD.Rarely is classification of AD based on course and severity of the disease. There are also great differences between how AD progresses in individuals, such as some develop severe dementia in 2 to 3 years while others have only a mild or moderate dementia for as long as 10 years. Given all these factors, a unified standard for the diagnosis of AD has a long way to go.
Funding
This study was funded by the Commissioned Research Project of the Shanghai Science and Technology Committee (08411951100) and the National Science and Technology Supporting Plan Project (2009BAI77B03).
Informed consent
All participants provided written informed consent to participate in this study.
Conflict of interest statement
The authors declare no conflict of interest related to this study.
Ethics approval
This study was approved by the ethics committee of the Shanghai Mental Health Center.
Authors’ contributions
WHH was in charge of the overall study design, sample processing and storage, scale assessment, collection of cerebrospinal fluid, lab examination, statistical analysis and writing of the paper.
WT was in charge of cases enrollment and collection of cerebrospinal fluid.
QXS was in charge of scale assessment and collection of cerebrospinal fluid.
BL was in charge of scale assessment.
LZG was in charge of lab examination.
XSF supervised the study design, paper writing and revision, and case enrollment.
Reference:
1. Iqbal K, Alonso AC, Gong CX, Khatoon S, Pei JJ, Wang JZ,et al. Mechanism of neurof i brillary degeneration and the formation of neurof i brillary tangles. J Neural Transm. 1998;53: 169–180. doi: http://dx.doi.org/10.1007/978-3-7091-6467-9_15
2. Folstein MF, Folstein SE, McHugh PR. “Mini-mental state”. A practical method for grading the cognitive state of patients for the clinician. J Psychiatr Res. 1975; 12(3): 189 - 198. doi:http://dx.doi.org/10.1016/0022-3956(75)90026-6
3. Vandermeeren M, Mercken M, Vanmechelen E, Six J, van de Voorde A, Martin JJ, et al. Detection of tau protein in normal and Alzheimer’s disease cerebrospinal fluid with a sensitive sandwich enzyme-linked immunosorbent assay.J Neurochem. 1993; 61: 1828–1834. doi: http://dx.doi.org/10.1111/j.1471-4159.1993.tb09823.x
4. Olsson B, Lautner R, Andreasson U, Öhrfelt A, Portelius E,Bjerke M, et al. CSF and blood biomarkers for the diagnosis of Alzheimer’s disease: a systematic review and metaanalysis. Lancet Neurol. 2016; 15(7): 673-684. doi: http://dx.doi.org/10.1016/S1474-4422(16)00070-3
5. Somers C, Struyfs H, Goossens J, Niemantsverdriet E,Luyckx J, De Roeck N, et al. A Decade of Cerebrospinal Fluid Biomarkers for Alzheimer’s Disease in Belgium. J Alzheimers Dis. 2016; 54(1): 383-395. doi: http://dx.doi.org/10.3233/JAD-151097
6. van Harten AC, Kester MI, Visser PJ, Blankenstein MA,Pijnenburg YA, van der Flier WM, et al. Tau and p-tau as CSF biomarkers in dementia: a meta-analysis. Clin Chem Lab Med. 2011; 49(3): 353-366. doi: http://dx.doi.org/10.1515/CCLM.2011.086
7. Kaerst L, Kuhlmann A, Wedekind D, Stoeck K, Lange P, Zerr I. Cerebrospinal fluid biomarkers in Alzheimer’s disease,vascular dementia and isch vascular dementia emic stroke patients: a critical analysis. J Neurol. 2013; 260(11): 2722-2727. doi: http://dx.doi.org/10.1007/s00415-013-7047-3
8. Nägga K, Gottfries J, Blennow K, Marcusson J. Cerebrospinal fluid phospho-tau, total tau and beta-amyloid(1–42) in the differentiation between Alzheimer’s disease and vascular dementia. Dement Geriatr Cogn Disord. 2002; 14: 183–190.doi: http://dx.doi.org/10.1159/000066023
9. Xue HB, Xiao SF, Sun Y, Zhang MY. [Cerebrospinal fluid biomarkers for diagnosis of Alzheimer disease and vascular dementia]. Zhongguo Xian Dai Shen Jing Ji Bing Za Zhi. 2007; 7: 257-261. Chinese. doi: http://dx.chinadoi.cn/10.3969/j.issn.1672-6731.2007.03.012
10. Mecocci P, Cherubini A, Bregnocchi M, Chionne F, CecchettiR, Lowenthal DT, et al. Tau protein in cerebrospinal fluid:A new diagnostic and prognostic marker in Alzheimer disease. Alzheimer Dis Assoc Disord. 1998; 1: 211–214. doi:http://dx.doi.org/10.1097/00002093-199809000-00015
11. Sjo¨gren M, Davidsson P, Tulberg M, Minthon L, Wallin A, Wikkelso C, et al. Both total and phosphorylated tau are increased in Alzheimer’s disease. J Neurol Neurosurg Psychiatry. 2001; 70: 624–630. doi: http://dx.doi.org/10.1136/jnnp.70.5.624
12. Leszek J, Malyszczak K, Janicka B, Kiejna A, Wiak A. Total tau in cerebrospinal fluid differentiates Alzheimer’s disease from vascular dementia. Med Sci Monit. 2003; 9(11): 484–488
13. Stefani A, Bernardini S, Panella M, Pierantozzi M, Nuccetelli M, Koch G, et al. AD subcortical white matter lesions and vascular dementia:CSF markers for differential diagnosis.J Neurol Sci. 2005; 237(1-2): 83–88. doi: http://dx.doi.org/10.1016/j.jns.2005.05.016
14. Mazzeo S, Santangelo R, Bernasconi MP, Cecchetti G,Fiorino A, Pinto P, et al. Combining cerebrospinal fluid biomarkers and neuropsychological assessment: A simple and cost-effective algorithm to predict the progression from mild cognitive impairment to Alzheimer’s disease dementia. J Alzheimers Dis. 2016; Epub ahead of print. doi:http://dx.doi.org/10.3233/JAD-160360
15. Buchhave P, Minthon L, Zetterberg H, Wallin AK, Blennow K, Hansson O. Cerebrospinal fluid levels of beta-amyloid 1–42, but not of tau, are fully changed already 5 to 10 years before the onset of Alzheimer dementia. Arch Gen Psychiatry. 2012; 69: 98–106. doi: http://dx.doi.org/10.1001 / archgenpsychiatry.2011.155
16. Parnetti L, Chiasserini D, Eusebi P, Giannandrea D, Bellomo G, De Carlo C, et al. Performance of aβ1-40, aβ1-42, total tau, and phosphorylated tau as predictors of dementia in a cohort of patients with mild cognitive impairment. J Alzheimers Dis. 2012; 29(1): 229-238. doi: http://dx.doi.org/10.3233/JAD-2011-111349
17. Mandecka M, Budziszewska M, Barczak A, Pepłońska B,Chodakowska-Żebrowska M, Filipek-Gliszczyńska A, et al.Association between cerebrospinal fluid biomarkers for Alzheimer’s disease, APOE genotypes and auditory verbal learning task in subjective cognitive decline, mild cognitive impairment, and Alzheimer’s disease. J Alzheimers Dis.2016; 54(1): 157-168. doi: http://dx.doi.org/10.3233/JAD-160176
18. Degerman Gunnarsson M, Ingelsson M, Blennow K, Basun H, Lannfelt L, Kilander L.High tau levels in cerebrospinal fluid predict nursing home placement and rapid progression in Alzheimer’s disease. Alzheimers Res Ther.2016; 8(1): 22. doi: http://dx.doi.org/10.1186/s13195-016-0191-0
19. Biagioni MC, Galvin JE. Using biomarkers to improve detection of Alzheimer’s disease. Neurodegener Dis Manag. 2011; 1: 127–139. doi: http://dx.doi.org/10.2217/nmt.11.11
20. Brys M, Pirraglia E, Rich K, Rolstad S, Mosconi L,Switalski R, et al.Prediction and longitudinal study of CSF biomarkers in mild cognitive impairment. Neurobiol Aging. 2009; 30: 682–690. doi: http://dx.doi.org/10.1016/j.neurobiolaging.2007.08.010
21. Hampel H, Stefan J. Total and phosphorylated tau proteins:Evaluation as core biomarker candidates in frontotemporal dementia. Dement Geriatr Cogn Disord. 2004; 17: 350–354.doi: http://dx.doi.org/10.1159/000077170
22. Paraskevas GP, Kapaki E, Papageorgiou SG, Kalfakis N,Andreadou E, Zalonis I, et al. CSF biomarker profile and diagnostic value in vascular dementia. Eur J Neurol. 2009;16: 205–211. doi: http://dx.doi.org/10.1111/j.1468-1331.2008.02387.x
23. Boban M, Grbić K, Mladinov M, Hof PR, Süssmair C, Ackl N,et al. Cerebrospinal fluid markers in differential diagnosis of Alzheimer’s disease and vascular dementia. Coll Antropol.2008; 32: 31–36. doi: http://dx.doi.org/10.1007/978-0-387-77574-6-22
24. Liu B, Tang Y, Shen Y, Cen L, Han M. Cerebrospinal fluid τ protein in differential diagnosis of Alzheimer’s disease and vascular dementia in Chinese population: a meta-analysis.Am J Alzheimers Dis Other Demen. 2014; 29(2): 116-122.doi: http://dx.doi.org/10.1177/1533317513507374
25. Andersson C, Blennow K, Almkvist O, Andreasen N, Engfeldt P, Johansson SE, et al. Increasing CSF phospho-tau levels during cognitive decline and progression to dementia.Neurobiol Aging. 2008; 29: 1466–1473. doi: http://dx.doi.org/10.1016/j.neurobiolaging.2007.03.027
26. Thal LJ, Kantarci K, Reiman EM, Klunk WE, Weiner MW,Zetterberg H, et al. The role of biomarkers in clinical trials for Alzheimer disease. Alzheimer Dis Assoc Disord.2006; 20: 6–15. doi: http://dx.doi.org/10.1097/01.wad.0000191420.61260.a8
27. Zec RF, Landreth ES, Vicari SK, Feldman E, Belman J, Andrise A, et al. Alzheimer disease assessment scale: useful for both early detection and staging of dementia of the Alzheimer type. Alzheimer Dis Assoc Disord. 1992; 6(2): 89-102
28. Alessandro S, Alessandro M, Sergio B, Panella M, MercatiF, Orlacchio A, et al.CSF markers in Alzheimer disease patients are not related to the different degree of cognitive impairment. J Neurol Sci. 2006; 251: 124–128.doi: http://dx.doi.org/10.1016/j.jns.2006.09.014
29. S ˇimić G, Boban M, Hof PR.Cerebrospinal fluid phosphorylated tau proteins as predictors of Alzheimer’s disease in subjects with mild cognitive impairment. Period Biol. 2008; 110: 27–30. doi: http://dx.doi.org/10.2478/s13380-013-0123-4

Haihong Wang obtained a bachelor degree in clinical medicine from Hebei North University in 2006,and obtained a Master’s degree in mental health from Shanghai Jiao Tong University in 2009. She has been working as a resident in the Shanghai Mental Health Center since 2009. Her main research interest is the early diagnosis and treatment of Alzheimer‘s disease.
中重度阿尔茨海默病与血管性痴呆患者脑脊液tau蛋白的预研究
王海红,王涛, 钱时兴,白丽,林治光,肖世富
阿尔茨海默病;血管性痴呆;tau蛋白;磷酸化tau蛋白
Background:Alzheimer’s disease (AD) has high a prevalence rate, high medical costs, and care difficulties,and has become a serious social and economic problem in our aging society. So far, there has not been a reliable and objective diagnostic criteria for AD found. In recent years, there have been many domestic and foreign studies on the biological markers of cerebrospinal fluid in the patients with AD, and high levels of the T-tau, P-tau found in cerebrospinal fluid (CSF) is at this point an indisputable fact. However, the relationship between these markers and the severity of dementia, as well as the development of the disease, should be further studied.Objective:Compare the CSF level of total tau (T-tau) and phosphorylated tau at threonine 231 ( P-tau231)between patients with moderate to severe Alzheimer’s disease (AD) and those with vascular dementia (VD)at baseline, and 6 month follow-up. Observe the differences between patients with AD and control group, as well as the changes as the disease develops.Methods:There were 11 patients with moderate AD (10 ≤ MMSE ≤ 20), 10 patients with severe AD (MMSE≤ 9), and 7 age-matched patients with severe VD at baseline, among which 7 AD patients and 6 VD patients completed the 6 months follow-up. CSF levels of T-tau, P-tau231 were measured with sandwich ELISA.Result:At baseline, the concentrations of the CSF level of T-tau were 470.08 (263.58) pg/mL in the AD group and 208.76 (42.24) pg/mL in the VD group. This difference was statistically significant (Z= -3.369, p <0.001).The concentrations of CSF level of P-tau231were 90.94 (49.86) pg/mL in the AD group and 42.96 (13.10) pg/mL in the VD group. This difference was also statistically significant (Z = -3.237, p <0.001). Compared to patients with severe VD, the concentration of CSF T-tau in patients with severe AD was significantly higher(Z= -2.830, p = 0.005), as well as the concentration of CSF P-tau231(Z = -2.392, p = 0.017). The concentration of CSF P-tau231in the patients with moderate AD was significantly higher than that in the patients with severe VD (Z = -2.605, p = 0.009). At the 6 months follow-up, there were no statistically significant differences in the changes of CSF T-tau and CSF P-tau231concentrations between the AD group and VD group.Conclusion:The CSF level of T-tau and P-tau231in the AD patients was significantly higher than that in the VD patients. The concentration of CSF P-tau231in the moderate AD patients was significantly higher than that in the patients with severe AD. During the 6 months follow-up, the changes of the CSF concentrations of T-tau and P-tau231between AD group and VD group were not statistically significant.
[Shanghai Arch Psychiatry. 2016; 28(5): 271-279.
http://dx.doi.org/10.11919/j.issn.1002-0829.216068]
Shanghai Mental Health Center, Shanghai Jiaotong University School of Medicine, Shanghai, China
*correspondence: Professor Shifu Xiao. Mailing address: 600 Wanping RD, Shanghai, China. Postcode: 200030. E-mail: xiaoshifu@msn.com
背景:阿尔茨海默病(Alzheimer’s disease,AD)患病率高、医疗费用高、照料困难,已成为老龄化社会面临的严重社会、经济问题。迄今,AD的诊断尚无可靠的客观诊断指标。近年来,国内外对AD患者脑脊液生物学标志物的研究甚多,AD患者脑脊液T-tau、P-tau升高已是不争的事实。但是,这些标志物与痴呆严重程度以及随病程进展的关系还有待进一步深入研究。目标:比较中重度阿尔茨海默病(Alzheimer’s disease,AD)与血管性痴呆(vascular dementia,VD)患者脑脊液(cerebrospinal fluid,CSF)总tau蛋白(total tau,T-tau)和第231位苏氨酸磷酸化tau蛋白(P-tau231)的基线浓度,随访6个月,观察它们在AD患者与对照组之间的差异以及随病程进展的变化。方 法:基 线 期 中 度 AD 患 者 11例 (10 ≤ MMSE ≤20),重度AD患者10例(MMSE ≤ 9)以及年龄匹配的重度VD患者7例,其中7例AD与6例VD完成了6个月的随访。用双抗体夹心ELISA检测脑脊液T-tau,P-tau231的浓度。结果:基线期AD组与VD组患者CSF T-tau的浓度分别 为 470.08(263.58)pg/mL、208.76(42.24)pg/mL,差异有统计学意义(Z= -3.369,p <0.001);CSF P-tau231的浓度分别为 90.94 (49.86)pg/mL、42.96(13.10)pg/mL,差异有统计学意义(Z = -3.237,p <0.001)。重度AD与重度VD相比,CSF T-tau(Z= -2.830,p = 0.005)、CSF P-tau231(Z = -2.392,p = 0.017)的浓度仍有统计学差异,重度AD患者 CSF T-tau、CSF P-tau231的浓度比重度VD患者高。中度AD患者CSF P-tau231(Z = -2.605,p = 0.009)的浓度显著高于重度AD患者。6个月随访期间,两组患者脑脊液T-tau、P-tau231浓度的变化均无统计学意义。结论:AD患者脑脊液T-tau、P-tau231与VD相比显著升高。中度AD患者CSF P-tau231显著高于重度AD患者。6个月随访期间两组患者脑脊液T-tau、P-tau231浓度的变化均无统计学意义。
猜你喜欢
中老年保健(2022年2期)2022-08-24
中老年保健(2022年1期)2022-08-17
中华养生保健(2020年2期)2020-11-16
云南医药(2019年3期)2019-07-25
奥秘(2018年9期)2018-09-25
医学研究杂志(2015年4期)2015-06-10
中国医药科学(2015年15期)2015-02-27
中华皮肤科杂志(2014年3期)2014-12-19
中医研究(2014年10期)2014-03-11
中医研究(2014年8期)2014-03-11

- 上海精神医学的其它文章
- Efficacy of atypical antipsychotics in the management of acute agitation and aggression in hospitalized patients with schizophrenia or bipolar disorder: results from a systematic review
- Factors associated with significant anxiety and depressive symptoms in pregnant women with a history of complications
- Brain gamma-aminobutyric acid (GABA) concentration of the prefrontal lobe in unmedicated patients with Obsessivecompulsive disorder: a research of magnetic resonance spectroscopy
- Characteristics of aggressive behavior among male inpatients with schizophrenia
- The history, diagnosis and treatment of disruptive mood dysregulation disorder
- Modern methods for longitudinal data analysis, capabilities,caveats and cautions