
Validation and application of Vierordt’s spectrophotometric method for simultaneous estimation of tamoxifen/coenzyme Q10 in their binary mixture and pharmaceutical dosage forms
2017-01-19 06:26
Department of Pharmaceutics,Faculty of Pharmacy,Helwan University,Ain-Helwan 11790,Cairo,Egypt
Validation and application of Vierordt’s spectrophotometric method for simultaneous estimation of tamoxifen/coenzyme Q10 in their binary mixture and pharmaceutical dosage forms
Eman S.El-Leithy*,Rania S.Abdel-Rashid
Department of Pharmaceutics,Faculty of Pharmacy,Helwan University,Ain-Helwan 11790,Cairo,Egypt
A R T I C L EI N F O
Article history:
Available online 11 February 2016
Tamoxifen citrate
Coenzyme Q10
Binary mixture
Solid lipid nanoparticles
Validation
For the sake of improving patient compliance and sustainability of chemotherapy healthcare system,both TC and CoQ10 were formulated as solid lipid nanoparticles(SLNs).The study was focused on establishing and validating a simple and reproducible spectrophotometric method for simultaneous determination of TC and CoQ10 in their binary mixture or pharmaceutical dosage forms.A new method based on simultaneous estimation of drug mixture without prior separation was developed.Validation parameters were checked with International Conference on Harmonization(ICH)guidelines.The accuracy and reproducibility of proposed method was statistically compared to HPLC.The TC and CoQ10 were quantifed at absorptivity wavelengths of 236 nm and 275 nm,respectively.Calibration curves obeyed Beer’s law in range of 2–14 μg/ml with a correlation coeffcient(R2)of 0.999 in both methanol and simplifed simulated intestinal fuid(SSIF).The%means recovery of TC and CoQ10 in pure state or binary mixture at various concentration levels were all around 100%. The low values of SD and%RSD(<2%)confrm high precision and accuracy of the proposed method.Formulated SLNs showed different%means recovery in range 81–92%for TC and 32–59%for CoQ10.The data obtained by applying simultaneous Vierordt’s equations showed no statistical signifcance in comparison to HPLC.Vierordt’s method was successfully applied as a simple,accurate,precise,and economical analysis method for estimating TC and CoQ10 concentrations in pure state,binary mixture and pharmaceutical dosage forms.
©2016 Production and hosting by Elsevier B.V.on behalf of Shenyang Pharmaceutical University.This is an open access article under the CC BY-NC-ND license(http:// creativecommons.org/licenses/by-nc-nd/4.0/).
1.Introduction
Imbalance between antioxidants and reactive oxygen species (ROS)results in oxidative stress,leading to cellular damage. The ROS plays a major role in causing mitochondrial changes linked to cancer and metastasis[1,2].
Tamoxifen citrate(TC)is an important non-steroidal estrogen antagonist drug that adheres to all stages of estrogen receptor positive breast cancer treatment as well as longterm prophylactic therapy in high-risk and post-menopausal women[3].However,uptake of antioxidants by tissue to reduce ROS production could be instrumental in controlling cancer[4]. Coenzyme Q10(CoQ10)is a proven potent antioxidant and protective agent against many diseases including cancer[5].It was recorded that prescribing vitamins(C and E),essential fatty acids,and CoQ10 for those patients receiving TC allows for cancer enhancing treatment outcomes and improves chemotherapy tolerability[6].
For the sake of improving patients’compliance with long term medication and sustainability of healthcare system,we were interested in formulating a new drug delivery system loaded with both drugs.Simple and fast simultaneous estimation of drug concentrations in their mixture or therapeutic delivery systems is posing a real challenge to formulators.Recently,many estimation techniques were developed on raw overlapping spectral data to enable mixture resolution,such as different order derivatives[7–9],derivatives of the ratio spectrum[10,11]and ratio subtraction technique[12].Valuable researches were published based on using simultaneous equation(Vierordt’s method)for estimation of 2 or more drugs in combined mixtures or pharmaceutical dosage forms[13–16].
Extensive literature survey revealed that no spectrophotometric method is available for simultaneous determination of TC/CoQ10 mixture.Despite the numerous advantages of HPLC for simultaneous determination of different drug mixture,most offcial methods suffered from well-established drawbacks such as:high solvent cost,low resolution power columns,long run time,diffcult selection of column packing materials,use of the gradient elution,limited choice of detectors,base-line drift on varying the eluent,lower signal-to-noise and signal-tobackground ratios and increased instrument complexity[17]. Additionally,chemical and physical properties ofTC and CoQ10 revealed very big difference in their polarity and partition coeffcients[18,19].Hence,the current study was focused on establishing and validation of Vierordt’s method for spectrophotometric determination of TC and CoQ10 concentrations in their binary mixture or pharmaceutical dosage forms.The accuracy and precision of the proposed method were confrmed by HPLC measurement.Student’s paired t-test was applied to compare the values of%means drug recovery by the two analytical methods.
2.Materials and methods
2.1.Materials
Tamoxifen citrate(m.wt:563.62)was generously given as a gift by Medical United Pharmaceutical Company,Cairo,Egypt. CoenzymeQ10(m.wt:863.34)and lecithin were given as gifts from Amriya Company for Pharmaceutical Industries,Rushdie, Alexandria,Egypt.Labrafac(capryl/caprylic triglycerides)was kindly donated by Gattefosse Company,France.Stearic acid, sodium lauryl sulfate(SLS),methanol,sodium dihydrogen phosphate(NaH2PO4),isopropyl alcohol,Tween 20,sodium chloride(NaCl)and sodium hydroxide(NaOH)were purchased from EL-Gomhoria Company,Cairo,Egypt.The n-hexane and triethylamine were also obtained from Sharlu(Spain) and Sigma Aldrich(Germany),respectively.All other chemicals were of analytical grade.Distilled water was used throughout the study.
2.2.Equipment
Mechanical stirrer(IKAWorks,Asia Sdn.Bhd.,Malaysia),cooling centrifuge(Hermle Z 200A,Germany),hot plate stirrer(Jenway 1000,U.K)and analytical balance(Setra BL-410S,U.S)were used. A JASCO V-530 double beam UV-VIS spectrophotometer with a fxed slit width(2 nm)connected to a computer loaded with spectra manager program was applied for spectral acquisition and elaboration of the data obtained.Quartz cuvettes,1-cm path length were used for measuring the light absorption in ultra-violet region(200–400 nm).Shimadzu HPLC model 20A auto sampler(Japan),UV detector and quaternary pump system with auto-gasser were used for HPLC separation and estimation of drug concentrations.
2.3.Methods
Both TC and CoQ10 are poorly soluble drugs(Fig.1A and B). Methanol and simplifed simulated intestinal fuid(SSIF)were chosen as dissolution media to ensure complete solubility of both drugs.The SSIF was prepared according to Taupitz et al. [20].Blank SSIF(pH 6.5)was prepared by dissolving 3.438 g NaH2PO4 and 6.186 g of NaCl in 900 ml of distilled water.The pH was adjusted with 0.1 N NaOH solution.The SSIF was reached by adding 0.25%w/v SLS and Tween 20.The volume was adjusted to 1000 ml by isopropyl alcohol.The buffer solution was ultrasonicated for 15 min then stirred for another15 min.
2.3.1.Preparation of sample solutions of drugs mixture
Alcoholic sample solution ofTC and CoQ10 binary mixture was prepared at lab-ratio of 5:5.A 0.5 ml of standard working solutions(100 μg/ml)of each drug was transferred to 10 ml volumetric fask and the volume was completed to the mark with methanol to obtain sample solution of 5 μg/ml concentration for each drug.The same procedure was followed with SSIF at strength ratio 10:10 to get sample solution of 10 μg/ml for each drug.
2.3.2.Preparation of TC/CoQ10 loaded solid lipid nanoparticles
In order to validate the developed simultaneous equations for estimating TC and CoQ10 concentrations in a pharmaceutical dosage form,solid lipid nanoparticles(SLNs)were chosen as a novel drug delivery system[21].The SLNs offer unique properties such as small size,large surface area,and high drug loading[22].The SLNs were prepared by micro-emulsifcationfollowed by ultrasonication technique(Fang et al.)[23].Stearic acid(2%,w/v)was melted at 60–70°C.Accurate weights of CoQ10 and TC were dispersed in lipid melt to have homogenous drug–lipid mixture.Lipid melt was added to aqueous surfactant solution(3%,w/v P188)preheated 10°C above the melting point of the lipid.Emulsifcation process was done under stirring by a high-speed mechanical stirrer at 6000 rpm for 10 min.Finally,the formed crude emulsion was ultrasonicated using a probe for 10 minutes to prevent crystallization of lipids and minimize particle size.The obtained nanoemulsion was cooled to room temperature to allow formation of SLNs dispersion.Separation of SLNs was carried out by centrifugation at 17,000 rpm for 30 min.The supernatant was discarded and sediment was washed with cold distilled water with repeating centrifugation process.A mixture of stearic acid with lecithin or labrafac was applied for preparing other formulae of SLNs following the previous procedures.A specifed weight of each formula was dissolved in methanol for subsequent determination of drug concentrations in a pharmaceutical dosage form[24].

Fig.1–Chemical structure of(A)tamoxifen citrate and(B)coenzyme Q10.
2.3.3.Development and validation of simultaneous spectrophotometric method for estimating TC and CoQ10 concentrations in pure state,binary mixture and SLNs
Firstly,working solutions of both drugs in pure state were scanned separately in UV range 200–400 nm against blanks for determining maximum wavelengths(λmax).The λmaxwere 236 nm and 275 nm for TC and CoQ10,respectively(Fig.2). Vierordt’s spectrophotometric method applied for simultaneous estimation of drugs that have measurable absorbance at λmaxof each other[25].For preparing calibration curves,serial solutions(2–14 μg/ml)of each drug were prepared using their working solutions.The absorbance was measured in triplicate at λmax236 and 275 nm.For linearity studies,calibration curves for TC and CoQ10 were plotted.Values of molar absorptivity of both drugs were determined by reconstructing the calibration curves using drugs molar concentrations.The regression equations,molar absorptivity and optical parameters are presented in Table 1.
Two simultaneous equations for determining drug concentrations in their mixture were developed using their molar absorptivity coeffcient values(Eqs.1 and 2).

where CTCand CCoQ10are concentrations of TC and CoQ10,respectively,in their sample solution(mole/L).A1and A2are absorbances of laboratory prepared mixtures at 236 nm and 275 nm,respectively.The α1and α2are molar absorptivities of TC at 236 nm and 275 nm,respectively.However,β1and β2are molar absorptivities of CoQ10 at 236 nm and 275 nm,respectively.All validation procedures were performed in accordance with International Conference on Harmonization ICH Q2(R1) guideline[26].To validate Vierordt’s formula on the working solutions of TC and CoQ10,the%means recovery(±SD)and %relative standard deviations(%RSD)at two concentration levels for each drug(8 and 12 μg/ml)in their pure state were calculated.Precision of the developed method was also ascertained by repeatability and intermediate precision studies.The in intraday study(repeatability)of the proposed method was performed with a minimum of three replicate measurements.The concentrations of the two drugs were calculated every two hours (0,2,and 4 h).In inter-day(intermediate precision)study, the concentrations of drugs were calculated on threeconsecutive days.The results of data statistical analysis are given in Table 2.Limit of Detection(LOD)and Limit of Quantifcation(LOQ)were also calculated.The LOD is the lowest amount of analyte,which can be detected but not necessarily quantitated as an exact value(Eq.3).The LOQ is the lowest amount of analyte,which can be quantitatively determined with suitable precision and accuracy(Eq.4).

Fig.2–Overlay spectrum of tamoxifen citrate and coenzyme Q10 mixture wavelength scan.

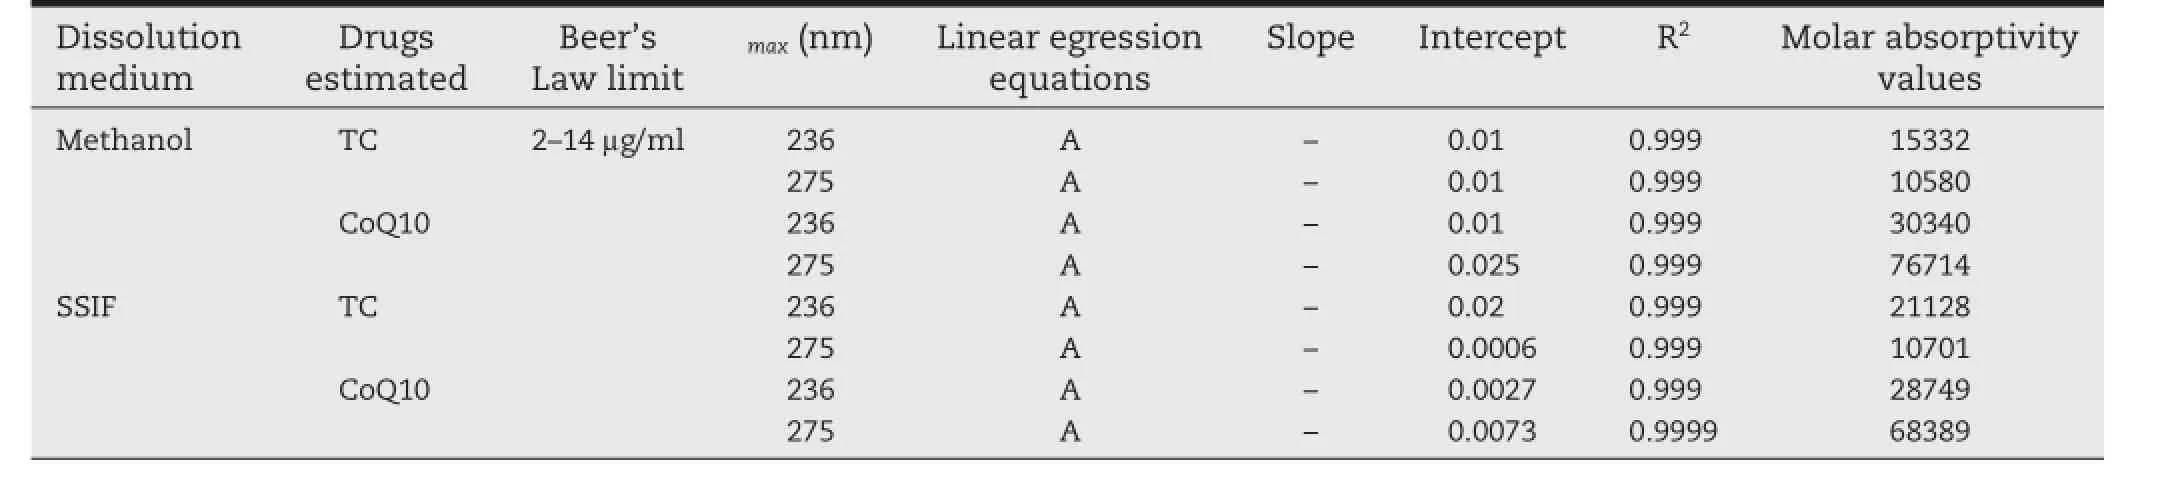
Table 1–Linearity regression equations and molar absorptivity values for TC and CoQ10 calibration curves at chosen wavelengths in different dissolution media.
where‘σ’is the standard deviation of the response and‘S’is the slope of the calibration curve.The results of LOD and LOQ for TC and CoQ10 are shown in Table 2.
Secondly,developedVierordt’s simultaneous equations(Eqs. 1 and 2)were applied for determining TC and CoQ10 concentrations in their lab mixtures of methanol and SSIF and SLNs. Parameters of accuracy and precision were also determined to validate developed simultaneous equations used for determining the concentrations of drugs in their binary mixture or pharmaceutical dosage forms(Tables 3,4;respectively).
2.3.4.HPLC as a reference method for determining drug concentrations
The content of TC and CoQ10(pure state or SLNs)was determined by HPLC as confrmatory reference test for evaluating the developedVierordt’s spectrophotometric method for direct estimation of drug concentrations without prior separation. Reference analysis method was performed by Shimadzu chromatographic system where reverse phase column C18 phenomax 150 mm×4.6 mm,with a porosity 5×10⁻³mm,was used as a stationary phase.The logP for both drugs was reported to be 6.3 and 17.16,whereas polar surface area was 145 and 52.6 for TC and CoQ10,respectively[18,19].This vast difference in physicochemical properties was expected to make chromatographic separation of TC and CoQ10 from their mixture by one elution system in short retention time with maximum recovery,precision and repeatability very hard or nearly impossible.Hence two mobile phases with different natures were chosen,a polar mobile phase for separation ofTC and a non-polar mobile phase for separation of CoQ10.A mixture of tri-ethylamine acetate buffer:methanol with a ratio of 24.3:75.7 v/v was found to be optimal forTC separation[27].Methanol:n-hexane with a ratio of 65:35 v/v was used for CoQ10 separation[28].The injection volume was 50 μl with fow rate 1.5 ml/min and UV detection of both drugs was carried out at 275 nm(Figs.3 and 4).
Accurately weighed 10 mg of TC or CoQ10 were transferred to 100 ml volumetric fasks(stock solutions).Both drugs were dissolved in 25 ml methanol,and volume was made up to mark with suitable mobile phase.Serial dilutions were made in concentration range of 2–14 μg/ml for each drug.Values obtained were used to build calibration models and to assess predictive capacity of models.Recovery studies wereperformed on a couple of concentrations of 8 and 12 μg/ml.The %recovery(±SD)and%relative standard deviations(%RSD)were calculated(Table 5).

Table 2–Validation sheet for determination of TC and CoQ10 in their pure forms,by applying Vierordt’s spectrophotometric method.
HPLC method was also applied for determining drug content in samples of SLNs.Weighted 50 mg of SLNs was dissolved in each mobile phase and injected into HPLC column to estimate the amount ofTC or CoQ10 loaded in SLNs.The accuracy and precision were also performed(Table 6).
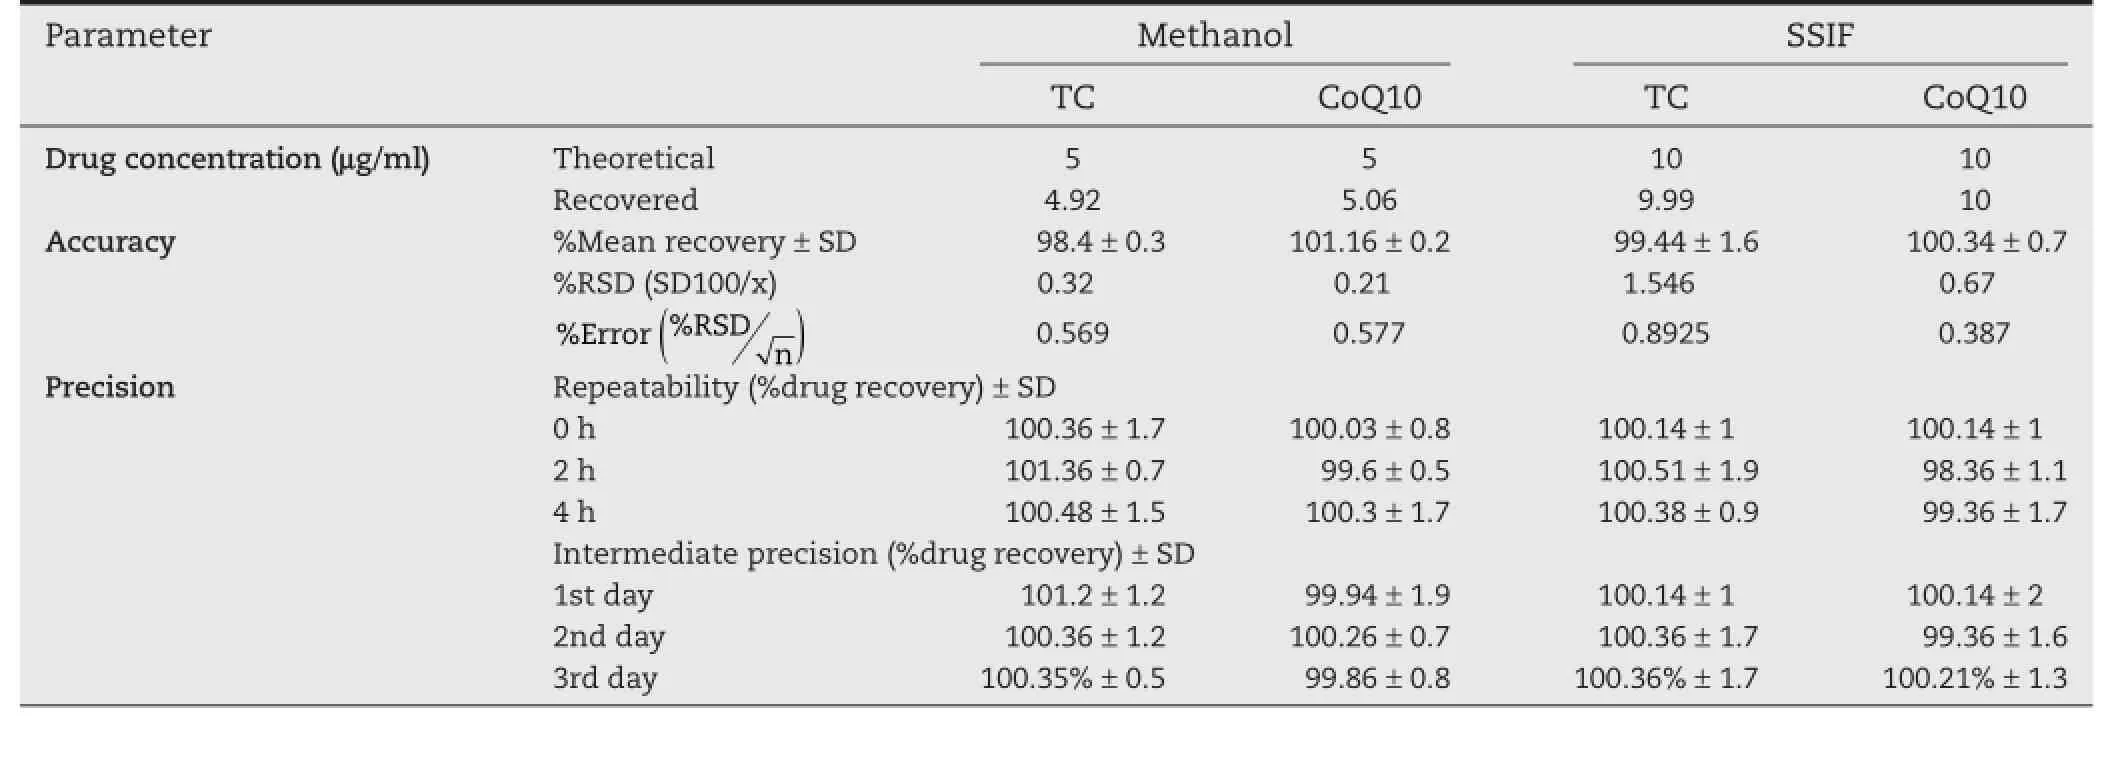
Table 3–Validation sheet for determination of TC and CoQ10 in their binary mixture at different dissolution media,by applying Vierordt’s spectrophotometric method.
2.3.5.Statistical analysis
All data were expressed as mean(±SD).Data were analyzed using the program SPSS 16.0(SPSS Inc.,Chicago,IL,USA)with help of paired samplesT where P<0.05 was conducted as signifcance level.
3.Results and discussion
3.1.Linearity
Calibration curves of TC and CoQ10 at 236 nm and 275 nm in methanol and SSIF media showed high linearity.The correlation between sample concentrations and their absorbencies complied with Beer’s law as illustrated by high values ofregression coeffcients(R2≈0.999)and small values of intercepts(Table 1).

Table 4–Validation sheet for determination of TC and CoQ10 in their SLNs dosage form,by applying Vierordt’s spectrophotometric method.

Table 5–Recovery studies by HPLC method for pure drugs.
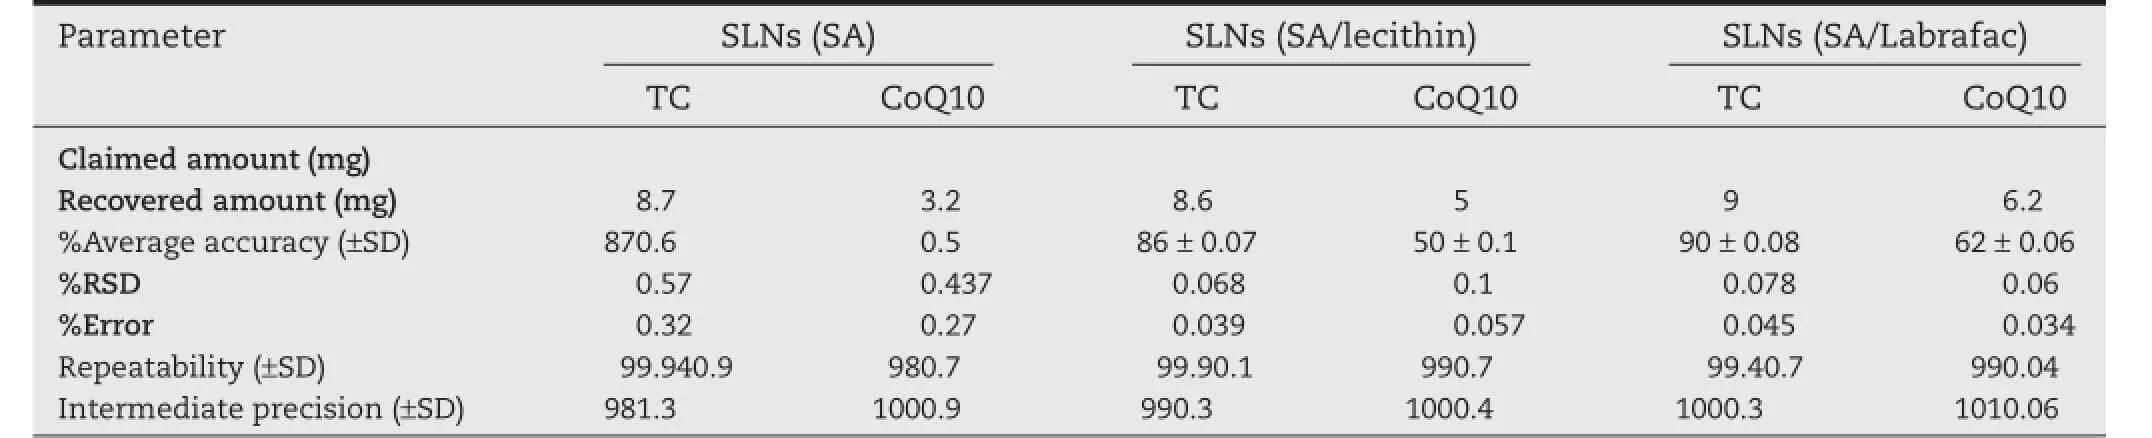
Table 6–Results of HPLC method for estimating of drugs content in SLNs.
3.2.Development of Vierordt’s equations for simultaneous estimation of TC and CoQ10
The spectral overlapping between spectral graphs of TC and CoQ10(Fig.2)was suffcient to demonstrate that direct spectrophotometric measurements cannot be applied for simultaneous determination of the two drugs in their mixture without prior separation.Two simultaneous equations for calculatingTC and CoQ10 concentrations in their binary mixture were developed using molar absorptivity coeffcient values.The developed equations in methanol and SSIF for each drug were given:
In methanol:

where A1and A2are the absorbance value at 236 and 275 nm, respectively,and C is the concentration in mole/l.Once absorptivity values are determined,very little time is required for calculating drug concentrations using the absorbances of samples at two selected wavelengths.Employing simultaneous equation is a very simple method and can be employed for a routine analysis of TC and CoQ10.
3.3.Validation of Vierordt’s simultaneous equations
3.3.1.For drugs in pure state
The accuracy of an analytical method is the closeness of test results to that of true values[29].In order to ensure reliability of proposed method,accuracy was confrmed by recovery studies at two concentration levels(8 and 12 μg/ml).The %means recovery ofTC and CoQ10 were 98.54–100.14 and 99.69–101.32,respectively,indicating the accuracy of the method (Table 2).The low values of SD and%RSD(<2%)are another confrmatory parameters for high precision,reproducibility and accuracy of proposed method(Table 2).The%RSD forTC at the two concentration levels was between 0.829–0.987 and 1.547–1.55 in methanol and SSIF,respectively.Moreover,%RSD at 8 μg/ ml was 1 and 0.682 for CoQ10 in methanol and SSIF,respectively, and was 0.379 and 1.269 at concentration level of 12 μg/ml in methanol and SSIF,respectively.
Precision study was also established by measuring absorbance of sample solution without changing the assay procedure at different time intervals.It is clearly obvious that the proposed method was highly precise,due to high%recovery presented in Table 2(100.03–102%for intra-day and 98.46–102.4%for inter-day measurements).The LOD was 0.088 μg/ ml and 0.043 μg/,while LOQ was 0.26 μg/ml and 0.142 μg/ml for TC in methanol and SSIF,respectively.The LOD for CoQ10 was 0.16 μg/ml and 0.1 μg/ml,whereas LOQ was 0.16 μg/ml and 0.3 μg/ml in methanol and SSIF,respectively(Table 2).
3.3.2.For drugs in lab mixtures
The developed method was also successfully applied for determination of TC and CoQ10 in their binary mixture solution at different ratio strengths.In methanol,the concentration ratio 5:5 μg/ml,showed%means recovery 98.4%±0.32 for TC and 101.2%±0.21%for CoQ10.Meanwhile,99.9%±0.63%and 100.3%±0.39%were%means recovery for TC and CoQ10,respectively,in SSIF at concentration ratio 10:10 μg/ml.Both%RSD and%error were less than 2%,indicating high accuracy of the developed method.The results also ensured high repeatability and intermediate precision(Table 3).
3.3.3.For drugs loaded in SLNs
The SLNs were prepared loaded with 10 mg of each drug.The %means recovery of each drug was determined by applying the developed equations.The results showed high agreement with the loaded amount of drugs(estimated%means recovery was 81–92%forTC and 32–59%for CoQ10).The SD,%RSD and%error were less than 2,confrming the method’s accuracy(Table 4). The developed method for simultaneous estimation ofTC and CoQ10 loaded in SLNs was valid,applicable,and with high repeatability and intermediate precision.
马刺押送秀容月明回北国,途中并不安稳,百姓“欢迎”秀容月明自不必说,还有人暗杀秀容月明,这些人,全是宁人,还有胡人被买通了,要秀容月明的命。
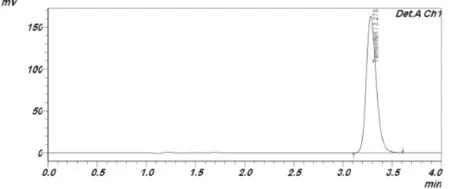
Fig.3–Representative HPLC chromatogram of TC using triethylamine acetate buffer:methanol(24.3:75.7,v/v)mobile phase.
3.4.HPLC as a reference method
In HPLC method,an adequate separation of eluted compounds was optimized.Several aliquots of standard solutions ofTC and CoQ10 at 2–14 μg/ml range were prepared with mobile phases.The optimum wavelength for detection of both drugs was 275 nm.The peak shapes of both drugs were symmetrical(Fig.3 and 4).The average retention times forTC and CoQ10 were found to be and 3.2 and 2.6 min,respectively.Constructed calibration curves showed high linearly with R2≈0.999. Application of HPLC method for pure drugs showed perfect recovery values(99.66–101.4%)for both drugs with high precision (%RSD<2)(Table 5).Results of HPLC%means recovery from different formulae of SLNs were presented in Table 6.The method was accurate and precise as indicated by recovery studies and%RSD not more than 2%.
Recorded values of%drug recovery from the two analytical methods were statistically analyzed using student paired t-test(Table 7).There were no signifcant differences between %drug recovery by the developedVierordt’s method and HPLC method(P<0.05,at 95%level of signifcance).Vierordt’s spectrophotometric method revealed high degree of accuracy for estimating TC and CoQ10 in their binary mixture and pharmaceutical dosage forms.
4.Conclusion

Fig.4–Representative HPLC chromatogram of CoQ10 using methanol:n-hexane(65:35,v/v)mobile phase.

Table 7–Statistical analysis of%drug means recovery of Vierordt’s and HPLC methods.
Admitting that HPLC method is expensive in hardware and chromatographic reagents,simultaneous estimation of two drugs with different polarity are yet more complex and moreexpensive.Vierordt’s method was successfully applied for selective routine analysis ofTC and CoQ10 concentrations in their binary mixture or pharmaceutical dosage forms without prior separation.The developed method was validated according to per ICH(Q2R1)guidelines.Recovery studies were satisfactory with low SD,%RSD,high repeatability and intermediate precision.Statistical analysis of data revealed no signifcant differences between drug concentrations estimated byVierordt’s method and those obtained by HPLC,confrming accuracy and precision of the developed method.Vierordt’s method has the benefts of being simple,rapid,direct,economic,with minimum data manipulation and not requiring sophisticated techniques or instruments.
Acknowledgments
The authors are thankful to Mona N.Sweilam(Analytical Chemistry Department,Faculty of Pharmacy,Helwan University)for providing guidance and technical support required for this research.
R E F E R E N C E S
[2]Klaunig J,Kamendilus LM.The role of stress in carcinogenesis.Annu Rev Pharmacol Toxicol 2004;44:239–267.
[3]MacGregor J,Jordan V.Basic guide to the mechanisms of antiestrogen action.Pharmacol Rev 1998;50:151–196.
[4]Perumal SS,Shanthi P,Sachdanandam P.Augmented effcacy of tamoxifen in rat breast tumorigenesis when gavaged along with ribofavin,niacin,and CoQ10:effects on lipid peroxidation and antioxidants in mitochondria.Chem Biol Interact 2005;152:49–58.
[5]Muta-Takada K,Terada T,Yamanishi H,et al.Coenzyme Q10 protects against oxidative stress-induced cell death and enhances the synthesis of basement membrane components in dermal and epidermal cells.Biofactors 2009;35:435–441.
[6]Lockwood K,Moesgaard S,Hanioka T,et al.Apparent partial remission of breast cancer in‘high risk’patients supplemented with nutritional antioxidants,essential fatty acids and coenzyme Q10.Mol Aspects Med 1994;(Suppl. 15):231–240.
[7]Altinos S,Tekeli D.Analysis of glimepiride by using derivative UV spectrophotometric method.J Pharm Biomed Anal 2001;24:507–515.
[8]Lemus Gallego JM,Perez Arroyo J.Simultaneous resolution of dexamethasone and polymyxin b by spectrophotometry derivative and multivariate methods.Anal Lett 2001;34:1265–1283.
[9]Nanda RK,Pangarkar VB,Thomas AB,et al.Simultaneous estimation of montelukast sodium and bambuterol hydrochloride in tablets by spectrophotometry.Hindustan Antibiot Bull 2008;49–50:29–33.
[10]Darwish HW,Hassan SA,Salem MY,et al.Three different spectrophotometric methods manipulating ratio spectra for determination of binary mixture of amlodipine and atorvastatin.Spectrochim Acta 2011;83:140–148.
[11]Hassib ST,El-Zaher AA,Fouad MA.Validated stabilityindicating derivative and derivative ratio methods for the determination of some drugs used to alleviate respiratory tract disorders and their degradation products.Drug Test Anal 2011;3:306–318.
[12]El-Bardicy MG,Lotfy HM,El-Sayed MA,et al.Smart stabilityindicating spectrophotometric methods for determination of binary mixtures without prior separation.JAOAC Int 2008;91:299–310.
[13]Giriraj P,Sivakkumar T.New simple spectrophotometric method for the simultaneous estimation of paracetamol and fupirtine maleate in pure and pharmaceutical dosage form. Int J Spectro 2014;1–7.
[14]Visagaperumal D,Vasavi A.Development and validation of UV spectrophotometric method(Vierordt’s Method)for simultaneous estimation of eperisone hydrochloride and paracetamol in tablets.Ph Tech Med 2014;3:441–444.
[15]Rizk MS,Merey HA,Tawakkol SM,et al.Applicability of bivariate calibration algorithm and Vierordt method for simultaneous determination of timolol maleate and brimonidine tartrate in their binary mixture and pharmaceutical dosage form.IJPSR 2014;5:2631–2641.
[16]Sandeep S,Marina K.Spectrophotometric quantitative estimation of atenolol and losartan potassium in bulk drugs and pharmaceutical dosage form.WJPPS 2014;3:1026–1033.
[17]Michael WD.The essence of modern HPLC:advantages, limitations,fundamentals,and opportunities.LCGC 2013;31:472–479.
[18]US EPA,Estimation program interface(EPI)Suite,Nov 13, 2006.
[19]Teeranachaideekul V,Souto EB,Junyaprasert VB,et al. Encapsulation of ascorbyl palmitate in nanostructured lipid carriers NLC–effects of formulation parameters on physicochemical stability.Int J Pharm 2007;340:198–206.
[20]Taupitz T,Klein S.Can biorelevant media be simplifed by using SLS and Tween 80 to replace bile compounds?Todd J 2010;4:30–37.
[21]Garud A,Singh D,Garud N.Solid lipid nanoparticles(SLN): method,characterization and applications.Int Curr Pharm J 2012;1:384–393.
[22]Loxley A.Solid lipid nanoparticles for the delivery of pharmaceutical actives.Drug Del Techno 2009;9:20.
[23]Fang JU,Fang CL,Liu CH,et al.Lipid nanoparticles as vehicles for topical psoralen delivery:solid lipid nanoparticles(SLN)versus nanostructured lipid carriers (NLC).Eur J Pharm Biopharm 2008;70:633–640.
[24]Yuan H,Wang LL,Du YZ,et al.Preparation and characteristics of nanostructured lipid carriers for controlreleasing progesterone by melt-emulsifcation.Colloids Surf B Biointerfaces 2007;60:174–179.
[25]Beckett AH,Stenlake JB.Practical pharmaceutical chemistry. 4th ed.New Delhi:CBS Publishers and Distributors;1997.p. 282–307.
[26]ICH Harmonized Tripartite Guideline,Validation of analytical procedures:text and methodology,Q2(R1),current step 4 version,parent guidelines on methodology;November 2005.
[27]Monteagudo E,Gándola L,González Y,et al.Development, characterization,and in vitro evaluation of tamoxifen microemulsions.J Drug Del 2012;1–11.
[28]Karpin´ska J,Mikołuc´B,Motkowski R,et al.HPLC method for simultaneous determination of retinol,alpha-tocopherol and coenzyme Q10 in human plasma.J Pharm Biomed Anal 2006;18:232–236.
[29]Shrikrishna B,Vinod P,Patil RN,et al.Validation of simple and rapid UV-spectrophotometric method with stress degradation study for sildenafl citrate.Res J Pharm Tech 2012;5:214–218.
*< class="emphasis_italic">Corresponding author.
.Department of Pharmaceutics and Industrial Pharmacy,Faculty of Pharmacy,Helwan,University,Ain Helwan, POB 11795,Cairo,Egypt.Tel.:+201147162722;fax:+2025541601.
E-mail address:emansaddar@hotmail.com(E.S.El-Leithy).
Peer review under responsibility of Shenyang Pharmaceutical University.
http://dx.doi.org/10.1016/j.ajps.2016.02.005
1818-0876/©2016 Production and hosting by Elsevier B.V.on behalf of Shenyang Pharmaceutical University.This is an open access article under the CC BY-NC-ND license(http://creativecommons.org/licenses/by-nc-nd/4.0/).
猜你喜欢
文史春秋(2022年5期)2022-07-18
民间故事选刊(2022年5期)2022-03-17
黄河之声(2020年11期)2020-07-16
文苑(2019年20期)2019-11-20
文苑·经典美文(2019年10期)2019-10-16
音乐天地(音乐创作版)(2017年3期)2017-07-18
公民与法治(2016年11期)2016-05-17
大众考古(2015年12期)2015-06-26
 Asian Journal of Pharmacentical Sciences2016年2期
- Asian Journal of Pharmacentical Sciences的其它文章
- Preparation and characterization of solidifed oleanolic acid–phospholipid complex aiming to improve the dissolution of oleanolic acid
- Development of a topical ointment of betamethasone dipropionate loaded nanostructured lipid carrier
- Supersaturation induced by Itraconazole/Soluplus®micelles provided high GI absorption in vivo
- Quality assessment of Chrysanthemum indicum Flower by simultaneous quantifcation of six major ingredients using a single reference standard combined with HPLC fngerprint analysis
- Rapid and sensitive analysis of melatonin by LC-MS/MS and its application to pharmacokinetic study in dogs
- Effect of process parameters on the recrystallization and size control of puerarin using the supercritical fuid antisolvent process