
Design and experiment on real-time monitoring system of wheat seeding
2017-02-17 07:35LuCaiyunFuWeiqiangZhaoChunjiangMeiHeboMengZhijunDongJianjunGaoNanaWangXiuLiLiwei
农业工程学报 2017年2期
Lu Caiyun, Fu Weiqiang, Zhao Chunjiang, Mei Hebo, Meng Zhijun, Dong Jianjun, Gao Nana, Wang Xiu, Li Liwei
Design and experiment on real-time monitoring system of wheat seeding
Lu Caiyun, Fu Weiqiang, Zhao Chunjiang※, Mei Hebo, Meng Zhijun, Dong Jianjun, Gao Nana, Wang Xiu, Li Liwei
(1.100097; 2.100097)
To monitor wheat planting performance on real time, a real-time monitoring system of wheat planting performance based on CAN bus was designed. The general structure of the system was elaborate, the hardware and software of the system was designed and the field experiment was conducted. The system included sensor unit for signal collecting, monitoring module, Controller Area Network (CAN) module and terminal, and could monitor the status of seed tube, working speed, rotation velocity of seed shaft. Photoelectric sensor was used to convert quantities of seed tube status into voltage signals, and hall sensor was used to convert quantities of wheel axis rotation velocity into pulse signals. Monitoring module judge the status of seed tube (normal, blocked and missing), and calculate the rotation velocity of wheel axis and seed shaft based on the signals output by sensors. At the same time, monitoring module calculate working speed according to the rotation velocity of wheel axis information. Then the information obtained by monitoring module was uploaded to terminal by CAN bus and displayed on real time on the terminal. The result of the experiment showed that there was no false alarm at the working speed of 10 km/h, the monitoring accuracy of seed tube fault status was >98%, blocked alarm response time <0.2 s, missing alarm response time <0.5 s. The system worked reliably and had a strong ability to anti-dusting and anti-vibration, and effectively monitored wheat planting performance.
sensors; design; crops; wheat planting; real-time monitoring system; photoelectric sensor; seed tube status; working speed
0 Introduction
Precision planting is the key component of precision agriculture[1-3]and precision planter is the most important equipment for precision planting[4]. The process of precision planting was hermetic. It’s hard to accurately monitor the planting performance, such as lack of seeds, fault of metering, and so on, especially for large-scale planters. Bad performance will result in large area of missing planting due to great speed and large planting width[5-9]. Therefore, real-time monitoring system used on the planter would be significant.
The research on monitoring system of precision planting started from 1940s in the world, and amount of systems were developed[10-15], especially as the development of electronic information technology. China also researched a series of monitoring system, mainly relies on the technologies of photoelectric, capacitance, polyvinylidence fluoride (PVDF) and computer vision, etc.[16-21], such as piezoelectric sensor developed by Wang et al.[22], which could convert fall process into electric quantity, and detect planting parameters; Ji et al[23]designed a monitoring system for working performance of no-tillage precision seeder, which used a sensor based on photoelectricity induction of infrared reflection; fault monitoring system for corn precision planter was developed by Qi et al[24], in which a capacitive sensor was used to monitor the seed flow without changing the track of a precision planter; precision planter monitoring system based on capacitance developed by Zhou et al[25], the system converts variation of capacitance into frequency, and the frequency is measured to obtain the variation of capacitance; corn seeding quality monitoring system using PVDF sensor was developed by Huang et al[26]; Navid et al[27-29]evaluated seed metering device using image processing method. Photoelectric sensor has a simple structure and high response speed, however, its performance is apt to be affected by dust; capacitance sensor is apt to affect by temperature, and its stability performance fails to reach the requirement of field operation; computer vision methods is strict to detecting environment, which restricts its application in actual production[30]. From the actual application, photoelectric sensor is widely used due to the stability and low cost.
Traditional photoelectric sensor is apt to be affected by dust, to solve the problem, a new photoelectric sensor with reasonable allocation of photoelectric elements and analog output was designed to improve monitoring accuracy and reliability. Based on the new photoelectric sensor, a real-time monitoring system of wheat planting performance based on Controller Area Network (CAN) bus was designed to monitor wheat planting performance and the field experiment of monitoring performance was conducted.
1 System design
1.1 General system design
Real-time monitoring system of wheat planting performance was consist of sensor unit for signal collecting, monitoring module, CAN bus module and terminal. Sensor unit for signal collecting contained photoelectric sensor for detecting seed tube status and hall sensor for detecting rotation velocity of ground wheel (Fig.1).
Photoelectric sensor was used to monitor the status of the seed tube. It was the core of the real-time monitoring system, therefore its design directly determined the performance of the real-time monitoring system. There were three status of the seed tube: 1) normal planting: seeds passed the seed tube normally; 2) missing planting: no seeds passed the seed tube; 3) blocked planting: seeds were blocked in the seed tube, and could not fall into the field.
Hall sensor was used to monitor rotation velocity of ground wheel axis, which helped to judge the planter was planting or not. And the photoelectric sensor only worked when the rotation velocity of ground wheel was higher than the threshold value. The hall sensor was installed near the ground wheel, a certain amount of magnets were installed on the hub of the ground wheel. When the ground wheel rotated, the hall sensor output a pulse signal each time passed by the magnets. According to periodic method, the rotation velocity of the ground wheel and the working speed were calculated by the formula
Wherewas rotation velocity of the ground wheel, r/min;was working speed, km/h;was number of pulse signals;was time forpulse signals, s;was the number of magnet on the ground wheel;was radius of the ground wheel, m.
Monitoring module was used to judge the status of seed tube and calculate the rotation velocity of ground wheel and seed shaft based on the voltage pulse signals output by sensors. At the same time, monitoring module calculated working speed with the rotation velocity of wheel axis information. Data was transferred through CAN bus to the monitoring terminal.
CAN bus module was used to communicate between monitoring module and monitoring terminal. In the research, CAN communication protocol was designed to ensure the instantaneity and reliability of data communication through distributed control structure based on ISO 11783.
Monitoring terminal, installed in the tractor cab, was used to display the parameters uploaded from the monitoring module, including seed tube status, working speed and seed shaft rotation velocity, etc., when the seed tube was abnormal, an alarm would be given.
1.2 System hardware design
1.2.1 Wheat planter
A local wheat planter (2BFX-24 planter produced by Shijiazhaung Agricultural Machinery CO., LTD) was used to connect to the planter system for precision planting. The planting shaft was driven by the ground wheel through a transmission device of sprocket and chains. According to formula (1), rotation velocity of planting shaft was calculated by the formula
Where1was rotation velocity of planting shaft, r/min;was the transmission ratio between planting shaft and ground wheel axis.
1.2.2 Photoelectric sensor
The photoelectric sensor was installed in the middle-lower part of the seed tube (Fig.2), and one sensor was used on each tube, for the 2BFX-24 planter used in the study, 24 photoelectric sensors were used.
A photoelectric sensor was composed of 4 GaAs infrared LEDs and 4 infrared electric triodes. Due to smaller wheat seeds, correlation light path was used to ensure the infrared electric triode received enough light from GaAs infrared LED. The LEDs and electric triodes were uniformly distributed around the seed tube (Fig.3) to monitor the whole zone of the cross section of seed tube.
To ensure each seed could be detected by the sensor, the diameter of light beam was designed and the principle was shown in Fig.4. For convenient calculation, the seed tube and wheat seed was put in thecoordinate system, and wheat seed was assumed as ellipse, the long axis direction of wheat seed asaxis, the focus of wheat seed as origin O; hypothetical parameters was shown as following.
According to elliptic equation, the formula of wheat seed could be shown as
Formula of line 3 could be shown as
According to tangent principle
Where,was the abscissa and ordinate of point on both seed outline and line 3;was the radius of long axis for wheat seed outline, mm;was the radius of short axis for wheat seed outline, mm;was the angle between two adjacent center lines, (°), and the lines symmetric distributed on two sides of x, mm axis;was the distance between pointand origin.
After calculation, the following formula was obtained
For the quadratic equation
After calculation, the following formula was obtained
Where Δ was the discriminant of quadratic equation (7);was the distance between pointand, mm;1 was the diameter of seed tube, mm.
According to Sine Law
Wherewas the distance between center line of light beam and tangent line of seed outline, mm.
In the research, 4 LEDs and 4 electric triodes was used, so=45°; Diameter of seed tube used on 2BFX-24 planter was1=30 mm. 500 seeds was measures, and the least length and width was 6.4 and 3.6 mm, respectively, which means=3.2 mm, and=1.8 mm. Thus,=2.45 mm.
From the structure, we can know that the largest distance between line 2 and wheat seed 5 occurred at the analyzed situation. In the situation,is the least distance between center line of light beam and seed, so to ensure all wheat seeds detected by the sensor, the beam diameter had to satisfy the formula (12). In the study, beam diameter was designed as=5 mm.
Wherewas the diameter of light beam, mm.
To reduce the effects of dust, analog output was used. For analog output photoelectric sensor, dust decreased output voltage, however, output voltage was stable after dust concentration between in and out of the seed tube getting a dynamic equilibrium. This kind of photoelectric sensor had the advantages of simple structure, low cost, fast response, surveillance accuracy and strong ability to anti-dusting and anti-vibration, and effectively monitored wheat planting performance.
1.2.3 Monitoring module circuit
In the design of monitoring module, AT90CAN128 SCM produced by Atmel Company was used as micro CPU chip, which had advance RISC (Reduced Instruction Set Computer) structure, high performance with 1 MIPS/MHz and low power consumption. The SCM owned ADC function and CAN controller, which satisfied the design requirements. Photoelectric sensors were used to monitor seed tube status, and hall sensor was used to monitor working speed. The monitoring module circuit was composed of signal collecting circuit for photoelectric sensors, working speed monitoring circuit for hall sensor, and CAN communication circuit (Fig.5).
1) Signal collecting circuit diagram for photoelectric sensors
Signals from photoelectric sensors was selected by CD4067 analogue switch, passed voltage following circuit and first order RC low-pass filter circuit, and transferred to ADC port of AT90CAN128 SCM.
The photoelectric sensor included 4 GaAs infrared LEDs and 4 infrared electric triodes; the circuit was shown in Fig.5. R1-R4 were the limiting resistors for GaAs infrared LEDs, which reduced the current passed through the LEDs to avoid damage; R5-R8 were the load resistors for infrared electric triodes, which affected the accuracy and sensitivity.1-4 were the voltage output by infrared electric triodes, and the voltage output by photoelectric sensor (out) was the output voltage of1,2,3 and4 in parallel. According to Kirchhoff's current law, the voltage output by photoelectric sensor was calculated by the formula:
Whereoutwas the voltage output by photoelectric sensor, V;1-4 were the voltage output by infrared electric triodes, V.
Formula (13) showed that the voltage output by photoelectric sensor was the average of the voltages output by the 4 infrared electric triodes.
At the blocked planting status, the light from GaAs infrared LEDs was completely blocked, then the voltage output by photoelectric sensor was closed to 0 V; at the missing planting status, no seeds passed though the sensor, and the light from GaAs infrared LEDs was almost completely received by the infrared electric triodes, then the voltage output by photoelectric sensor was closed to 1.5 V; at the normal planting status, part of the light from GaAs infrared LEDs was blocked by the seeds, and else light received by the infrared electric triodes, then the voltage output by photoelectric sensor assumed disciplinary changes.
Due to analog output, the voltage would reduce in a certain time due to the dust; however, the voltage would not be affected by the dust after the dust concentration up to the dynamic equilibrium between the seed tube and outside.
In this study, 2BFX-24 needed 24 photoelectric sensors, so 24 ADC ports were needed; however, AT90CAN128 SCM had only 8 ADC ports. Therefore, 2 CD4067 analogue switches were used to connect between AT90CAN128 SCM and photoelectric sensors, and each CD4067 analogue switch connected 12 photoelectric sensors.
LM324AD passed voltage following circuit had the function of impedance matching and isolation buffer; first order RC low-pass filter circuit was used to eliminate with decoupling capacitance.
2) Working speed monitoring circuit diagram for hall sensor
The pulse signals produced by hall sensor transferred to AT90CAN128 SCM by external interrupt and timer method through PE4 port. Each pulse signal produced an external interrupt, and timer 1 was used to calculate the time ofpulse signals. The timer 1 couldn’t monitor pulse signals for a long time meant the working speed was 0, and the planter stopped working.
3) CAN communication circuit diagram
CTM8251T was selected to achieve CAN communication. Considered that CTM8251T had integrated all necessary CAN isolation, receiving and sending devices, the CAN communication circuit was simple. TXD connected to the CANTX port and RXD connected to the CANRX port of AT90CAN128 SCM, and CAN controller in the AT90CAN128 SCM controlled the receiving and sending of CAN information; CANH connected to the CANH of CAN bus, and CANL connected to the CANL of CAN bus.
1.2.4 Monitoring terminal circuit
In the design of monitoring terminal, AT91SAM7X256 SCM produced by Atmel Company was used as micro CPU chip. The SCM owned CAN controller, which satisfied the design requirements. The monitoring terminal was used to realize the function of man-machine switching, and its circuit was composed of LCD display circuit, button circuit, and alarm circuit, CAN communication circuit and EEPROM memory circuit (Fig.6).
1) LCD display circuit. LCD19264 display module was used to show characters and diagrams, and it was readable in bright light. To satisfy the level match with AT91SAM7X256 SCM, 2 SN74LVC4245 two-way level conversion chips were used to realize the conversion of voltage between 5 V and 3.3 V. A SN74LVC4245 two-way level conversion chip was connected to PB19-PB26 ports of AT91SAM7X256 SCM, used to convert level of data port; another SN74LVC4245 two-way level conversion chip was connected to PB0-PB3, PB7, PB9, PB12 and PA22 ports of AT91SAM7X256 SCM, used to convert level of control port. V0 and VEE matched to control the backlight and display contrast.
2) Button circuit. The buttons contained 3 function buttons (SELECT, CANCEL, SET) and 4 direction buttons (UP, DOWN, LEFT, RIGHT). S1, S2, S3, S4, S5, S6, S7 represented DOWN, UP, SET, RIGHT, CANCEL, SELECT, LEFT and connected to PA25, PA24, PA7, PA6, PA5, PA30, PA23 ports of AT91SAM7X256 SCM respectively. When press the button, low level was output from the port.
3) Alarm circuit. In the process of planting, buzzer was controlled by the level output from PA16 port of AT91SAM7X256 SCM and buzzer alarmed when the PA port at high level.
4) CAN communication circuit. Monitoring module sent seed tube status and ground wheel velocity to monitoring terminal through CAN bus, therefore a CAN receiving and sending circuit was needed. In the study, PCA82C250 was selected to achieve CAN communication. TXD connected to the CANTX port and RXD connected to the CANRX port of AT91SAM7X256 SCM; CANH connected to the CANH of CAN bus, and CANL connected to the CANL of CAN bus.
5) EEPROM memory circuit. CAT24C256 memory chip developed by Atmel was used to realize reading and writing, which had a good cooperation with AT91SAM7X256 SCM. SDA connected to the PA10 (TWD) port and SCL connected to the PA11 (TWCK) port of AT91SAM7X256 SCM.
1.3 System software design
The system software included monitoring module program and monitoring terminal program. Monitoring module program was written in C language, and debugged in AVR Studio; monitoring terminal program was written in C language under the Keil uVision4 for ARM v4.23 environment, had the functions of LCD display, button operation, alarm, CAN communication and memory. Interface for on real-time monitoring system of wheat planting performance was shown in Fig.7.
1.3.1 Monitoring module program
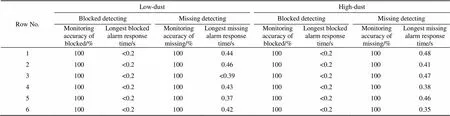
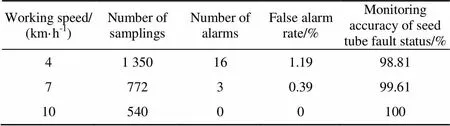
Monitoring module program included seed tube status monitoring program (Fig.8a) and ground wheel velocity monitoring program (Fig.8b). Before working, system was initialized. For seed tube status monitoring program, filtering, threshold comparison and judgment continuity were used to monitor the seed tube status. First, collect sensor signaltimes, and the voltage for each sampling wasU(∈{1,2,…,}). Second, signals were filtered and compared with blocked planting thresholdblocked, if the voltage of×(was blocked coefficient, 0<≤1) samplings were all smaller thanblocked, the seed tube was blocked planting; Or continue to third. Third, signals were filtered and obtained the maximum voltage difference ofsamplings asmax=max–min. Fourth, repeat step first to step third, ifmaxwas smaller than the missing thresholdmissingfor each time, which demonstrated that the signal changes was small in a long time, then the seed tube status was missing planting; Or it was normal planting. Whenmax a. Seed tube status monitoring program flow chart b. Ground wheel velocity monitoring program flow chart Note:Uwas the value ofoutread by the terminal for the numbertime, V;maxandminwere the maximum and minimum value among1toU, V;maxwas the difference betweenmaxandmin, V;was amount threshold of continuous missing planting;was amount threshold of continuous normal planting. Fig.8 Monitoring module program flow chart The status was changed to missing planting by occurring more thantimes ofmax For ground wheel velocity monitoring program, external interrupt and timer method were used to monitor ground wheel velocity. Each pulse signal produced by hall sensor occurred an external interrupt, and timer 1 was used to calculate the time ofpulse signals. The timer 1 couldn’t monitor pulse signals for a long time when the working speed was 0. 1.3.2 Monitoring terminal program Before working, system was also initialized. The buzzer alarmed when terminal received abnormal signals (blocked or missing) from any row when the ground wheel velocity was higher than threshold. Otherwise, the buzzer did not alarm. This was because the seeder should stop planting at the edge of the planting rows, and turn to the next planting rows. At the time, ground wheel velocity was much smaller than planting velocity. No seeds passed seed tubes, however, alarm was not need. Aim to solve the problem, judgment of ground wheel velocity was added to the design of terminal program. Meanwhile, the buzzer alarm could be closed by press CANCEL. Monitoring terminal program flow chart was shown in Fig.9. 2.1 Experiment at abnormal planting status To measure the performance of real-time monitoring system at abnormal planting status, an experiment of blocked and missing planting alarm was conducted on test bed for real-time monitoring system of wheat planting performance (Fig.10). The system included 6 rows. The experiment was conducted in low-dust and high-dust conditions separately. During testing, make the velocity of seed shaft at 20 r/min. Artificial blocked and missing planting status was made for 20 times respectively. For blocked detecting, when working stable, artificial blocked seed tube and check if the blocking alarm occurred and record response time of alarm. For missing detecting, when working stable, blocked the head of the seed tube, check if the missing alarm occurred and record response time of alarm. Response time refers to the time interval between signal from sensor sending and alarm from monitoring terminal occurring. The result was shown in Table 1. Table 1 Results of blocked detecting and missing detecting The results demonstrated that the monitoring accuracy of seed tube fault status was 100%, blocked alarm response time <0.2 s, missing alarm response time <0.5 s. 2.2 Experiment at normal planting status To measure the performance of the real-time monitoring system, a field experiment was conducted in Changge, Henan Province. In the process of experiment, select working speed as 4, 7 and 10 km/h, and the working distance was about 1.5 km for each speed. To avoid the alarm due to lack of seeds in the seed box, the box was full of seeds before planting. Recorded number of samplings and number of alarms, and calculated the false alarm rate. The results were shown in Table 2. The results demonstrated that the false alarm rate decreased as the working speed increased, and there was none false alarm when the working speed was up to 10 km/h. The monitoring accuracy of seed tube fault status was >98%. Table 2 Number of alarms and false alarm rate of system in experiment at normal planting status 1) In this study, a real-time monitoring system of wheat planting performance based on CAN bus was designed. Photoelectric sensor was used to monitor seed tube status (normal, blocked and missing), and hall sensor was used to monitor the rotation velocity of wheel axis and seed shaft. The system included sensor unit for signal collecting, monitoring module, CAN module and terminal, and could monitor the status of seed tube, working speed and rotation velocity of seed shaft. The general structure of the system was elaborate, the hardware and software of the system was designed. 2) The result of the experiment showed that there was none false alarm at the working speed of 10 km/h. The monitoring accuracy of seed tube fault status was >98%, blocked alarm response time <0.2 s, missing alarm response time <0.5 s. The system worked reliably and had a strong ability to anti-dusting and anti-vibration, and effectively monitored wheat planting performance. [1] Zhao Chunjiang. Strategy thinking on precision agriculture of China[J]. Agriculture Network Information, 2010(4): 5-8. [2] Chen Jin, Bian Jiang, Li Yaoming, et al. Performance detection experiment of precision seed metering device based on high speed camera system[J]. Transactions of the Chinese Society of Agricultural Engineering (Transactions of the CSAE), 2009, 25(9): 90-95. [3] Zhang Xiangxing, Zhang Jianjun, Xie Shouyong, et al. Seeder detection system of rapeseed based on infrared emitting diode[J]. Journal of Agricultural Mechanization Research, 2012(4): 156-159. [4] Song Peng, Zhang Junxiong, Li Wei, et al. Real-time monitoring system for accuracy of precision seeder[J]. Transactions of the Chinese Society for Agricultural Machiney, 2011, 42(2): 71-74,79. [5] Liao Q X, Deng Z J, Huang H D. Application of the high speed photography checking the precision metering performances[J]. Journal of Huazhong Agricultural University, 2004, 23(5): 570-573. [6] Shi Zhixing, Gao Huanwen. RLD optoelectronic sensor for seeding monitoring[J]. Transactions of the Chinese Society for Agricultural Machinery, 2002, 33(2): 41-43. [7] Zhang X Z, Li M, Meng C. Research and development of precision seeding intelligent monitor[J]. Transactions of the Chinese Society of Agricultural Engineering (Transactions of the CSAE), 2004, 20(2): 136-139. [8] Zhou J F, Li Y, Lu B Y. Monitoring system of precision seeding-machine[J]. Journal of Agricultural Mechanization Research, 2006(6): 37-39. [9] Zhao B, Kuang L H, Zhang W. Seed and fertilizer intelligent gauging and monitoring system of suction precision seeder[J]. Transactions of the Chinese Society of Agricultural Engineering (Transactions of the CSAE), 2010, 26(2): 147-153. [10] Okopnik D L, Falate R. Usage of the DFRobot RB-DFR-49 infrared sensor to detect maize seed passage on a conveyor belt[J]. Computers & Electronics in Agriculture, 2014, 102(1): 106-111. [11] Xia J F, Zhou Y, Zhang P H. Testing technique of precise seed-metering device based on virtual instrument[J]. Transactions of the CSAM, 2009, 40(1): 87-90. [12] Karayel D, Wiesehoff M, Özmerzi A, et al. Laboratory measurement of seed drill seed spacing and velocity of fall of seeds using high-speed camera system[J]. Computers & Electronics in Agriculture, 2006, 50(2): 89-96. [13] Huang Dongyan, Jia Honglei, Qi Yue, et al. Seeding monitor system for planter based on polyvinylidence fluoride piezoelectric film[J]. Transactions of the Chinese Society of Agricultural Engineering (Transactions of the CSAE), 2013, 29(23): 15-22. [14] Hu Shaoxing, Zha Hongbin, Ma Chenglin. Detection method to quality of the seed metering based on the serial of images[J]. Transactions of the Chinese Society for Agricultural Machinery, 2004, 35(1): 52-55, 64. [15] Xia J F, Zhou Y, Zhang P H. The testing technique research of seed absence on precise seed-meter based on virtual instrument[J]. Journal of Huazhong Agricultural University, 2008, 27(4): 540-544. [16] Feng Quan, Li Zhenxiao, Wu Jianmin, et al. Development of dustproof annunciator system for no-tillage planter[J]. Transactions of the Chinese Society for Agricultural Machinery, 2006, 37(9): 68-70. [17] Zhao Liye, Jian Xingdong. Study on optoelectronic sensor for performance detection of a seedmeter[J]. Transactions of the Chinese Society for Agricultural Machinery, 2005, 36(7): 41-43. [18] Zhou Liming, Wang Shumao, Zhang Xiaochao, et al. Seed monitoring system for corn planter based on capacitance signal[J]. Transactions of the Chinese Society of Agricultural Engineering (Transactions of the CSAE), 2012, 28(13): 16-21. [19] Du Ruicheng, Gong Bingcai, Liu Ningning, et al. Design and experiment on intelligent fuzzy monitoring system for corn planters[J]. Int J Agric & Biol Eng, 2013, 6(3): 11-18. [20] Zhou L, Zhang X, Yuan Y. Design of capacitance seed rate sensor of wheat planter[J]. Transactions of the Chinese Society of Agricultural Engineering (Transactions of the CSAE), 2010, 26(10): 99-103. [21] Dou Y C, Ouyang B L, Chen H T. Study on photosensitive-type suction planter monitoring apparatus[J]. Journal of Northeast Agricultural University, 2010, 41(9): 133-136. [22] Wang S C, Xu Q C, Peng C Y, et al. Studies on the measurement of chip microprocessors system of single seed drill[J]. Journal of Huazhong Agricultural University, 1998, 17(1): 96-100. [23] Ji Chao, Chen Xuegeng, Chen Jincheng, et al. Monitoring system for working performance of no-tillage precision seeder[J]. Transactions of the Chinese Society of Agricultural Engineering (Transactions of the CSAE), 2016, 47(8): 1-6. [24] Qi Jiangtao, Jia Honglei, Li Yang, et al. Design and test of fault monitoring system for corn precision planter[J]. Int J Agric & Biol Eng, 2015, 8(6): 13-19. [25] Zhou Liming, Zhang Xiaochao. Monitor system of precision seeder based on capacitive sensor[J]. Journal of Agricultural Mechanization Research, 2009(11): 37-39. [26] Huang Dongyan, Zhu Longtu, Jia Honglei, et al. Remote monitoring system for corn seeding quality based on GPS and GPRS[J]. Transactions of the Chinese Society of Agricultural Engineering (Transactions of the CSAE), 2016, 32(6): 162-168. [27] Navid H, Ebrahimian S, Gassemzadeh H R, et al. Laboratory evaluation of seed metering device using image processing method[J]. Australian Journal of Agricultural Engineering, 2011, 2: 1-4. [28] Wang An, Ding Xiaodi, Ma Xu, et al. Research on the method of seeding quantity detection in potted seedling tray of super rice based on improved shape factor[J]. Transaction of the Chinese Society for Agricultural Machinery, 2015, 46(11): 29-35, 38. [29] Zhang Yaqiu, Wu Wenfu, Wang Gang, et al. Separation of corn seeds images based on threshold changed gradually[J]. Transactions of the Chinese Society of Agricultural Engineering (Transactions of the CSAE), 2011, 27(7): 200-204. [30] Tan Zuting, Ma Xu, Qi Long, et al. Detection and control system of seed-layers thickness for vibration-flow precision seeder[J]. Transactions of the Chinese Society of Agricultural Engineering (Transactions of the CSAE), 2012, 28(21): 10-16. 小麦播种实时监控系统设计与试验 卢彩云,付卫强,赵春江※,梅鹤波,孟志军,董建军,高娜娜,王 秀,李立伟 (1.北京农业智能装备技术研究中心,北京100097; 2. 北京农业信息技术研究中心,北京 100097) 为实现小麦播种作业性能实时监控,设计了一种基于CAN总线的小麦精密播种机播种实时监控系统,阐述了系统总体结构,设计了系统硬件和软件,并进行了田间试验。该系统包括传感器信号采集单元、播种监测模块、CAN模块和播种监测终端,能够实时监测种管状态、机具前进速度和排种轴转速。采用光电传感器和霍尔传感器分别检测排种管落种状态和地轮转速并输出电压或脉冲信号,播种监测模块根据传感器输出的信号,判断排种管播种状态(正常、堵塞和空管),计算出地轮转速和排种轴转速,并计算出机具前进速度,以上信息通过CAN总线传输给播种监测终端并实时显示。试验结果表明,该系统故障状态监测准确率为>98%,堵塞响应时间<0.2 s,空管报警响应时间<0.5 s。系统工作稳定可靠,抗尘、抗震能力强,能够有效监测小麦播种作业性能。该研究成果能满足小麦播种性能实时监测要求,有助于提高小麦播种作业质量。 传感器;设计;农作物;小麦播种;实时监测系统;光电传感器;种管状态;前进速度 10.11975/j.issn.1002-6819.2017.02.005 S232.3 A 1002-6819(2017)-02-0032-09 2016-08-24 Revised date:2016-11-18 National High-Tech Research and Development Program of China (863) (2013AA102308); National Key Research and Development Plan (2016YFD0200607); Anhui Science and Technology Major Project (15czz03134); Postdoctoral Science Foundation of Beijing Academy of Agriculture and Forestry Sciences of China (2014002) Zhao Chunjiang, Male, Professor, the major research direction is intelligent agricultural equipment. Beijing Beijing Research Center of Intelligent Equipment for Agriculture, 100097, China. Email:zhaocj@nercita.org.cn Biography:Lu Caiyun, Female, Postdoctor, the major research direction is intelligent agricultural equipment. Beijing Beijing Research Center of Intelligent Equipment for Agriculture, 100097, China. Email:lucy@nercita.org.cn Lu Caiyun, Fu Weiqiang, Zhao Chunjiang, Mei Hebo, Meng Zhijun, Dong Jianjun, Gao Nana, Wang Xiu, Li Liwei. Design and experiment on real-time monitoring system of wheat seeding[J]. Transactions of the Chinese Society of Agricultural Engineering (Transactions of the CSAE), 2017, 33(2): 32-40. (in English with Chinese abstract) doi:10.11975/j.issn.1002-6819.2017.02.005 http://www.tcsae.org 卢彩云,付卫强,赵春江,梅鹤波,孟志军,董建军,高娜娜,王 秀,李立伟. 小麦播种实时监控系统设计与试验[J]. 农业工程学报,2017,33(2):32-40. doi:10.11975/j.issn.1002-6819.2017.02.005 http://www.tcsae.org2 Experiments and results
3 Conclusions
猜你喜欢
今日农业(2022年16期)2022-11-09
疯狂英语·新读写(2021年10期)2021-12-07
金桥(2021年10期)2021-11-05
今日农业(2021年13期)2021-08-14
作文小学中年级(2020年4期)2020-06-11
小学生作文(低年级适用)(2019年5期)2019-07-26
新世纪智能(英语备考)(2019年4期)2019-06-26
铁道通信信号(2019年11期)2019-05-21
读友·少年文学(清雅版)(2018年12期)2018-04-04
山东青年(2016年3期)2016-02-28
