
The effect of water quality on tip vortex cavitation inception *
2017-03-14 07:06LingxinZhang张凌新LinyaChen陈林娅XiaoxingPeng彭晓星XuemingShao邵雪明
水动力学研究与进展 B辑 2017年6期
Ling-xin Zhang (张凌新), Lin-ya Chen (陈林娅), Xiao-xing Peng (彭晓星), Xue-ming Shao (邵雪明)
1. State Key Laboratory of Fluid Power and Mechatronic System, Department of Mechanics, Ζhejiang University, Hangzhou 310027, China, E-mail: zhanglingxin@zju.edu.cn
2. Key Laboratory of Soft Machines and Smart Devices of Ζhejiang Province, Hangzhou 310027, China
3. National Key Laboratory on Ship Vibration and Noise, China Ship Scientific Research Center,
Wuxi 214082, China
Introduction
Tip vortex cavitation is one of important cavitation types on marine propeller and hydraulic machinery. Compared with the wet flow, tip vortex cavitation can cause significant noise and extra vibration[1-3].Trying to accurately predict the occurrence of tip vortex cavitation (TVC), many researchers studied the effects of flow parameters on the inception of TVC,and proposed a classic formula to predict the inception cavitation number. However, the inception of TVC is very sensitive to the water quality, leading to the big uncertainty in predicting the inception. Up to now, the quantitative effect of water quality on the inception of TVC is still unclear. Trying to avoid the occurrence of tip vortex cavitation, accurate prediction of tip vortex cavitaion inception is a pressing need in engineering.
Previously, Ardnt et al.[4], Stinebring et al.[5]and Fruman and Dugue[6]studied the features of the flow field around the tips of 3-D hydrofoils. Flows of tip vortex cavitation were observed and measured including inception cavitation number at various angles of attack and Reynolds number. Before the appearance of cavitation, some kinds of ideal vortex models such as Rankine vortex can describe the vortical flows with two main parameters, vortex intensity and vortex core radius. They[7,8]found that strengths of tip vortex mainly depend on circulation and have a positive correlation with lift coefficient of foils. They also found vortex core radius of tip vortex is in connection with thickness of boundary layer of foils which is related to the Reynolds number. Tip vortex cavitation often occurs at vortex center firstly, so vortex model can provide lowest pressure at vortex center to determine whether it has reached the critical condition for cavitation. On the basis of these studies, a predicttion model of inception of tip vortex cavitation is established[9]

whereiσ is tip vortex cavitation inception number,K is an empirical coefficient,LC is lift coefficient,Re is Reynolds number and =0.4m . Apparently this prediction model can judge theoretically whether tip vortex cavitation occurs, for which tip vortex cavitation inception index can be derived from flow parameters directly. On the other hand, this prediction model is also the theoretical basis to extrapolate results of model experiments to full-scale. However,this prediction model is found in many following studies[10,11]to be short of universality.
Up to now, researchers agree that water quality also has an important effect on tip vortex cavitation inception[1,12]. In most cases, lowest pressure in water reaching the saturated vapor pressure will not immediately lead to cavitation. The critical pressure for tip vortex cavitation is always lower than saturated vapor pressure especially when the size of free stream nuclei is small. As we know, for cavitation experiments in tunnels the content must be depressurized and from which most gas be eliminated first, and the size of nuclei in water must be small. Actually hydrofoils work in natural water, such as sea, containing a great number of nuclei. Obviously, a significant difference of water quality exists between these two conditions.The effect of water quality should be evaluated accurately to avoid dilemma of extrapolation of model experiments to full-scale. But the effect of water quality has been expressed in the providing prediction model since this model considers the vortical flows only. Unfortunately there is a lack of appropriate methods to quantitatively evaluate the effect of water quality until today[13]. Even though macro cavitation model is widely used in the study of many cavitation phenomena, it is not suitable for tip vortex cavitation inception due to the effect of water quality had not been considered by all existing cavitation model[14-16].Therefore, it is urgent to develop a theory and model suitable for prediction of tip vortex cavitation inception.
Presently experimental and numerical methods in addition to theory of bubble dynamics can be employed to study nuclei. In the experiments, to get nuclei population requires accurate measuring technology, such as holography, laser interferometric imaging[17]and a Venturi approach. In general, these methods enable us to count smallest nuclei in micron scale. Based on bubble dynamics, critical pressure below which a nucleus will grow explosively of every nucleus can be obtained. For water with nuclei in only one size, it means the effect of water quality can be quantified by tensile strength of a nucleus. According to nuclei spectrum, nuclei distribute in a large scale range with different population in real water. In recent years, Hsiao and Chahine[18,19], park et al.[20]numerically studied the movement of nuclei in vortical flows.Zhang et al.[21]summarized these researches. In order to promote further understanding of the characteristic of motion of nuclei, Zhang et al.[21], Oweis et al.[22],Cui et al.[23], have performed theoretical analysis and numerical simulation for trajectory and capture time of nuclei in ideal vortex models. Outside the vortex core, Oweis got the capture time of nuclei analytically ignoring radial acceleration. The results differ a lot from simulations. Inside the vortex core, Zhang et al.got the capture time of nuclei in the vortex core. Even though their results have a satisfying agreement compared with simulation, the form of solution is complicated. A complete and concise theory to describe the motion of nuclei in the whole vortex still lacks.
In the present work, firstly we have a theoretical analysis of motion of nuclei in an ideal vortex-Rankine vortex. By simplification, a complete and concise solution for the positions of nuclei in the vortex changes over time is presented. In other words,capture time of every nucleus can be calculated from the solution directly. Numerical simulation is employed to validate the effectiveness. According to the experimental data[24]provided by our cooperator,China Ship Scientific Research Center, we can get vortex circulation Γ and vortex core sizecr to describe the vortical flow by Rankine vortex model.Nuclei are distributed in this flow based on nuclei spectrum measured in the experiment. Now we can get the capture time of these nuclei quickly with theoretical solution. The nucleus that will grow explosively first is selected according to certain filter condition. Further, tensile strength of this nucleus will be used to quantify the effect of water quality and correct the tip vortex cavitation inception number.Finally we compare this change of cavitation inception number with experimental results to validate the whole procedure.
1. Mathematical model
1.1 Rankine vortex model
The ideal Rankine vortex model with vortex circulation Γ and vortex core sizecr describes the vortical flow, i.e., tangential velocity and pressure are as follows:

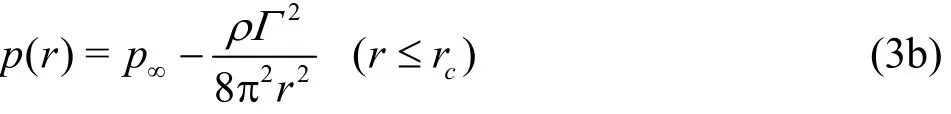
where p∞is the infinity hydrostatic pressure, ρ is the fluid density.
1.2 Spherical bubble dynamics model
The dynamics of nuclei is modeled in a Lagrangian frame to trace the migration of nuclei in the ideal vortex flow. The position and momentum equations of nuclei are described as follows:

where ρ is the nucleus density,bV is the nucleus volume,bu is the nucleus velocity, u is the undisturbed flow velocity at the nucleus center. The terms on the right side represent buoyancy, pressure gradient induced force, drag force, lift force, added mass force and force due to volume changes respectively.
1.3 Analytical solution of motion of nucleus in the vortex
In our last paper[21], we have mentioned that pressure gradient induced force, drag force and force due to volume changes play a leading role with regard to the motion of nuclei. So other terms of forces can be omitted first. When referring to the force due to volume changes, it has little impact on nuclei before it grows explosively. Since we care more about the capture time of nuclei before it is captured and grows explosively, the force due to volume changes also can be omitted. Ignoring radial acceleration of nuclei,pressure gradient induced force and drag force are in balance

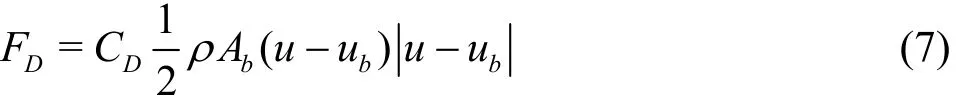
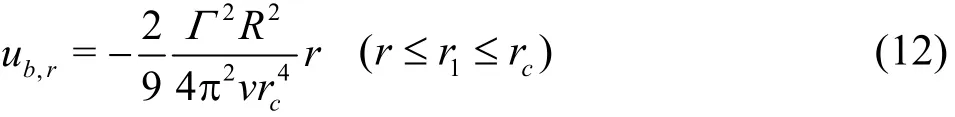
Pressure gradient ▽p can be obtained by taking the gradient of pressure (Eq.(3)) or Navier-Stokes in cylindrical coordinate system, ▽p = u(r) /r . The drag force acting in the direction opposite to the relative velocity is given by in which Ab=πR2is the area of nucleus’s cross-section with the nucleus radius R and drag coefficient CDgiven by Stokes formula CD=24/ R eb, where Reynolds number defined asReb=2ρ Ru-ub/μ with μ is the fluid dynamic viscosity. Decomposing Eq.(6) in radial direction, u has no component in this direction, we have Combining tangential velocity outside Rankine vortex core (Eq.(2)) and Eq.(8), velocity of nuclei outside vortex core is


Capture time1t from release position0r of nuclei to a random position r outside vortex core can be got by
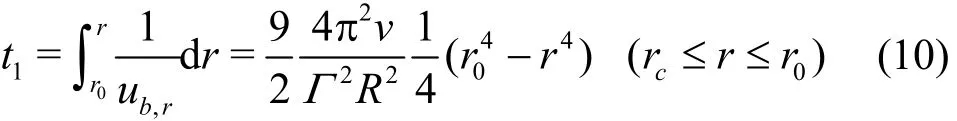
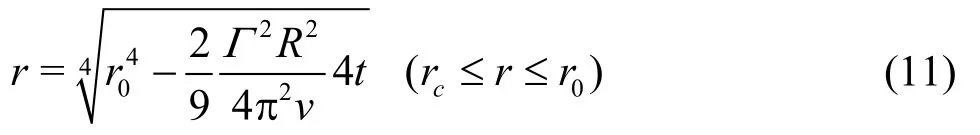
Meanwhile radial positions of nuclei outside vortex core change over time as
Similarly combining tangential velocity inside Rankine vortex core (Eq.(2)) and Eq.(8), velocity of nuclei inside vortex core is
Capture time2t from release position1r of nuclei inside vortex core to a random position r near vortex center can be got by
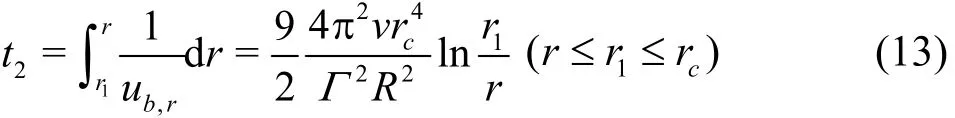
and meanwhile radial positions of nuclei inside vortex core change over time as

Numerical simulations are executed to validate rationality of analytical solution with simplification.To describe a Rankine vortex, parameters are set as vortex circulation Γ =0.29 m2/s and vortex core size rc=5.6 mm. A nucleus with radius R = 56μ m is released in the vortex. Release positions of this nucleus are shown in Table 1. Results of analytical solutions outside and inside the vortex core are in red line (Eq.(11)) and green line(Eq.(14)) respectively,and results of simulations is in blue line as shown in Fig.1. Numerical simulation and analytical solutions are consistent, so capture time can be obtained from solutions directly. It will help to choose quickly the nucleus which is going to grow explosively first without miscellaneous simulations.
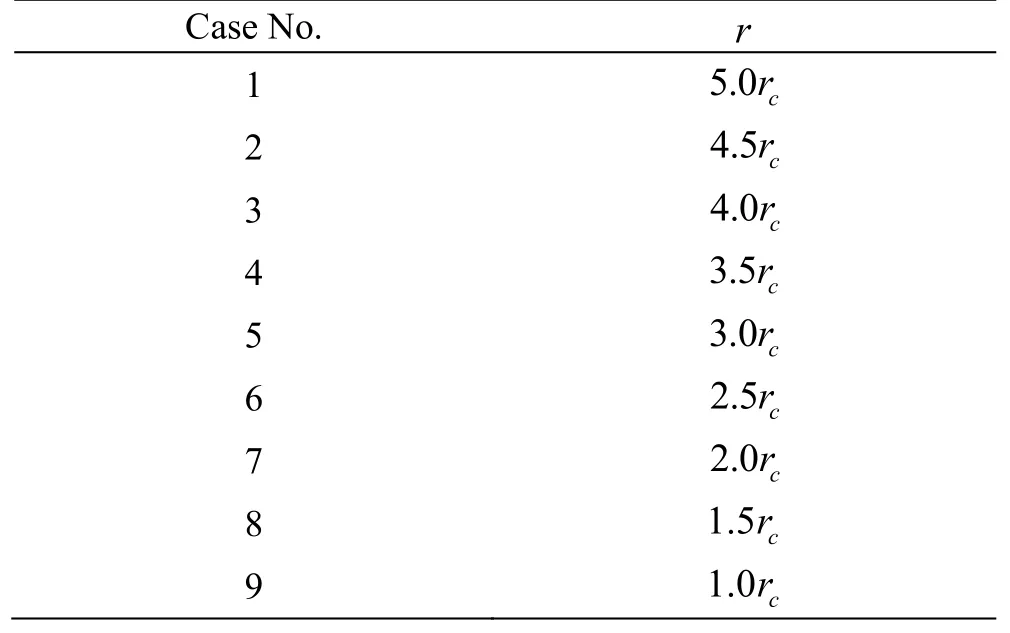
Table 1 Release positions of nuclei entering into a Rankine vortex
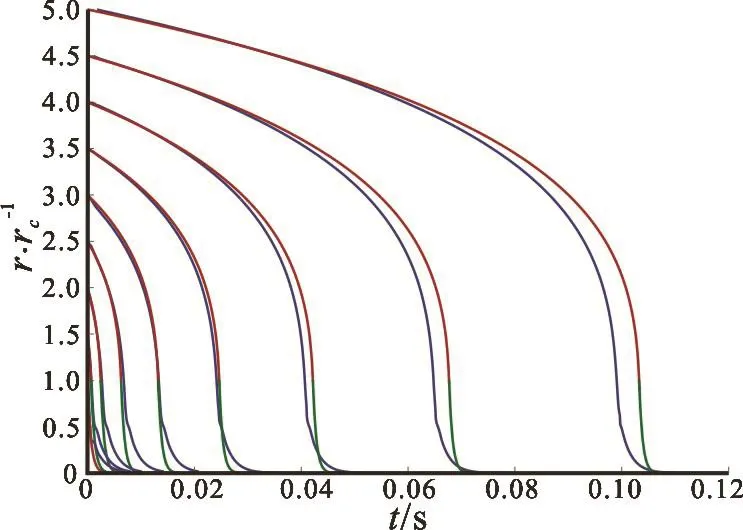
Fig.1 (Color online) Radial positions of the nucleus changes over time with analytical solutions outside the vortex core (red line), inside the vortex core (green line) and simulations (blue line)
2. Analysis of experimental data
In this section, the effect of water quality on tip vortex cavitation inception number will be studied quantitatively according to the analytical solution in Section 1 and experimental data provided by China Ship Scientific Research Center (CSSRC).
The experiments were conducted in the cavitation mechanism2tunnel with a square test cross section of 225×225 mm. The maximum incoming velocity of this section can be up to 25 m/s. There is a large degassing tank installed downstream of the test section to control aircontentof water. Thealso equipped with a nucleiseeding to provide different water quality with different nuclei distributions. Meanwhile laser interferometric technique can measure nuclei distribution.
A hydrofoil of elliptic planform in a modified NACA 662-415 airfoil section with an a=0.8 meanline was examined. The model has a root chord c of 94.2 mm and a half span b of 112.5 mm with an aspect ratio of 3. The foil was installed at horizontal center of the test section with the tip at the centreline of the test section with an attack angle 7o.Other details of the experimental setup can be found in Ref.[24].
With uniform incoming flow velocity V0=5 m/s, experimental data include tangential velocity profiles(Fig.2) at different stations along the vortex path downstream the tip and nuclei spectra (Fig.3(a))in three nuclei-seeding pressures, i.e., 0.4 MPa, 0.6 MPa,0.8 MPa and the corresponding tip vortex cavitation inception number (Fig.3(b)). To describe a Rankine vortex, vortex circulation Γ and vortex core radius rcare obtained from the tangential velocity profiles as follows: rc=0.7 mm is the radial distance between zero and maximum tangential velocity and Γ=0.011m2/s is line integral of the maximum tangential velocity along the vortex core. Next nuclei are released into the Rankine vortex according to nuclei spectra.
Specific to the first case with 0.4 MPa nucleiseeding pressure, measured nuclei size Dband corresponding number density N are listed in the first and second column of Table 2. For other columns in Table 2, radius of nuclei in the third column are half of Dbin the first column, and release positions r0of nuclei in the fourth column are obtained as follows

Compared with the vortex core radius, we can see that nuclei are all released outside the vortex core in this case, so motion time of nuclei from release position tocr, namely1t in the fifth column, can be computed by Eq.(10). Besides, we find that motion time2t of nuclei fromcr to r inside the vortex core is much smaller than1t, thus capture time of nuclei t in the last column can be estimated as t≈t1.
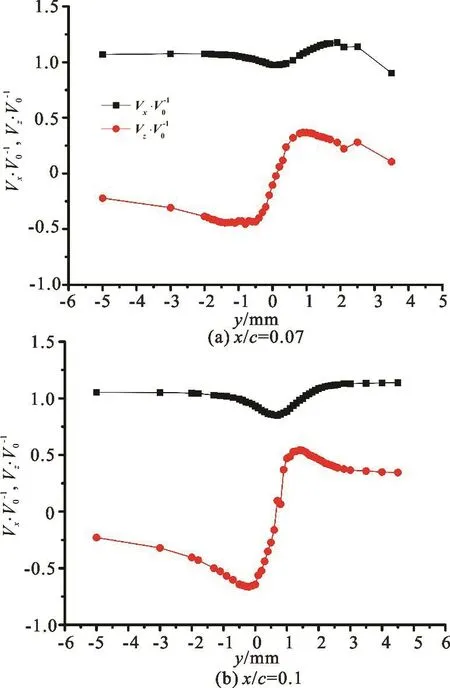
Fig.2 (Color online) Tangential velocity (non-dimensioned by incoming flow velocity) prof i les (red lines) at different stations along the vortex path downstream the tip
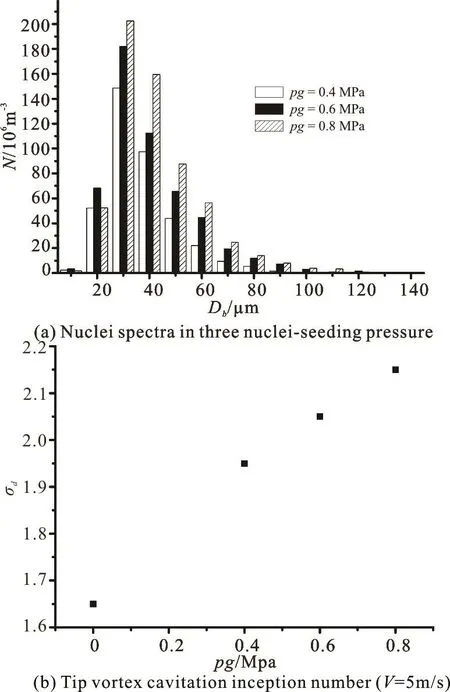
Fig.3 Tip vortex cavitation inception numbers corresponding to the nuclei spectra in three nuclei-seeding pressures
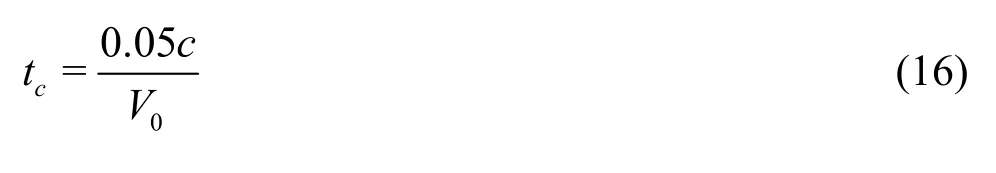
Then according to certain criteria, we will select the nucleus growing explosively first based on capture time. Fruman et al.[26]found out that the pressure on the vortex axis is minimum at about 5%-10% of the chord length along the vortex path, i.e., pressure drops from tip to around 5%-10% of the chord length, then rises downstream along the vortex. This conclusion is confirmed by the observations of cavitation inception by Maines et al.[27]. They discovered that nuclei are actually cavitated around this point. Based on these factors, we infer that the nuclei having an opportunity to grow explosively should be captured before they reach the lowest pressure point. So the criteria to select the nucleus growing explosively first is to choose the nucleus in maximum size with capture time t smaller than critical timect. Here,ct is the time to arrive at the lowest pressure point estimated as
So tc=0.00094s . Afterward according to the criteria we select the nucleus with R = 15μ m in Table 2 as cavitated nuclei. Tensile strength T of this nucleus can be acquired from bubble dynamics as follows
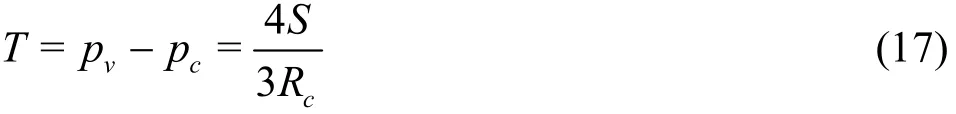
in whichvp is saturated vapor pressure,cp is critical pressure of a nucleus to cavitate, S is surface tension coefficient of water andcR is critical radius of a nucleus obtained by
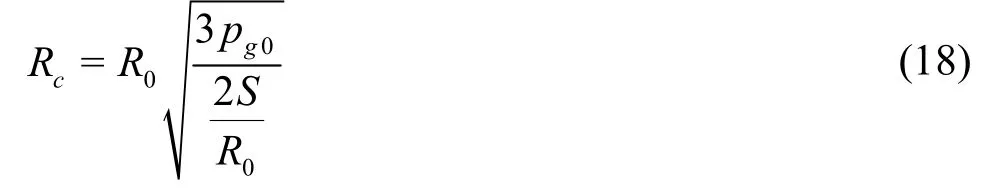
in which0gp is the initial partial pressure of the gas inside the nucleus, which is related to the initial state

where0p∞is initial pressure in the flow which canbe deduced from
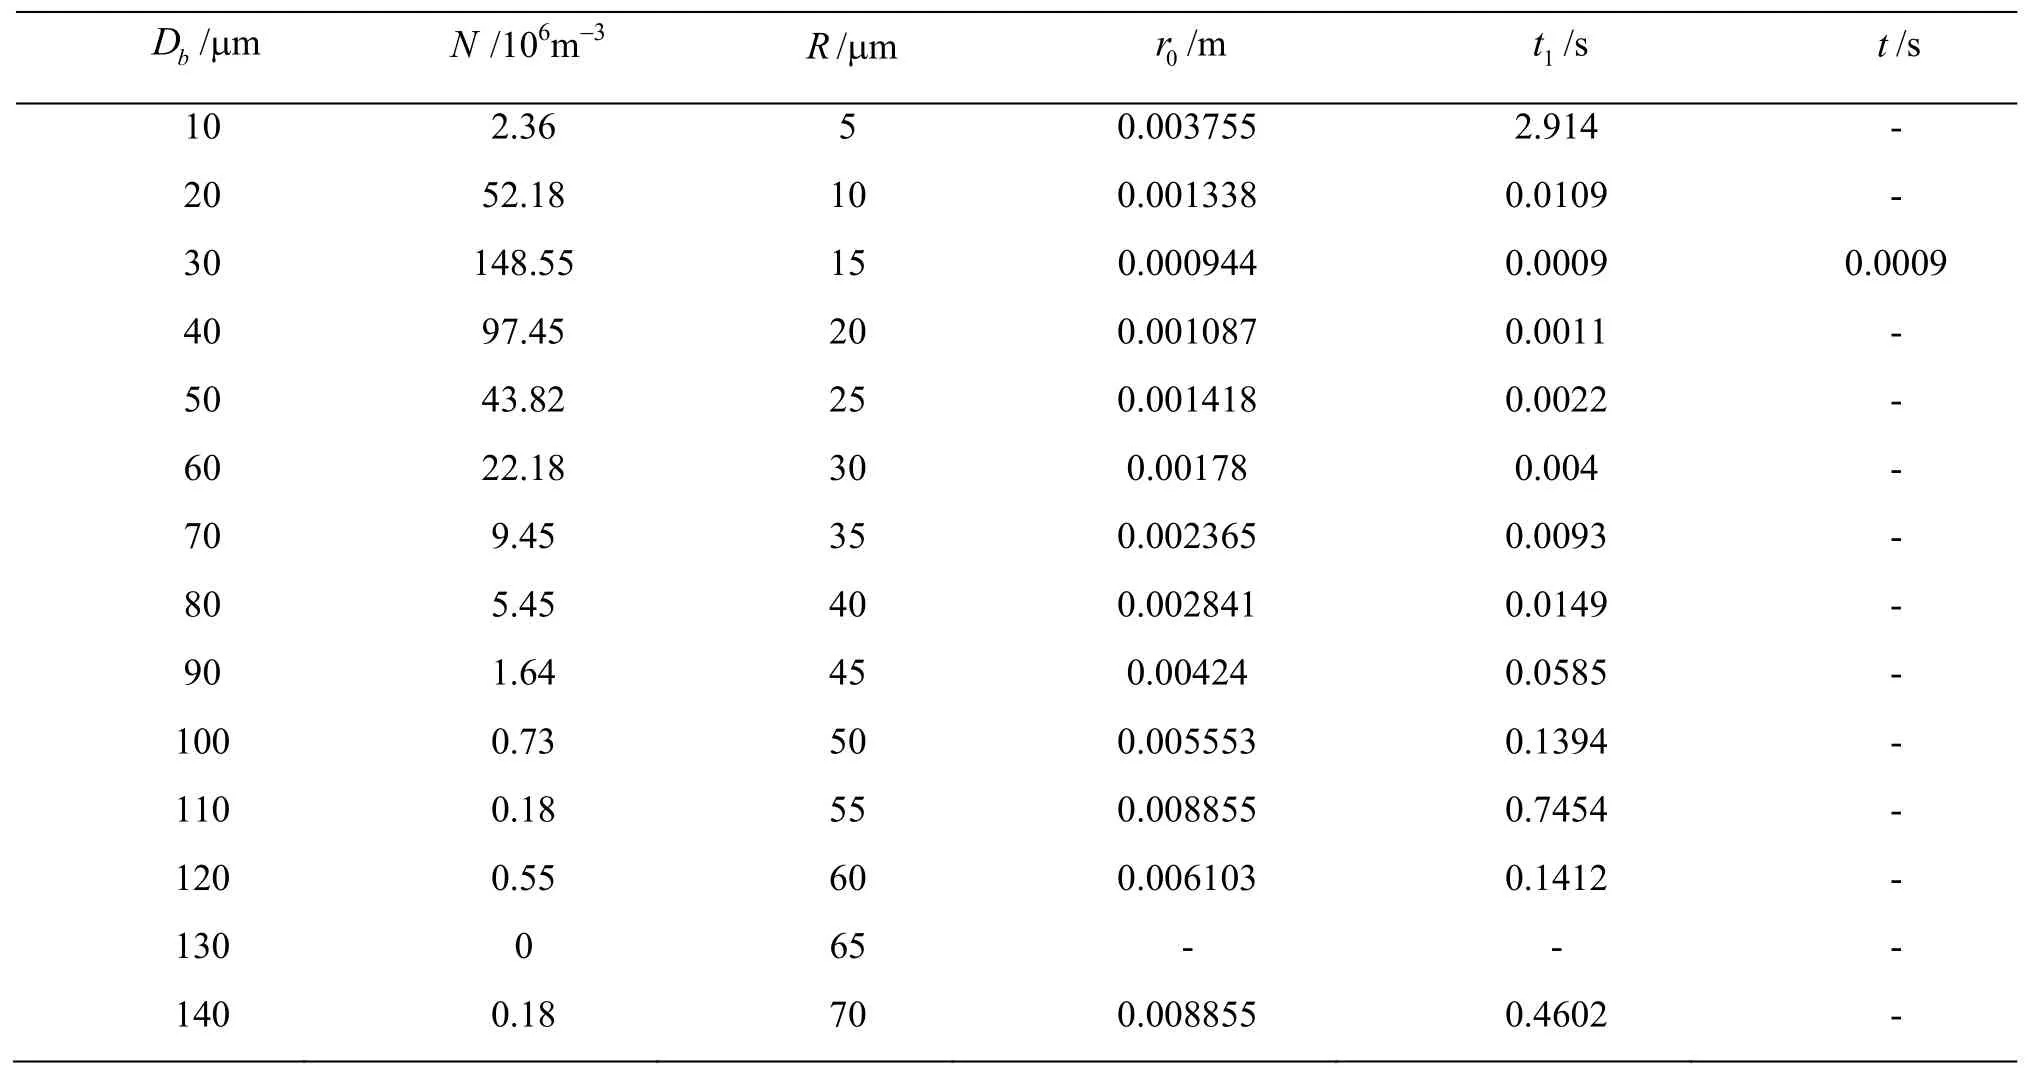
Table 2 Case I of nuclei with 0.4 MPa nuclei-seeding pressure
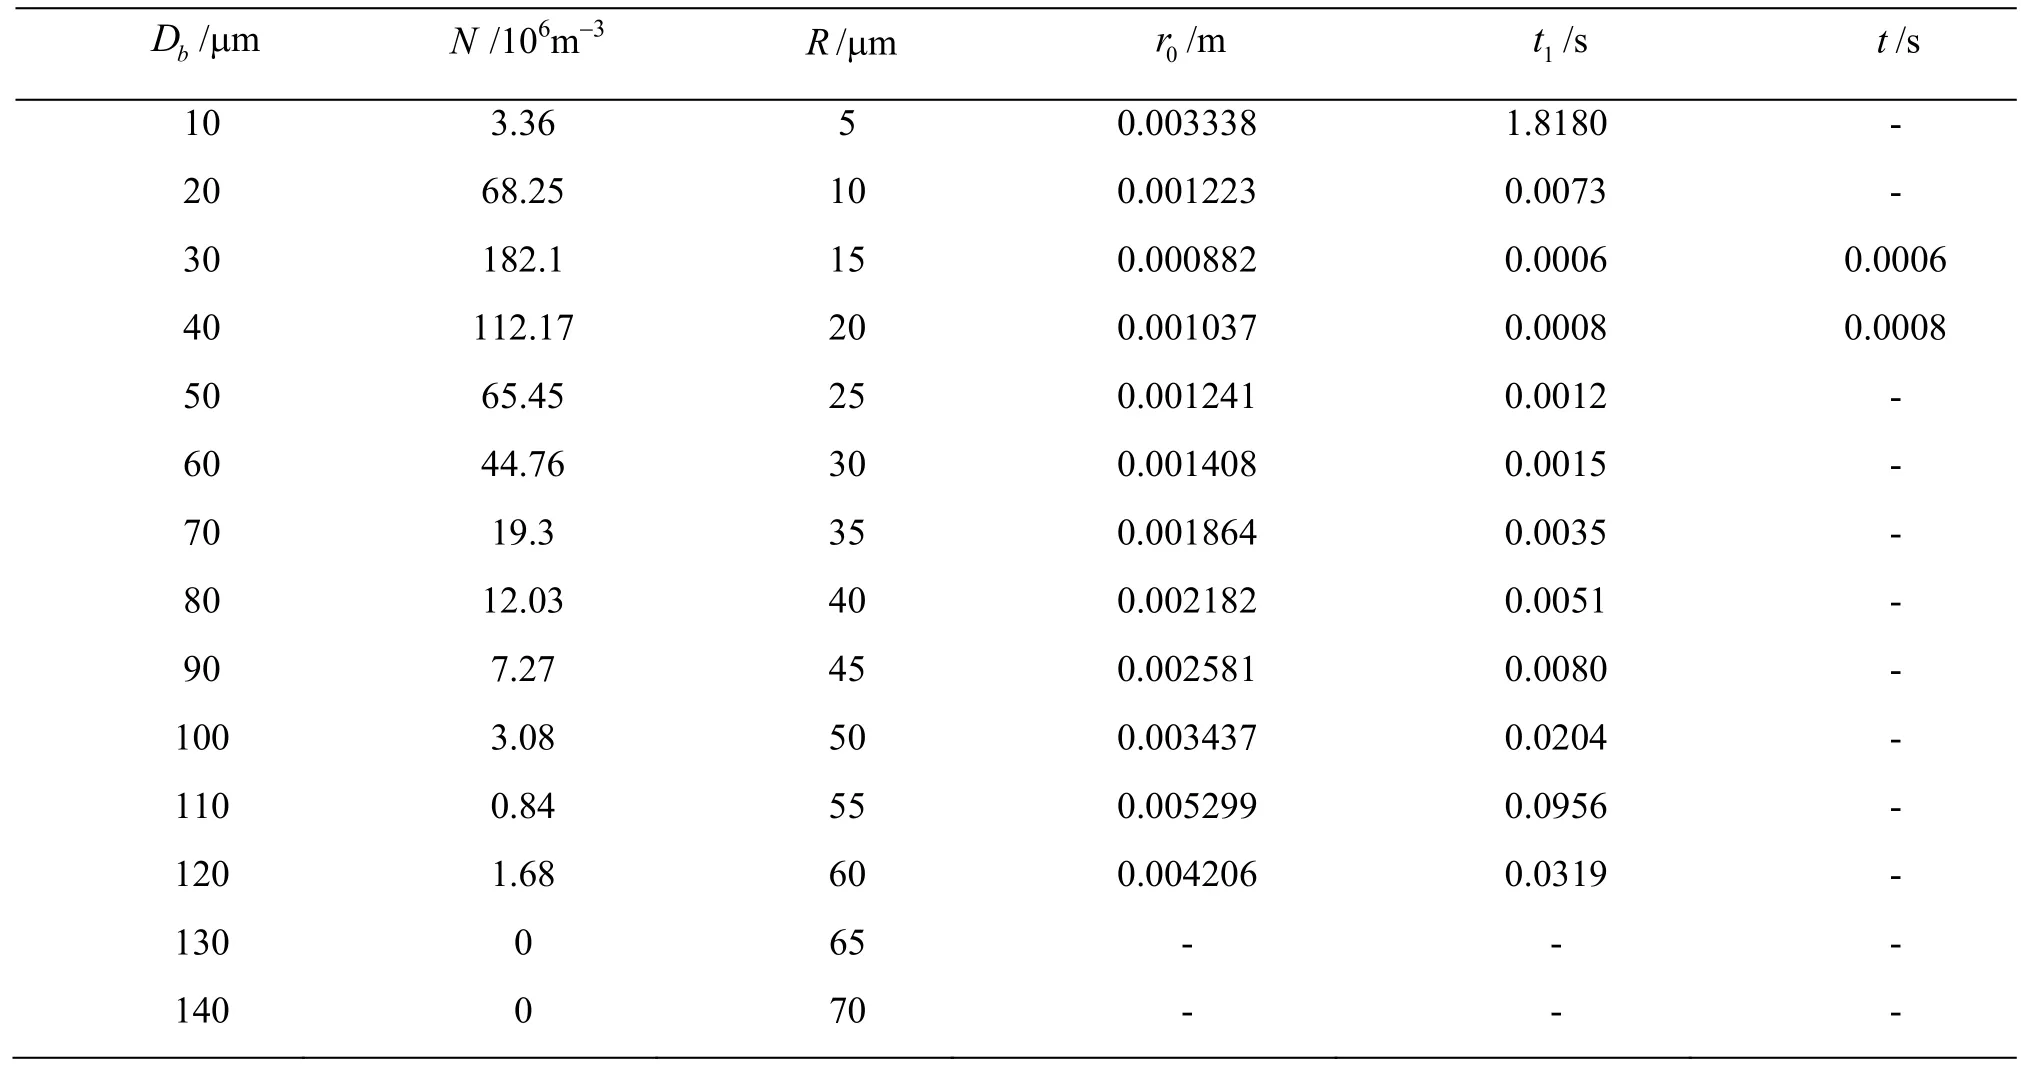
Table 3 Case II of nuclei with 0.6 MPa nuclei-seeding pressure.
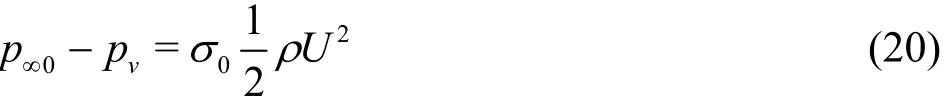
where σ0is the cavitation number when cavitation inception appears immediately at saturated vapor pressure in the flow. It is can be interpolated from Fig.3(b), i.e., σ0= 2.25 with nuclei-seeding pressure 1 MPa. Until now tensile strength can be easily got by reversing the procedures above. For this case, data are listed in second row of Table 5. With the same procedure to the second case and third case with 0.6 MPa and 0.8 MPa nuclei-seeding pressure, capture time are inspected in Table 3 and Table 4 respectively. Next select the cavitated nuclei of the two cases according to the criteria mentioned above. For these two cases,nuclei with R = 20μ m and R = 15μ m are picked out, and ins pec tion of ten sile strength of bo th nuclei correspondstothethirdand fourth row ofTable 5.Dimensionless tensile strength of nuclei for the three nuclei spectra are given in the last column of this table.

Table 4 Case III of nuclei with 0.8 MPa nuclei-seeding pressure
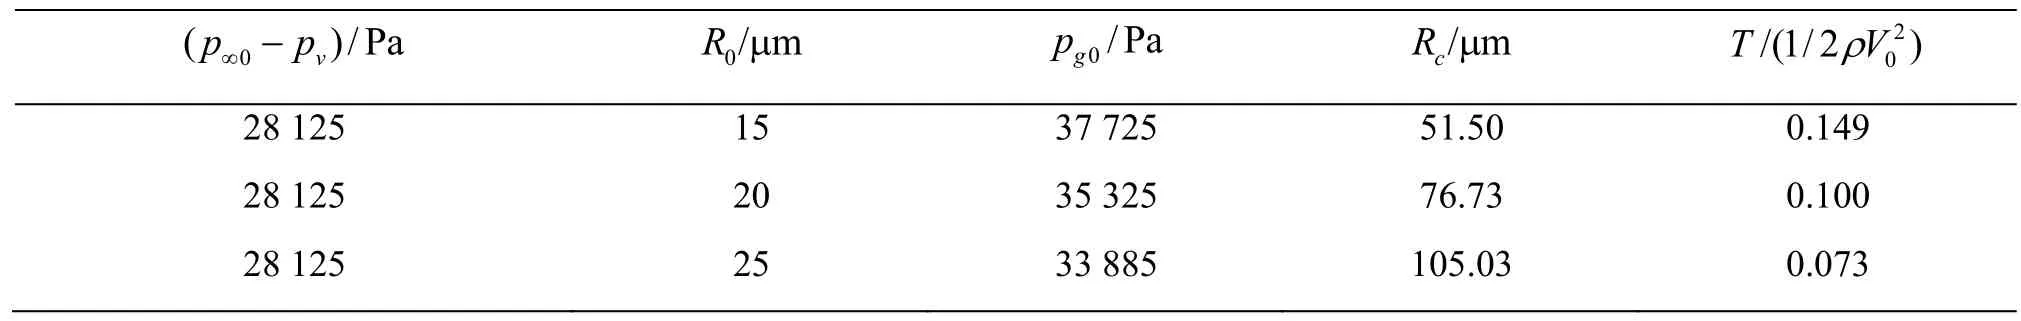
Table 5 Parameters for tensile strength of nuclei cavitated first
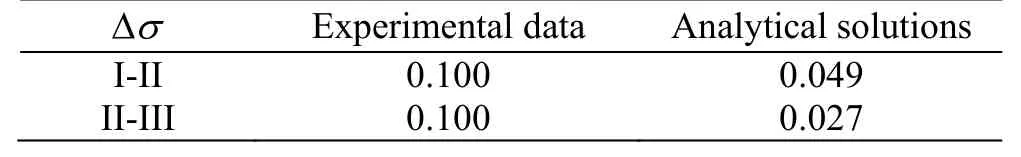
Table 6 Differences of cavitation number between cases in experimental data and analytical solutions respec- tively
At last, an important hypothesis is that the effect of water quality, i.e., tensile strength of water, is the tensile strength of nucleus cavitated first. Until now,the effect of water quality on tip vortex cavitation inception number can be quantified. We inspect the difference of cavitation number between cases in experiment data and analytical solutions respectively shown in Table 6. The experimental data are obtained by results presented in Fig.3(b), while analytical solutions are substituted by difference of tensile strength presented in Table 6. We can see that experimental data agree with experiment within an order of magnitude. Since there are other factors that influence the inception cavitation number in the experiment, we are excited at the accordance of results between experimental data and analytical solution.
3. Conclusions
In our work, we quantitatively study the effect of water quality on the tip vortex cavitation inception.Firstly, for non-growing nuclei, the dynamics of nuclei is governed by the spherical bubble dynamics model. In our last paper[21], we investigate the motion of nuclei inside Rankine vortex core with theoretical solution and simulation. The theoretical result is an exact solution only valid in the vortex core. Due to the complicated form, this result can only be used as verification of numerical simulation. In this paper,motion of nuclei in Rankine vortex can be analytically solved by ignoring the acceleration of nuclei and simplifying the drag coefficient. Due to the different profiles of tangential velocity outside and inside the vortex core, radial velocities of nuclei are expressed with different solutions. Based on these solutions,radial position of nuclei changed over time are given,which is consistent with numerical simulation.Meanwhile capture time of every nucleus can be obtained concisely. It can help to select cavitated nucleus quickly.
Next we apply the analytical solution to get capture time of nuclei released in the experiment.According to the criteria of capture, i.e., nucleus going to grow explosively first is the largest one with capture time smaller than the critical time. The tensile strength of this nucleus is considered to quantify the effect of water quality.
[1] Arndt R. E. A. Cavitation in vortical fl ows [J]. Annual Review of Fluid Mechanics, 2002, 34(1): 143-175.
[2] Choi J. K., Chahine G. L. Noise due to extreme bubble deformation near inception of tip vortex cavitation [J].Physics of Fluids, 2003, 16(7): 2411-2418.
[3] Luo X. W., Ji B., Tsujimoto Y. A review of cavitation in hydraulic machinery [J]. Journal of Hydrodynamics, 2016,28(3): 335-358.
[4] Arndt R. E. A., Arakeri V. H., Higuchi H. Some observations of tip-vortex cavitation [J]. Journal of Fluid Mechanics, 1991, 229: 269-289.
[5] Stinebring D. R., Farrell K. J., Billet M. L. The structure of a three-dimensional tip vortex at high Reynolds numbers [J]. Journal of Fluids Engineering, 1991, 113(3):496-503.
[6] Fruman D., Dugue C. Tip vortex roll-up and cavitation [J].Experiments, 1994, 6: 633-655.
[7] Arndt R. E. A., Maines B. H. Viscous effects in tip vortex cavitation and nucleation [C]. 20th Symposium on Naval Hydrodynamics. CA, USA, 1994.
[8] Fruman D. H. Recent progress in the understanding and prediction of tip vortex on a rectangular hydrofoil [C].Proceedings of the 2th International Symposium on Cavitation. Tokyo, Japan, 1994.
[9] Maines B. H., Arndt R. E. A. Tip vortex formation and cavitation [J]. Journal of Fluids Engineering, 1997, 119(2):413-419.
[10] Amromin E. Two-range scaling for tip vortex cavitation inception [J]. Ocean Engineering, 2006, 33(3-4): 530-534.
[11] Shen Y. T., Gowing S., Jessup S. Tip vortex cavitation inception scaling for high Reynolds number applications[J]. Journal of Fluids Engineering, 2009, 131(7): 233-239.
[12] Arndt R. E. A., Keller A. P. Water quality effects on cavitation inception in a trailing vortex [J]. Journal of Fluids Engineering, 1992, 114(3): 430-438.
[13] Shen Y., Chahine G., Hsiao C. T. et al. Effects of model size and free stream nuclei on tip vortex cavitation inception scaling [C]. Proceedings of the 4th International Symposium on Cavitation. Pasadena, USA, 2001.
[14] Coutier-Delgosha, J. O., Pouffary B. and Fortes R. Numerical simulation of unsteady cavitating fl ows [J]. Interna- tional Journal for Numerical Methods in Fluid, 2003,42(5): 527-548.
[15] Singhal A. K., Athavale M. M., Li H. et al. Mathematical basis and validation of the full cavitation model [J].Journal of Fluids Engineering, 2002, 124(3): 617-624.
[16] Kunz R. F., Boger D. A., Stinebring D. R. et al. A preconditioned naviercstokes method for two-phase fl ows with application to cavitation prediction [J]. Computers and Fluids, 2000, 29(8): 849-875.
[17] Mees L., Lebrun D., Allano D. et al. Development of interferometric techniques for nuclei size measurement in cavitation tunnel [C]. Proceedings of the 28th Symposium on Naval Hydrodynamics. Pasadena, USA, 2010.
[18] Hsiao C. T., Chahine G. L. Effect of vortex/vortex interaction on bubble dynamics and cavitation noise [C].Proceedings of the 5th International Symposium on Cavitation. Osaka, Japan, 2003.
[19] Hsiao C. T., Chahine G. L. Scaling of tip vortex cavitation inception noise with a bubble dynamics model accounting for nuclei size distribution [J]. Journal of Fluids Engineering, 2005, 127(1): 55-65.
[20] Park K., Seol H., Choi W. et al. Numerical prediction of tip vortex cavitation behavior and noise considering nuclei size and distribution [J]. Applied Acoustics, 2009, 70(5):674-680.
[21] Zhang L., Chen L., Shao X. The migration and growth of nuclei in an ideal vortex fl ow [J]. Physics of Fluids, 2016,28(12): 123305.
[22] Oweis G. F., Van der Hout I. E., Iyer C. et al. Capture and inception of bubbles near line vortices [J]. Physics of Fluids, 2005, 17(2): 022105.
[23] Cui B., Ni B., Wu Q. Bubble-bubble interaction effects on dynamics of multiple bubbles in a vortical fl ow fi eld [J].Advances in Mechanical Engineering, 2016, 8(2): 1-12.
[24] Song M., Xu L., Peng X. et al. An acoustic approach to determine tip vortex cavitation inception for an elliptical hydrofoil considering nuclei-seeding [J]. International Journal of Multiphase Flow, 2016, 90: 79-87.
[25] Peng X., Xu L., Song M. Vortex singing in tip vortex cavitation under the effect of water quality [J]. Journal of Physics: Conference Series, 2015, 656(1): 012185.
[26] Fruman D. H., Cerrutti P., Pichon T. et al. Effect of hydrofoil planform on tip vortex roll-up and cavitation [J].International Journal of Multiphase Flow, 1993, 117(1):162-169.
[27] Maines B. H., Arndt R. E. A. Bubble dynamics of cavitation inception in a wing tip vortex [J]. Fluids Engineering Division Summer Meeting, 1993, 153: 86-91.

- 水动力学研究与进展 B辑的其它文章
- Bubbly shock propagation as a mechanism of shedding in separated cavitating flows *
- A sharp interface approach for cavitation modeling using volume-of-fluid and ghost-fluid methods *
- On the numerical simulations of vortical cavitating flows around various hydrofoils *
- Experimental measurement of tip vortex flow field with/without cavitation in an elliptic hydrofoil *
- Novel scaling law for estimating propeller tip vortex cavitation noise from model experiment *
- Simulation of cavitation induced by water hammer *