黄土高原露日数变化趋势分析*
2017-11-06 09:54高志永汪有科
中国生态农业学报(中英文) 2017年11期
高志永, 汪有科, 姜 鹏
( 1.杨凌职业技术学院水利工程分院 杨凌 712100; 2.西北农林科技大学水利与建筑工程学院/中国科学院教育部水土保持与生态环境研究中心 杨凌 712100; 3.水利部发展研究中心 北京 100038)
黄土高原露日数变化趋势分析*
高志永1, 汪有科2**, 姜 鹏3
( 1.杨凌职业技术学院水利工程分院 杨凌 712100; 2.西北农林科技大学水利与建筑工程学院/中国科学院教育部水土保持与生态环境研究中心 杨凌 712100; 3.水利部发展研究中心 北京 100038)
露日数是预防和控制植物病害的重要因子, 探讨气候变化条件下露日数, 可为区域植物病害预测及防治提供事实依据。本文基于 52个气象站点 1961—2010年逐日监测气象数据, 计算了黄土高原不同时空尺度的露日数, 利用去趋势预置白处理(trend-free pre-whitening, TFPW)的Mann-Kendall法和Sen趋势度估计法(Sen’ slope)分析了露日数变化趋势, 并借助相关分析法探讨了露日数的成因。结果表明, 在月尺度上, 黄土高原露水发生在3—11月, 全区域月平均值为7 d, 9月露日数最长, 其中南部、东南部和西北部露日数达8~12 d。5.77%~25.00%气象站点露日数在6月和8—11月以0.02~0.15 d·a-1显著增加, 17.31%和7.68%气象站点露日数在4月和7月以-0.09 d·a-1和-0.02 d·a-1显著降低。在季尺度上, 黄土高原露水发生在春、夏和秋季, 全区域季平均值为15 d, 秋季露日数最长, 其中南部、东南部和西北部露日数达14~26 d。仅3.85%和5.77% 的气象站露日数在夏季、秋季分别以 0.25~0.09 d·a-1和 0.15~0.09 d·a-1显著增加, 5.77%的气象站露日数在春季以-0.34~-0.07 d·a-1显著降低。相对湿度和温度是影响上述露日数时空变化的最关键因子。
黄土高原; 露日数; 变化趋势; Mann-Kendall; Sen’slope
温室效应引起的全球气候变暖影响着诸如温度、相对湿度、降雨、日照时数等气象因子变化[1], 气象因子的变化严重制约了全球人口、经济和工业等发展[2], 甚至影响到中国乃至全球粮食安全和水资源供需[3-4]。黄土高原地处半干旱和半湿润气候带,是气候变化的敏感区, 又是生态环境脆弱区, 水土流失严重[5-7], 气候变化对生态环境和农业生态系统会产生重要影响[8-9]。该区域以旱作雨养农业为主,降雨作为水资源的输入项, 对黄土高原区域植物至关重要。然而, 该区域内近50年降雨呈现显著性减少趋势[10], 且降雨存在时空不均, 呈现从东南向西北递减趋势, 降雨多集中在7、8、9月, 因降雨集中出现大面积土壤流失现象[11-12]。黄土高原植被物候期因气候变暖, 春季显著提前, 秋季显著推迟[13],导致气候生产力以10.45 kg·km-2·a-1下降, 病虫害发育期缩短, 种群增长力增加, 病害地理范围扩大[14-15], 如定西地区马铃薯晚役病发病面积比例以3.55%·a-1增加, 陇东和陇中2000年麦蚜虫发生面积是1980年的3.4倍和3.1倍[16]。陕北地区枣树虫害种类已占全国枣树害虫种类的53.45%, 桃小食心虫在严重年份造成产量损失率为50%~90%,枣锈病可使产量损失率达50%~70%,病叶严重时可达70%以上[17-18]。
大气中的水汽是决定地球气候变化的重要因子之一[19], 也是全球水文循环的关键组成[20]。露水是空气中水汽在物体表面的冷凝产物[21-22], 是一个重要的物理现象, 它影响着SPAC系统的能量平衡[23],是干旱半干旱地区重要的水资源[24-25], 是黄土高原不可缺失的水资源补充项[26-27], 具有降水所不及的普遍性和稳定性, 约占黄土高原陆面水分来源的15%[28]。一方面, 露水能够被植物冠层叶片直接吸收来补充体内亏缺的水分[29-31], 降低其周围的水汽压差, 促进植物气孔开放和光和[23], 进而影响冠层温度[32]; 此外, 露水可以通过植物木质部到达根部, 缓解土壤水分亏缺[33]。另一方面, 植物叶片的露水为许多病菌孢子的萌发和感染宿主提供环境条件[34]。因此,在全球变暖环境下分析露水变化趋势, 有利于全面理解黄土高原露水资源, 也为该区域生态环境评价提供一定的依据。
露水量和露水持续时间是露水研究的热点[23],因缺乏监测标准而难以测定[35]。针对以上不足, 许多经验和机理模型, 如RH、CART、P-M、SWEB、ANN等模型被用于预测露水[36-39], 该类模型通过借助气象数据来估算露水[34,40-42]。机理模型在不同地理和气候条件下均可应用, 能够准确地估测露水,但需要输入较多的参数, 如云量、长短波辐射率、净辐射等, 且计算结果对于输入参数变化十分敏感[39],经验模型虽然缺乏机理支撑, 但仍是露水模拟的可靠方法[38]。
目前, 一些学者利用实测或模型对黄土高原露水量进行了研究[26-27,43-44], 但对露水持续时间的研究鲜有报道。露日数与露水持续时间密切相关, 是预测植物叶片疾病的重要参数[37]。此外, 以上研究仅考虑年内某地区露水多寡, 未考虑气候变化条件下长时间序列露水变化特征, 也未对整个黄土高原区域露水状况进行全面分析。由于以往对露水的关注度不够, 缺乏露水相关资料, 本文借助长时间序列(1961—2010年)的气象数据, 采用经验模型计算了露日数, 分析月、季尺度露日数时空变化特征, 利用去趋势预置白处理(trend-free pre-whitening,TFPW)的Mann-Kendall法和Sen趋势度估计法(Sen’slope)分析露日数的变化趋势, 并采用相关分析法探讨露日数和气象因子的敏感度, 以期进一步全面了解气候变化条件下黄土高原露日数分布特征和变化趋势, 为黄土高原植物病害预测、防治提供事实依据。
1 材料与方法
1.1 研究区域概况
黄土高原位于黄河中上游地区, 地理坐标为32°47′N~40°44′N 和 106°54′E~114°33′E, 东起太行山, 西至青海日月山, 南界秦岭, 北抵阴山, 全区总面积为 6.285×10⁵km2, 海拔为 1 200~1 600 m, 黄土覆盖层厚30~80 m[6]。该区域包括山西、内蒙、河南、陕西、甘肃、宁夏和青海7个省(自治区)、341个县(市), 是温和半湿润气候区向温和半干旱、温和干旱气候区的过渡带, 气候变化敏感, 生态环境脆弱[5]。为全面研究黄土高原露日数, 本文选择52个具有代表性的气象站(图 1)。气象数据来源于中国气象局,气象数据时间范围为1961—2010年, 时间分辨率为逐日; 空间范围为黄土高原区域, 空间分辨率为中国地面国家级基准、基本站。该类数据主要包括日序列的降雨量(P, mm), 平均、最大和最小温度(Tm,Tmax,Tmin, ℃), 风速(u, m·s-1)、相对湿度(RH, %)和蒸发(E, mm)。饱和水气压亏缺(VPD, kPa)是当时温度下空气中饱和水气压(es)和实际水气压(ea)之间的差值, 由以下公式计算得出:

式中:es为饱和水汽压, kPa;ea为实际水汽压, kPa;Td为露点温度, ℃; a、b为常数, 分别为 17.625和243.04;T为大气平均温度, ℃; RH为大气平均相对湿度, %; VPD为饱和水汽压差, kPa;Tmin为大气最小温度, ℃;Tmax为大气最大温度, ℃。

图1 黄土高原气象站点分布Fig.1 Location of meteorological stations in the Loess Plateau
1.2 研究方法
1.2.1 露日数
本研究露日数(DD)指大气温度低于露点温度的天数。为严格判断露日数, 排除各气象站降雨日和结霜日。采用Magnus-Tetens方程[45]计算各气象站非降雨非霜日逐日的露点温度, 并利用计算的日露点温度与该日最小温度对比, 判断结露与否。如果某日Pi=0, 且0<<Tdi, 表示该日存在露水,记Ti=1, 反之, 记Ti=0。式中:Tdi为i日露点温度, ℃;Pi为i日的降雨量, mm;Timin为i日最小温度, ℃。时段划分: 月尺度为1—12月逐月; 季尺度以3、4、5月为春季, 6、7、8月为夏季, 9、10、11月为秋季, 12月至翌年1、2月为冬季。
月尺度露日数(DDm)为:

季尺度露日数(DDs)为:

1.2.2 趋势性统计方法
为说明月和季尺度露日数变化趋势, 借助Z统计值和Sen值, 并对露日数在 95%和 99%置信水平下显著变化所对应的气象站进行统计, 通过Z统计值、显著性气象站所占总气象站的比例和Sen值说明露日数变化趋势增减。因此, 本文采用去趋势预置白处理(trend-free pre-whitening,TFPW)的Mann-Kendall法分析露日数的趋势性变化。去趋势预置白处理的Mann-Kendall处理过程如下[1-2,46]:
1.2.2.1 Mann-Kendall检验方法
设一平稳序列为Xt(t=1, 2, …,n,n为序列长度)
则:
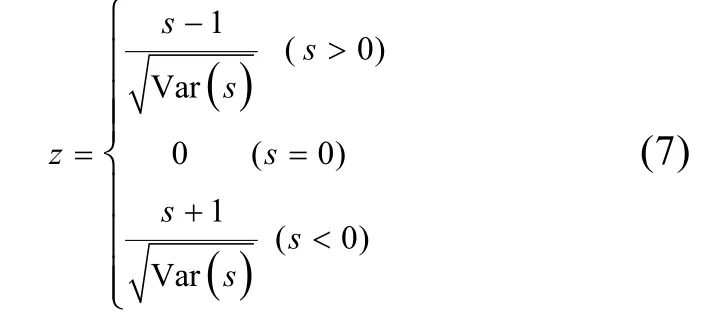
其中:

采用双侧检验, 在α显著水平下, 如果|Z|>Z(1-α/2), 拒绝无趋势的假设, 即认为在显著水平a下,序列Xt中存在有向上或向下的趋势; 否则接受序列Xt无趋势的假设。Z(1-a/2)是概率超过α/2时标准正态分布的值。
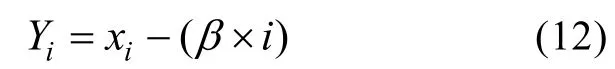
1.2.2.2 去趋势预置白处理的Mann-Kendall法
1)计算样本数据的线性趋势 :

2)形成新序列项:
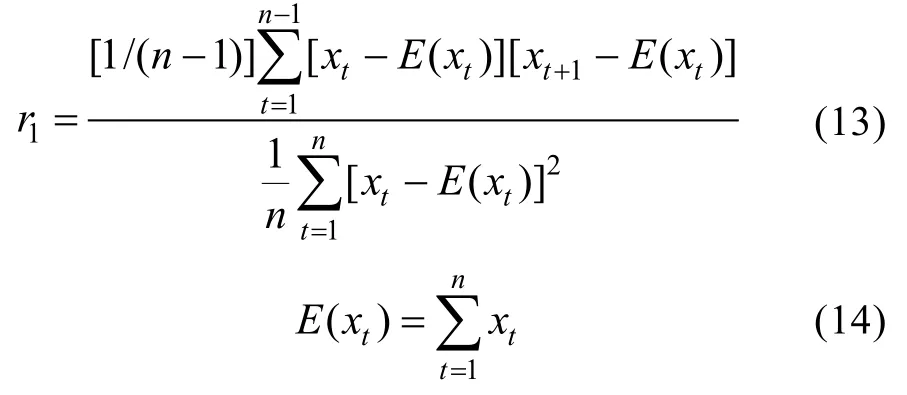
3)计算新序列项的一阶自相关r1:
如果r1对于0不显著相关, 则对原始序列直接进行Mann-Kendall检验方法, 如果r1对于0显著相关,则需构建不含自相关影响的新序列。
4)剔除序列中的自相关项:

5)形成不含自相关影响的新序列:

6)对不含自相关影响的新序列进行Mann-Kendall检验。
1.2.2.3 斜率(Sen’ slope)
为估算某一个时间数据序列变化趋势的数值程度大小, 利用Sen提出的非参数化斜率估算[1,46-47]。
1)构建新序列xi(i=1, 2,…,n,n为序列长度),用下式计算组合序列斜率:
式中:xj,xk分别为数据序列在j和k时刻的数值,j>k,i=1, 2,…,n,。
2)Sen斜率为求n个斜率估测值Qi的中值:

Qmed>0表示上升趋势, 反之表示下降趋势。为检验数据序列变化趋势显著性与否, 对Qmed在100(1-α)%置信区间进行检验。
1.2.3 相关性分析
为说明不同时间尺度露日数对气象因子的响应,分析露日数与气象因子在95%和99%置信水平下的相关性。相关系数表征变量和变量之间的相关性,相关系数的绝对值越大, 表明变量间相关程度越高,相关系数计算公式如下:

式中:Rxy为变量x和y的相关系数,n为统计数据的总数,i为第i个统计数据,为x的均值,为y的均值。
1.2.4 数据处理
采用R 3.4.0和Microsoft Excel 2010进行数据整理和统计分析, 借助Origin 2016进行绘图, 并利用arcgis 10.1中应用广泛差值准确的Kriging插值法[48]绘制露日数时空分布图。
2 结果与分析
2.1 露日数时空分布特征
在月尺度上, 从时间分布来看(图 2a), 露日数在3—9月显著增加(P<0.05, 0.01), 在10—11月显著降低(P<0.05, 0.01), 9月份达最大, 平均值为7 d; 1—2月和12月露水几乎不发生。从空间分布来看(图 3), 南部武功和西北部临河是露水发生最早, 持续时间最长的地区,其值分别为2~10 d和2~14 d; 全区域在5—10月均存在露水。从时空分布来看, 露水起始于 3月黄土高原南部, 持续时间为2~6 d, 武功最大, 达6 d; 4、5月南部和东南部大面积发生, 持续时间为 2~10 d,同时, 西北方向临河附近出现露水, 持续时间为2~6 d; 进入 6月后, 南部呈现减弱趋势, 西北部增加, 持续时间为4~14 d; 7月西北部降低为4~10 d,南部增加1~2 d; 8月与7月露水发生情况基本一致,但东南部增加为8~12 d; 9、10月南部和东南部基本保持不变, 西北部在10月减小, 降至6~8 d; 11月西北部低于2 d, 南部缩减2 d。
在季尺度上, 从时间分布来看(图 2b), 夏季露日数与秋季无差异(P<0.05, 0.01), 露日数在秋季最大, 平均值为15 d, 冬季几乎不存在露水。从空间分布来看(图4), 南部武功和西北部临河是露日数最长地区, 其值分别为20~24 d和30~34 d。从时空分布来看, 露日数主要在黄土高原春季南部、西北部, 其值分别为14~26和14~22 d, 西部和东北部低于4 d;进入夏季和秋季, 露水存在整个黄土高原, 持续时间为 6~34 d, 其中秋季南部、东南部和西北部露日数较高, 为14~26 d; 冬季几乎不存在露水。
2.2 不同时间尺度露日数变化趋势
图5为月尺度上Mann-Kendall分析露日数存在显著性变化所在气象站占总站百分比。在月尺度上,露日数具有增加趋势的气象站点多于降低趋势的气象站点; 5.77%~25.00%气象站点露日数在 6月和8—11月显著增加, 其中8月显著增加为最大, 占总站数的 25%, 露日数显著性增加率为 0.02~0.15 d·a-1;17.31%和7.68%气象站点露日数在4月和7月显著降低, 4月显著降低达最大, 占总站数的17.31%, 露日数显著性降低率为-0.09~-0.02 d·a-1。
图6为季尺度上Mann-Kendall分析露日数存在显著性变化所在气象站占总站百分比。在季尺度上,春、夏和秋季露日数在95%和99%置信水平下显著变化所对应的气象站占总站的 7.69%、7.69%和3.85%。夏季和秋季露日数分别以0.25~0.09 d·a-1和0.15~0.09 d·a-1显著增加, 5.77%气象站露日数在夏季显著性增加最大; 5.77%气象站露日数在春季以-0.34~-0.07 d·a-1显著性降低。
2.3 不同时间尺度露日数成因
表1和表2分别为月和季尺度露日数与气象因子显著相关条件下, 所在气象站占总站百分比。在月尺度上Tm、RH、P、u、E和VPD对露日数都存在显著性影响; 其中, 露日数与RH和P在3—11月均表现出显著性正相关, 显著性相关所在气象站占总站的变化范围分别为50%~99.9%和15.39%~71.15%; 露日数与E和VPD在3~11月均表现出显著性负相关, 显著性相关所在气象站占总站的变化范围分别为 25%~73.08%和28.84%~90.39%; 露日数与Tm和u在3—11月显著性相关正负随月份变化而变化; 露日数与Tm在3、4、10、11月显著正相关, 在5—9月显著负相关, 显著性正、负相关所在气象站占总站最大比例为 46.15%和63.47%; 露日数与u在5月和9月正相关, 在3月、4月和6—8月和10—11月负相关, 显著性正、负相关所在气象站占总站最大比例为71.1%和40.39%。表2显示, 在季尺度上Tm、RH、P、u、E和VPD对露日数影响显著; 其中, 露日数与RH和P在春、夏和秋季上均表现出显著性正相关, 显著性相关所在气象站占总站的变化范围分别为 69.23%~96.16%和32.69%~76.92%; 露日数与u、E和VPD在春、夏和秋季上均表现出显著性负相关, 显著性相关所在气象站占总站的变化范围分别为 21.15%~36.54%、23.08%~51.92%、57.69%~75.00%和 57.69%~88.46%;露日数与Tm在春、夏季显著性负相关, 在秋季显著性正相关, 显著性相关所在气象站占总站的 21.16%、57.69%和19.23%。

图2 黄土高原月(a)和季(b)尺度露日数Fig.2 Dew days on monthly (a) and seasonal (b) scales in the Loess Plateau of China

图3 黄土高原月尺度露日数时空分布图Fig.3 Spatiotemporal distribution maps of dew days on monthly scale in the Loess Plateau of China
3 讨论
3.1 气象因子对露日数的影响
露水形成是一个极其复杂的过程, 受诸多气象因子的影响[25,49-50], 与水汽分布、水分输送、凝结过程有关的环境因素均可影响结露过程[51], 影响露水形成的气象因子敏感性会随时间尺度不同而发生变化[52]。本文仅借助温度和相对湿度估算露日数, 具有一定的局限性。本研究表明, 在月和季尺度上露日数与RH和P显著正相关, 与E和VPD显著负相关。露日数与 RH显著相关所在气象站占总站数比例高达99.9%, 较高的RH为露水形成提供了充足的水汽[49,53], 降雨促使 RH增加, 增加了空气中的水汽[49], 更容易结露;E与RH负相关[54], 增加的E使RH降低, 水汽来源减少; VPD反映空气中水汽接近饱和的程度, 决定露水量的多寡[55], VPD越大, 说明空气中的水汽越难接近饱和, 露水难形成。此外, RH和P、E、VPD在月和季尺度上极显著相关(P<0.01), 相关系数分别为0.55、-0.26、-0.28和0.63、-0.14、-0.16。

图4 黄土高原季尺度露日数时空分布图Fig.4 Spatiotemporal distribution maps of dew days on seasonal scale in the Loess Plateau of China

图5 黄土高原月尺度上Mann-Kendall分析露日数存在显著性变化所在气象站占总站百分比Fig.5 Percentage of stations with significant tends in monthly dew days by Mann-Kendall test in the Loess Plateau of China
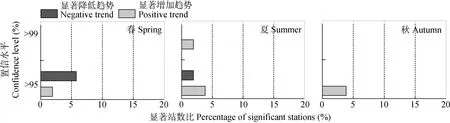
图6 1961—2010年黄土高原季尺度上Mann-Kendall分析露日数存在显著性变化所在气象站占总站百分比Fig.6 Percentage of stations with significant tends in seasonal dew day from 1961 to 2010by Mann-Kendall test in the Loess Plateau of China

表1 黄土高原月尺度露日数与气象因子显著相关所在气象站占总站百分比Table 1 Percentage of stations with significant correlation between dew day and meteorological factors on monthly scale in the Loess Plateau of China %
温度影响露水形成, 较低的气温易于物体表面冷却而结露[56], 较高的温度使得物体表面温度高于露点温度, 促使E加快, 降低物体表面RH, 露水不易形成[49]。然而, 本研究表明,Tm在 3、4、10、11月和秋季与露日数显著正相关, 显著性正相关所在气象站占总站最大比例为46.15%。黄土高原地区在此时段内Tm为 1.30~10.20 ℃, 相应露点温度为-5.46~0.15 ℃, 露点温度低于 0 ℃时, 空气中过剩的水汽直接以霜的形式体现, 增加的Tm会影响到露点温度, 促使露点温度从负变为正, 空气中达到饱和的水汽才能以露水的形式凝结在物体表面。
风速是影响露水形成的重要气象因子[57]。本文u与露日数仅在5月和9月显著性正相关, 显著性正相关所在气象站占总站最大比例为71.1%, 该时段u均值为2.01~2.76 m·s-1;u与露日数在其他月份和季尺度上显著负相关, 显著负相关所在气象站占总站的最大比例为40.3%, 该时段u均值为2.08~2.92 m·s-1。Monteith认为小于0.5 m·s-1的风速易于露水形成[58],微风或风速为零时, 水汽分子扩撒到稳定边界层可任意产生小液滴, 在液滴周围形成水汽浓度梯度,在浓度梯度的作用下露水量增加[21], 小的风速有利于冷却凝结面同时带来水汽[59]。Jackson等[60]认为露水形成的适宜风速为 0.5~2 m·s-1, Muselli等[61]、Hanisch等[62]研究表明限制露水形成的风速分别为4.7 m·s-1、3.3~5.3 m·s-1和 5.7 m·s-1。大风可以使近地层大气发生湍流运动, 也可以使近地面的温度轮廓线绝热,在不受对流加热运动影响时, 可以很清楚地观测到露水量[63]。因此, 风速对露水的影响存在不确定性。

表2 黄土高原季尺度露日数与气象因子显著相关所在气象站占总站百分比Table 2 Percentage of station with significant correlation between dew day and meteorological factors on seasonal scale in the Loess Plateau of China %
综上, 月尺度和季尺度上的温度和相对湿度是影响黄土高原区域露日数的最关键因子, 这与已有关于湿润区露水成因的结论相一致[64]。黄土高原南部及东南部温度和相对湿度高于西北部[65], 露日数与温度在3、4、10、11月及秋季显著正相关气象站占总站数的 13.47%~46.15%和 13.47%; 露日数与相对湿度在月和季尺度上显著正相关气象站占总站数的51.4%~99.9%和69.23%~96.16%, 因此, 南部和东南部在3、4、10、11月及秋季较高的温度和相对湿度促使露日数大于西北部。
3.2 温度和湿度对露日数的影响
温度是气候变化的“指示器”[47], 相对湿度影响生物圈和地表水文[66], 黄土高原区域温湿度变化决定露日数变化趋势。5.77%~55.77%气象站的温度在4—11月显著增加(表3), 递增率为0.018~0.090 ℃·a-1, 平均值为0.049 ℃·a-1, 高于近50年间全球0.013 ℃·a-1[67]和全国 0.022 ℃·a-1[68]增温率。9.62%~15.39%气象站的湿度在 7—9月显著降低(表 3), 递减率为-0.3~-0.1%·a-1,平均值为-0.2%·a-1; 11.54%~23.02%气象站的湿度在4月和6月显著增加(表3), 递增率为0.1~0.3%·a-1, 平均值为0.3%·a-1。季尺度温度和相对湿度变化显著性不大。尽管黄土高原区域温度存在上升趋势, 部分月份相对湿度为降低趋势, 但未影响到露日数上升趋势这一状态, 其主要原因是月和季尺度上的平均温度和相对湿度目前还处于易于结露(露水发生率大于 70%)的温度和相对湿度范围内(图7)。
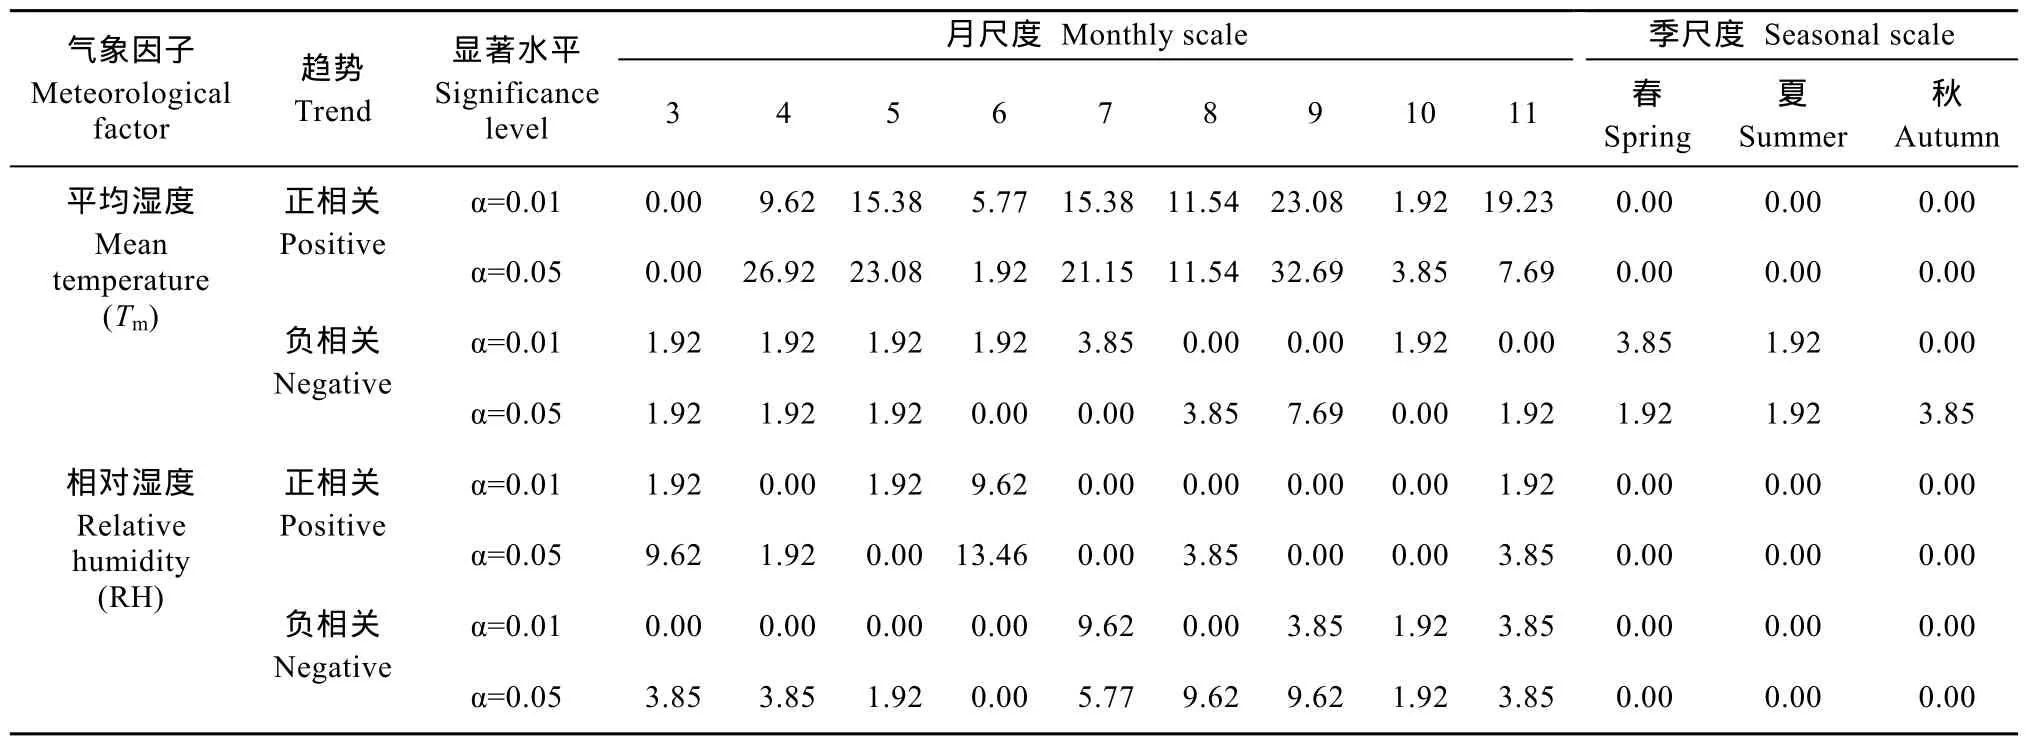
表3 黄土高原不同时间尺度Mann-Kendall分析温度和相对湿度存在显著性变化所在气象站占总站百分比Table 3 Percentage of stations with significant trends in monthly and seasonal relative humidity and mean temperature in the Loess Plateau of China
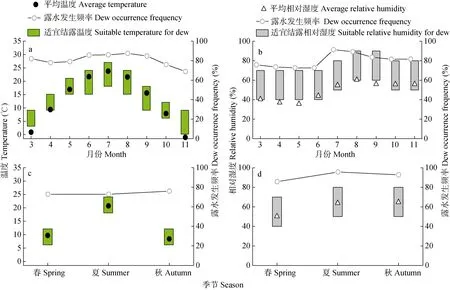
图7 黄土高原月(a, b)和季(c, d)尺度适宜结露温度(a、c)和相对湿度(b、d)及露水发生频率Fig.7 Suitable temperature (a, c) and relative humidity (b, d) for dew formation in monthly (a, b) and seasonal (c, d) scales and dew occurrence frequency in the Loess Plateau of China
3.3 存在不足及展望
全球气候变暖愈演愈烈, 新的间歇性干旱、半干旱区域层出不穷。露水对干旱和半干旱地区植物生长极其重要。由于黄土高原地区露水实测资料缺失, 该地区露水对植物生态效应的研究匮乏。叶片和根系吸收水分策略是植物获取水分的两种有效途径, 水资源的获得性和限制性会影响到植物对两种吸水策略的偏重。黄土高原长期处于土壤水分亏缺状态, 使植物根系较难获取水分, 这势必影响到植物获取水分的途径, 植物通过叶片能够获得多少水分?所获得的水分能否维持其生长?露水与植物叶片相互机制如何?这是今后研究的重点。此外, 露水为真菌和细菌等病原体提供感染宿主植物的环境条件, 促使植物发病。然而如何利用这一特点采用相应措施(如制造微生物试剂等)对植物病虫害进行防治还需进一步研究。
4 结论
基于黄土高原 52个气象站长时间序列的气象数据, 分析月、季尺度露日数时空变化特征、变化趋势及成因。在月尺度上, 黄土高原露水首先发生在3月武功, 终止于11月份, 5—10月全区域均存在露水; 9月露日数最长, 南部、东南部和西北部露日数达8~12 d, 全区域平均值为7 d; 5.77%~25.00%气象站点露日数在 6月和 8—11月以 0.02~0.15 d·a-1显著增加; 17.31%和7.68%气象站点露日数在4月和7 月以-0.09~-0.02 d·a-1显著降低。在季尺度上, 黄土高原露水发生在春、夏和秋季, 夏季和秋季露日数无显著差异; 露日数在秋季最长, 南部、东南部和西北部露水持续达 14~26 d, 全区域平均值为15 d;3.85%和 5.77%的气象站露日数在夏季和秋季分别以 0.25~0.09 d·a-1和 0.15~0.09 d·a-1显著增加; 5.77%气象站露日数在春季以-0.34~-0.07 d·a-1显著性降低。相对湿度、降雨、蒸发、饱和水汽压差和温度在不同时间尺度上对露日数影响不同, 但相对湿度和温度是影响露日数变化的最关键因素。
该研究对于全面了解气候变化条件下黄土高原露日数分布特征及变化趋势提供事实依据, 也为未来黄土高原植株病害预测、防治及风险评估提供一定参考价值。
References
[1]Tabari H, Marofi S, Aeini A, et al.Trend analysis of reference evapotranspiration in the western half of Iran[J].Agricultural and Forest Meteorology, 2011, 151(2): 128–136
[2]Talaee P H, Sabziparvar A, Tabari H.Observed changes in relative humidity and dew point temperature in coastal regions of Iran[J].Theoretical and Applied Climatology, 2012,110(3): 385–393
[3]Piao S L, Ciais P, Huang Y, et al.The impacts of climate change on water resources and agriculture in China[J].Nature,2010, 467(7311): 43–51
[4]Kang S Z, Hao X M, Du T S, et al.Improving agricultural water productivity to ensure food security in China under changing environment: From research to practice[J].Agricultural Water Management, 2017, 179: 5–17
[5]姚玉璧, 王毅荣, 李耀辉, 等.中国黄土高原气候暖干化及其对生态环境的影响[J].资源科学, 2005, 27(5): 146–152
Yao Y B, Wang Y R, Li Y H, et al.Climate warming and drying and its environmental effects in the Loess Plateau[J].Resources Science, 2005, 27(5): 146–152
[6]Chen H S, Shao M A, Li Y Y.Soil desiccation in the Loess Plateau of China[J].Geoderma, 2008, 143(1/2): 91–100
[7]He X B, Zhou J, Zhang X B, et al.Soil erosion response to climatic change and human activity during the Quaternary on the Loess Plateau, China[J].Regional Environmental Change,2006, 6(1/2): 62–70
[8]Huang J P, Zhang W, Zuo J Q, et al.An overview of the semi-arid climate and environment research observatory over the Loess Plateau[J].Advances in Atmospheric Sciences,2008, 25(6): 906–921
[9]Li Z, Liu W Z, Zhang X C, et al.Impacts of land use change and climate variability on hydrology in an agricultural catchment on the Loess Plateau of China[J].Journal of Hydrology, 2009, 377(1/2): 35–42
[10]Xin Z B, Yu X X, Li Q Y, et al.Spatiotemporal variation in rainfall erosivity on the Chinese Loess Plateau during the period 1956–2008[J].Regional Environmental Change, 2011,11(1): 149–159
[11]Shi H, Shao M A.Soil and water loss from the Loess Plateau in China[J].Journal of Arid Environments, 2000, 45(1): 9–20
[12]Chen L D, Wei W, Fu B J, et al.Soil and water conservation on the Loess Plateau in China: Review and perspective[J].Progress in Physical Geography, 2007, 31(4): 389–403
[13]谢宝妮, 秦占飞, 王洋, 等.基于遥感的黄土高原植被物候监测及其对气候变化的响应[J].农业工程学报, 2015,31(15): 153–160
Xie B N, Qin Z F, Wang Y, et al.Monitoring vegetation phenology and their response to climate change on Chinese Loess Plateau based on remote sensing[J].Transactions of the CSAE, 2015, 31(15): 153–160
[14]张强, 邓振镛, 赵映东, 等.全球气候变化对我国西北地区农业的影响[J].生态学报, 2008, 28(3): 1210–1218
Zhang Q, Deng Z Y, Zhao Y D, et al.The impacts of global climatic change on the agriculture in northwest China[J].Acta Ecologica Sinica, 2008, 28(3): 1210–1218
[15]邓浩亮, 周宏, 张恒嘉, 等.气候变化下黄土高原耕作系统演变与适应性管理[J].中国农业气象, 2015, 36(4): 393–405
Deng H L, Zhou H, Zhang H J, et al.Evolution and adaptive management of farming tillage system under climate change in the Loess Plateau[J].Chinese Journal of Agrometeorology,2015, 36(4): 393–405
[16]邓振镛, 张强, 王润元, 等.农作物主要病虫害对甘肃气候暖干化的响应及应对技术的研究进展[J].地球科学进展,2012, 27(11): 1281–1287
Deng Z Y, Zhang Q, Wang R Y, et al.The response of plant diseases and pests to climatic warmer-drying and its adaptive technique in the northwest China[J].Advances in Earth Sciences, 2012, 27(11): 1281–1287
[17]柏秦凤, 王景红, 张勇.黄土高原丘陵区红枣主要病虫害调查及预测[J].中国农学通报, 2016, 32(6): 176–181
Bai Q F, Wang J H, Zhang Y.Investigation and forecast of main diseases and insect pests of jujube in hilly region of Loess Plateau[J].Chinese Agricultural Science Bulletin, 2016,32(6): 176–181
[18]李文爱, 赵鹏, 王培新.陕西枣树主要病虫害及防治对策研究[J].西北林学院学报, 2007, 22(5): 120–123
Li W A, Zhao P, Wang P X.The disease and pests of jujube and their control strategies in Shaanxi Province[J].Journal of Northwest Forestry University, 2007, 22(5): 120–123
[19]Abu-Taleb A, Alawneh A J, Smadi M M.Statistical analysis of recent changes in relative humidity in Jordan[J].American Journal of Environmental Sciences, 2007, 3(2): 75–77
[20]Seidel T M, Grant A N, Pszenny A A, et al.Dewpoint and humidity measurements and trends at the summit of Mount Washington, New Hampshire, 1935–2004[J].Journal of Climate, 2007, 20(22): 5629–5641
[21]Beysens D.The formation of dew[J].Atmospheric Research,1995, 39(1/3): 215–237
[22]Beysens D.Dew nucleation and growth[J].Comptes Rendus Physique, 2006, 7(9): 1082–1100
[23]Agam N, Berliner P R.Dew formation and water vapor adsorption in semi-arid environments — A review[J].Journal of Arid Environments, 2006, 65(4): 572–590
[24]Malek E, McCurdy G, Giles B.Dew contribution to the annual water balances in semi-arid desert valleys[J].Journal of Arid Environments, 1999, 42(2): 71–80
[25]Hao X M, Li C, Guo B, et al.Dew formation and its long-term trend in a desert riparian forest ecosystem on the eastern edge of the Taklimakan Desert in China[J].Journal of Hydrology,2012, 472–473: 90–98
[26]高志永, 汪有科, 汪星, 等.黄土丘陵半干旱区枣林露水量研究[J].农业机械学报, 2015, 46(10): 105–115
Gao Z Y, Wang Y K, Wang X, et al.Dew amount of jujube plantation in semi-arid loess hilly-gully region[J].Transactions of the Chinese Society for Agricultural Machinery, 2015, 46(10): 105–115
[27]王胜, 张强.黄土高原半干旱区露水形成的大气物理特征研究[J].物理学报, 2011, 60(5): 059203
Wang S, Zhang Q.Atmospheric physical characteristics of dew formation in semi-arid in Loess Plateau[J].Acta Physica Sinica, 2011, 60(5): 059203
[28]张强, 王胜, 问晓梅, 等.黄土高原陆面水分的凝结现象及收支特征试验研究[J].气象学报, 2012, 70(1): 128–135
Zhang Q, Wang S, Wen X M, et al.An experimental study of land surface condense phenomenon and water budget characteristics over the Loess Plateau[J].Acta Meteorologica Sinica, 2012, 70(1): 128–135
[29]Grammatikopoulos G, Manetas Y.Direct absorption of water by hairy leaves ofPhlomisfruticosaand its contribution to drought avoidance[J].Canadian Journal of Botany, 1994,72(12): 1805–1811
[30]郑新军, 李嵩, 李彦.准噶尔盆地荒漠植物的叶片水分吸收策略[J].植物生态学报, 2011, 35(9): 893–905
Zheng X J, Li S, Li Y.Leaf water uptake strategy of desert plants in the Junggar Basin, China[J].Chinese Journal of Plant Ecology, 2011, 35(9): 893–905
[31]Liang X, Su D R, Yin S X, et al.Leaf water absorption and desorption functions for three turfgrasses[J].Journal of Hydrology, 2009, 376(1/2): 243–248
[32]Bourque C P A, Arp P A.Dawn-to-dusk evolution of air turbulence, temperature and sensible and latent heat fluxes above a forest canopy: Concepts, model and field comparisons[J].Atmosphere-Ocean, 1994, 32(2): 299–334
[33]Eller C B, Lima A L, Oliveira R S.Foliar uptake of fog water and transport belowground alleviates drought effects in the cloud forest tree species,Drimysbrasiliensis(Winteraceae)[J].New Phytologist, 2013, 199(1): 151–162
[34]Pedro Jr M J, Gillespie T J.Estimating dew duration.Ⅰ.Utilizing micrometeorological data[J]. Agricultural Meteorology, 1982, 25: 283–296
[35]Sentelhas P C, Gillespie T J, Gleason M L, et al.Operational exposure of leaf wetness sensors[J].Agricultural and Forest Meteorology, 2004, 126(1/2): 59–72
[36]Marta A D, De Vincenzi M, Dietrich S, et al.Neural network for the estimation of leaf wetness duration: Application to aPlasmoparaviticolainfection forecasting[J].Physics and Chemistry of the Earth, Parts A/B/C, 2005, 30(1/3): 91–96
[37]Marta A D, Orlandini S.Analysis of leaf wetness duration dynamics on a sunflower (HeliantusannuusL.) canopy[J].Physics and Chemistry of the Earth, Parts A/B/C, 2010,35(1/2): 31–34
[38]Kim K S, Taylor S E, Gleason M L, et al.Estimation of leaf wetness duration using empirical models in northwestern Costa Rica[J].Agricultural and Forest Meteorology, 2005,129(1/2): 53–67
[39]Sentelhas P C, Marta A D, Orlandini S, et al.Suitability of relative humidity as an estimator of leaf wetness duration[J].Agricultural and Forest Meteorology, 2008, 148(3): 392–400
[40]Huber L, Gillespie T.Modeling leaf wetness in relation to plant disease epidemiology[J]. Annual Review of Phytopathology, 1992, 30: 553–577
[41]Rao P S, Gillespie T J, Schaafsma A W.Estimating wetness duration on maize ears from meteorological observations[J].Canadian Journal of Soil Science, 1998, 78(1): 149–154
[42]Magarey R D, Russo J M, Seem R C, et al.Surface wetness duration under controlled environmental conditions[J].Agricultural and Forest Meteorology, 2005, 128(1/2):111–122
[43]Guo X N, Zha T S, Jia X, et al.Dynamics of dew in a cold desert-shrub ecosystem and its abiotic controls[J].Atmosphere, 2016, 7(3): 32
[44]Li X Y.Effects of gravel and sand mulches on dew deposition in the semiarid region of China[J].Journal of Hydrology,2002, 260(1/4): 151–160
[45]Lawrence M G.The relationship between relative humidity and the dewpoint temperature in moist air: A simple conversion and applications[J].American Meteorological Society, 2005, 86(2): 225–233
[46]Tabari H, Talaee P H.Analysis of trends in temperature data in arid and semi-arid regions of Iran[J].Global and Planetary Change, 2011, 79(1/2): 1–10
[47]Gocic M, Trajkovic S.Analysis of changes in meteorological variables using Mann-Kendall and Sen’s slope estimator statistical tests in Serbia[J].Global and Planetary Change,2013, 100: 172–182
[48]Goovaerts P.Geostatistical approaches for incorporating elevation into the spatial interpolation of rainfall[J].Journal of Hydrology, 2000, 228(1/2): 113–129
[49]Ye Y H, Zhou K, Song L Y, et al.Dew amounts and its correlations with meteorological factors in urban landscapes of Guangzhou, China[J].Atmospheric Research, 2007, 86(1):21–29
[50]Chen L, Meissner R, Zhang Y Q, et al.Studies on dew formation and its meteorological factors[J].Journal of Food,Agriculture & Environment, 2013, 11(2): 1063–1068
[51]张强, 王胜.关于干旱和半干旱区陆面水分过程的研究[J].干旱气象, 2007, 25(2): 1–4
Zhang Q, Wang S.Processes of water transfer over land surface in arid and semi-arid region of China[J].Arid Meteorology, 2007, 25(2): 1–4
[52]高志永, 汪有科, 周玉红, 等.微观时间尺度气象因子影响露水量的通径分析[J].西北林学院学报, 2014, 30(5): 12–18
Gao Z Y, Wang Y K, Zhou Y H, et al.Path analysis on sensitivity of meteorological factors to dew amount in micro-scale[J].Journal of Northwest Forestry University,2014, 30(5): 12–18
[53]Zangvil A.Six years of dew observations in the Negev Desert,Israel[J].Journal of Arid Environments, 1996, 32(4): 361–371
[54]Zuo H C, Bao Y, Zhang C J, et al.An analytic and numerical study on the physical meaning of pan evaporation and its trend in rencent 40 years[J].Chinese Journal of Geophysics,2006, 49(3): 607–616
[55]Luo W H, Goudriaan J.Dew formation on rice under varying durations of nocturnal radiative loss[J].Agricultural and Forest Meteorology, 2000, 104(4): 303–313
[56]Richards K.Observation and simulation of dew in rural and urban environments[J].Progress in Physical Geography, 2004,28(1): 76–94
[57]Lekouch I, Lekouch K, Muselli M, et al.Rooftop dew, fog and rain collection in southwest Morocco and predictive dew modeling using neural networks[J].Journal of Hydrology,2012, 448–449: 60–72
[58]问晓梅, 张强, 王胜, 等.陆面露水特征及生态气候效应的研究进展[J].干旱气象, 2008, 26(4): 5–11
Wen X M, Zhang Q, Wang S, et al.Research advance about characteristic of dewfall on land surface and its ecological and climatic effects[J].Arid Meteorology, 2008, 26(4): 5–11
[59]张强, 李宏宇.黄土高原地表能量不闭合度与垂直感热平流的关系[J].物理学报, 2010, 59(8): 5888–5895
Zhang Q, Li H Y.The relationship between surface energy balance unclosure and vertical sensible heat advection over the loess plateau[J].Acta Physica Sinica, 2010, 59(8):5888–5895
[60]Jackson T J, Moy L.Dew effects on passive microwave observations of land surfaces[J].Remote Sensing of Environment, 1999, 70(2): 129–137
[61]Muselli M, Beysens D, Mileta M, et al.Dew and rain water collection in the Dalmatian Coast, Croatia[J].Atmospheric Research, 2009, 92(4): 455–463
[62]Hanisch S, Lohrey C, Buerkert A.Dewfall and its ecological significance in semi-arid coastal south-western Madagascar[J].Journal of Arid Environments, 2015, 121: 24–31
[63]Clus O, Ortega P, Muselli M, et al.Study of dew water collection in humid tropical islands[J].Journal of Hydrology,2008, 361(1/2): 159–171
[64]Xu Y Y, Yan B X, Luan Z Q, et al.Dewfall variation by large-scale reclamation in Sanjiang Plain[J].Wetlands, 2012,32(4): 783–790
[65]李志, 赵西宁.1961—2009年黄土高原气象要素的时空变化分析[J].自然资源学报, 2013, 28(2): 287–299
Li Z, Zhao X N.Spatiotemporal analysis of meteorological elements on the Loess Plateau during 1961–2009[J].Journal of Natural Resources, 2013, 28(2): 287–299
[66]Willett K M, Gillett N P, Jones P D, et al.Attribution of observed surface humidity changes to human influence[J].Nature, 2007, 449(7163): 710–712
[67]Zhao G, Mu X, Wen Z, et al.Soil erosion, conservation, and eco-environment changes in the loess plateau of China[J].Land Degradation & Development, 2013, 24(5): 499–510
[68]丁一汇, 任国玉, 石广玉, 等.气候变化国家评估报告(Ⅰ):中国气候变化的历史和未来趋势[J].气候变化研究进展,2006, 2(1): 3–8
Ding Y H, Ren G Y, Shi G Y, et al.National assessment report of climate change (Ⅰ): Climate change in China and its future trend[J].Advances in Climate Change Research, 2006,2(1): 3–8
Spatiotemporal analysis of dew days in China’s Loess Plateau*
GAO Zhiyong1, WANG Youke2**, JIANG Peng3
(1.Department of Water Conservancy, Yangling Vocational & Technological College, Yangling 712100, China; 2.College of Water Resources and Architectural Engineering, Northwest A&F University / Research Center of Soil and Water Conservation and Ecological Environment, Chinese Academy of Sciences & Ministry of Education, Yangling 712100, China; 3.Development Research Center of the Ministry of Water Resources of China, Beijing 100038, China)
Global warming due to greenhouse effect has altered meteorological variables such as temperature, relative humidity,rainfall and sunshine hours.The resulting change of these variables could have strong effects that threaten population, agriculture, environment, economy and industry.It could even affect global food security and supply/demand of water resources in the world.The Loess Plateau in North China is a semiarid and sub-humid climate region and is well-known for severe soil erosion, fragile ecological environment and sensitivity to climate change.Climate change will have a major impact on the ecological environment and agricultural ecosystems.Given the above, temporal and spatial distribution of meteorological elements for the Loess Plateau region has been analyzed.However, there was little information on dew days on the plateau.DewDew day was a key parameter of hydrologic cycle and plant disease prevention.Analysis of the spatial distribution and long-term temporal trends of dew days and the relatedness with climatic variables may provide the basis for plant disease prediction and prevention in local areas.In this study, dew day data from 52 meteorological stations for the period 1961–2010 were calculated using a model.The spatial distribution of seasonal and monthly dew days was interpolated by Kriging and the temporal trends of the days examined using trend-free pre-whitening (TFPW) and Sen’s slope estimator.Correlation analysis explained the dew-day formation.The results showed that at monthly scale, dew days started in March and ended in November,with a monthly mean of 7 dew days.The maximum dew days were in the south, southeast and northwest of the Loess Plateau in September, with a range of 8–12 days.Analysis of dew days indicated significant positive trends for 5.77%–25.00% of the stations, with a variation of 0.02–0.15 d·a-1during the periods from August through November and June.Dew days with significant negative trends were found too, with the decrease in July and April by 0.02–0.09 d·a-1and for 7.68%–17.31% of the stations.At seasonal scale, dew days occurred in spring, summer and autumn, with a seasonal mean of 15 dew days.The maximum dew days were in autumn, with 14–26 dew days in the south, southeast and northwest of the plateau.Dew days with significant positive trends were observed in summer and autumn, which varied respectively by 0.09–0.25 d·a-1and 0.09–0.15 d·a-1for 3.85% and 5.77% of the stations.Dew days with significant negative trends were evident in spring, which varied by −0.34 to −0.07 d·a-1for 5.77% of the stations.Relative humidity and temperature had clear and dominant effects on the spatiotemporal trend of dew days.The study provided a quantitative basis for understanding dew day distribution and trend in the Loess Plateau under global climate change.It also provided a vital reference for future plant disease forecast, prevention and risk assessment.
May 11, 2017; accepted Jun.21, 2017
Loess Plateau; Dew day; Trend analysis; Mann-Kendall test; Sen’ slope
S161.9; S165+.28; P467
A
1671-3990(2017)11-1718-13
10.13930/j.cnki.cjea.170435
高志永, 汪有科, 姜鹏.黄土高原露日数变化趋势分析[J].中国生态农业学报, 2017, 25(11): 1718-1730
Gao Z Y, Wang Y K, Jiang P.Spatiotemporal analysis of dew days in China’s Loess Plateau[J].Chinese Journal of Eco-Agriculture, 2017, 25(11): 1718-1730
* 国家科技支撑计划项目(2015BAC01B03)和陕西统筹项目(2014KTCG01-03)资助
** 通讯作者: 汪有科, 主要从事作物高效用水和水土保持研究。E-mail: gjzwyk@vip.sina.com
高志永, 主要从事近地表汽态水研究。E-mail: GZYstruggling@163.com
2017-05-11 接受日期: 2017-06-21
* This study was supported by the National Key Technologies R&D Program of China (2015BAC01B03) and Shaanxi Science & Technology Co-ordination and Innovation Project (2014KTCG01-03).
** Corresponding author, E-mail: gjzwyk@vip.sina.com
猜你喜欢
四川蚕业(2022年2期)2022-11-19
环球时报(2022-05-05)2022-05-05
今日农业(2021年19期)2021-11-27
今日农业(2019年11期)2019-08-13
趣味(语文)(2019年3期)2019-06-12
淄博师专论丛(2019年1期)2019-04-04
淄博师专论丛(2019年1期)2019-04-04
作文·初中版(2017年4期)2017-04-18
中国火炬(2015年7期)2015-07-31