Detection of Quantitative Trait Loci for MaizeGrain Yield and Kernel-related Traits
2017-12-14 07:27,,,,,,
复旦学报(自然科学版) 2017年4期
, , , , , ,
(State Key Laboratory of Genetic Engineering, School of Life Sciences, Fudan University, Shanghai 200438, China)
DetectionofQuantitativeTraitLociforMaizeGrainYieldandKernel-relatedTraits
ZHANGYuna,ZHANGQiang,PANFangfang,CAIXiaoyun,ZHANGNing,LIXin,HUANGXueqing
(StateKeyLaboratoryofGeneticEngineering,SchoolofLifeSciences,FudanUniversity,Shanghai200438,China)
Maize(ZeamaysL.) is one of the most important cereal crops and playing an increasingly vital role, owing to its high yield potential. As a complex quantitative trait, grain yield are controlled by many quantitative trait loci(QTLs) and influenced by kinds of environmental factors. Maize ear is the main harvested organ and kernel is an important indication of grain quality. Therefore, the QTLs detection of ear and kernel traits is very important in maize breeding. In the study, a F2∶3mapping population consisting of 152 lines was constructed, which was derived from a cross between the parents Baicibaogu(P2) and Qiranhuang(P13). 176 polymorphic simple repeat sequence markers were used to explore QTL for ear row number(ERN), kernel number per row(RKN), and 100-kernel weight(HKW). A total of 14 QTLs detected were distributed on 9 chromosomes except chromosome 9. Single QTL accounted for the phenotypic variance ranged from 4.9% to 18.8%. Notably, a QTL cluster simultaneously controlled HKW and ERN on chromosome 6 and a QTL(qERN08-1) for ERN on chromosome 8 were specific to the population, among which qERN08-1 explained 12.4% of the phenotypic variance.
maize; quantitative trait loci; ear row number; kernel number per row; 100-kernel weight
1 Introduction
Maize(ZeamaysL.) is one of the most important cereal crops and playing an increasingly vital role, owing to its high yield potential. As a food, feed and industrial crop, the demand for maize is expanding. Additionally, with the decrease in the arable land and the rapid increase in global population in recent years, improvement in grain yield becomes more and more important in maize breeding[1]. Therefore, investigating the genetic mechanism of grain yield in maize has already become a key aim for researchers and breeders. However, grain yield is a complex trait and has relatively low heritability, which is genetically controlled by numerous quantitative trait loci(QTLs)/genes with minor genetic effect[2-4]and is affected by environmental factors[5-6]. A practicable strategy for elucidating the genetic architecture of grain yield is dissecting complex grain yield traits into relatively simple yield components, and then combining all of the genetic information underlying these yield components to elucidate the genetic basis of grain yield. The maize grain yield is composed of yield related components that include 100-kernel weight(HKW) and kernel number per ear. Kernel number per ear is composed of the ear row number(ERN) and the kernel number per row(RKN). Compared with grain yield, the yield-related components appear to be higher heritability and better stability across environments[1,3,7]. Especially, HKW, ERN and RKN are ideal model traits for quantitative genetic study, due to the fact that they are easy and accurate to measure. Meanwhile, the three traits exhibit significantly positive correlation with grain yield[8-10]. Thus, dissecting the genetic basis of yield-related components rather than grain yield itself would be more effective for the improvement of maize grain yield.
With the rapid development of molecular genetic marker technology and quantitative genetics in maize breeding, the identification and isolation of QTLs for maize grain yield and yield-related traits are promoted continuously. Since Helentjarisetal. published the first molecular marker linkage mapping of maize in 1986[11], a large number of QTLs for maize grain yield and yield-related components have been identified through linkage mapping in varieties of segregation populations[1,3,6,7,12-14]. The increasing QTLs for maize grain yield and its related traits have been mapped in all the 10 maize chromosomes. However, few consistent results have been provided among different studies. For instance, Huoetal. identified 3 QTLs for RKN on chromosomes 1, 3, and 10, respectively, using maize inbred lines Mo17 and TY6 as parents. In the same report, W138 and TY6 were employed as parents, and 6 QTLs for RKN were located on chromosomes 1(two), 3(one), 5(two) and 7(one)[15]. While in the study by Calderónetal, only one QTL was mapped on chromosome 1[16]. These different results are probably due to the different parental materials, environment factors, population sizes, and markers density[17-18]. Although numerous QTLs controlling grain yield-related traits have been identified on all 10 maize chromosomes, it is difficult to clone the genes for the QTLs, owing to the genomic complexity and the QTLs mapped in a large chromosome interval. So far, only a few of the QTLs for maize associated traits have been identified and cloned, includingtb1[19]for the branching number,vgt1 for flowering time,zfl2[20],fea2[21],KRN4[22],ub2 andub3[23]for ERN. Most genes for maize grain yield and its related traits are isolated by making use of maize mutants, such asbt1[24],rgf1[25],dek1[26],dek23[27],dek31[28],incw2[29],sh1[30],sh2[31],gln1-3 andgln1-4[32]. In short, the complexity of maize genomic and the limited number of cloned genes have led to a poor understanding of the genetic regulation of grain yield-related traits in maize. Therefore, selecting new parental materials and segregating population is necessary and significant in the study on QTL mapping for maize yield-related components.
In the present study, we try to identify QTLs for three grain yield-related traits in maize: 100-kernel weight, ear row number and kernel number per row using an F2∶3segregating population derived from a cross between two elite parental lines. The aim of this study was to provide a better basis for further mapping, to elucidate the genetic basis of yield-related traits, and to find some molecular markers tightly linked with the genetic loci controlling HKW, RKN and ERN, which can be used for marker-assisted selection(MAS) in maize breeding.
2 Materials and method
2.1 Plant materials
The experimental plant materials included two parental lines Baicibaogu(P2) and Qiranhuang(P13), and an F2segregation population consisting of 152 lines, which was derived from a cross between the two parental lines. Baicibaogu is the elite inbred line planted in Shiquan County, Shanxi Province and Qiranhuang is originated from Japan. The parents were chosen on the basis of their geographic origin and significantly different ear traits, especially 100-kernel weight, ear row number and kernel number per row.
2.2 Field experiments and statistical analyses
The field experiments were performed at two stations located in Songjiang District of Shanghai and Sanya of Hainan province, respectively. The F1was planted in Sanya in November 2014, F2∶3families were planted at the Dagang Maize Experiment field located in Songjiang District during 2015 and 2016. A randomized complete block design was employed with two replications. Each field plot consisted of 10 plants in a row with 3 m length and 0.67 m width. Local normal agricultural management practice in maize production was conducted in China with a planting density of 50000 plants per hectare. At maturity stage, all the representative plants of each row were harvested for traits measurement. Harvested ears were not air-dried until the grain weight changed. Traits measured included: (1) 100-kernel weight(g), measured as the grain weight of 100 kernels randomly chosen from the bulked kernels; (2) ear row number, scored as the number of rows in the middle of each ear; and (3) kernel number per row, scored as the number of kernels in a row from each ear. The average of each RIL replications of the three traits value was calculated for phenotypic data analysis and QTL mapping.
The SPSS20.0 software(http:∥www.spss.com) was used to perform statistics analysis. Analysis of variance and the phenotypic correlation coefficients among the traits were calculated using the “COR” function in the SPSS software. For each trait, the broad-sense heritability(H2) was estimated as the following formula:
2.3 Genetic map construction and QTL mapping
Young leaf samples were collected at the five-leaf stage of maize seedling, and total genomic DNA was extracted and purified using the modified CTAB method[34]from the young leaf of 152 individual F2plants whose traits were estimated based on their F2∶3families progeny test. More than 900 simple sequence repeat(SSR) molecular markers obtained from Maize Genetics and Genomics Database(MaizeGDB, http:∥www.maizeg db.org/) were chosen to detect polymorphism between the two parental lines, P2 and P13. Ultimately, a total of 176 polymorphic SSR markers were used to analyze the genotype of the F2individuals.
The polymerase chain reaction(PCR) mixture(10μL) contain 40—120ng genomic template DNA, 1μL 10×Taq buffer, 1.5mmol/L Mg2+, 0.2μmol/L dNTP, 0.4μmol/L primers(0.2μmol/L forward primer and 0.2μmol/L reverse primer), and 0.5U Taq DNA polymerase. PCR was performed in the touchdown PCR(TD PCR) cycling programs as follows: 94℃ for 3min, 36 cycles with 94℃ for 30s, a specific temperature depending on the primers for 30s(the annealing temperature was reduced by 1℃ from 65℃ to 50℃ per cycle in the former 16 cycles, and the Tm was 50℃ constantly in the latter 20 cycles), and 72℃ for 30s, then followed by a final extension at 72℃ for 10min.
According to the physical position of the SSR markers obtained from the genome sequencing results of B73, a physical map was constructed through assigning the informative markers to the corresponding chromosome. The software package MapQTL5.0 was used to identify and locate QTL on the linkage map by using interval mapping and multiple-QTL model(MQM) mapping methods as described in its reference manual(http:∥www.kyazma.nl). In a first step, putative QTLs were identified using interval mapping. Thereafter, the closest marker at each putative QTL was selected as a cofactor and the selected markers were used as genetic background controls in the approximate multiple QTL model of MapQTL5.0. LOD threshold values applied to declare the presence of QTL were estimated by performing permutation tests implemented in MapQTL5.0 using at least 1000 permutations of the original data set, resulting in a 95% LOD threshold of 2.9. The estimated additive genetic effect and the percentage of variance explained by each QTL and the total variance explained by all the QTL affecting a trait were obtained using MQM mapping.
3 Results
3.1 Phenotype of parental lines and F2∶3 families
The phenotype of the two inbred maize used to construct the mapping population were estimated in the study. P2 and P13 showed significant differences in 100-kernel weight, ear row number and kernel number per row. P13 had a greater HKW and RKN than P2. On the contrary, the ERN of P2 was higher than that of P13(Tab.1). The phenotypes of the three traits studied exhibited normal distributions in the F2∶3segregation population with a wide range of variation and obvious transgressive segregation, which is consistent with the characteristics of quantitative traits(Tab.2). High broad-sense heritabilities(H2) of the three traits ranged from 84.4%—89.4%(Tab.1), suggesting the genetic factors was primarily in the formation of the three traits. Additionally, the significantly positive correlation was observed between HKW and RKN(Tab.2). ERN had no significant correlation with HKW and RKN in this population.
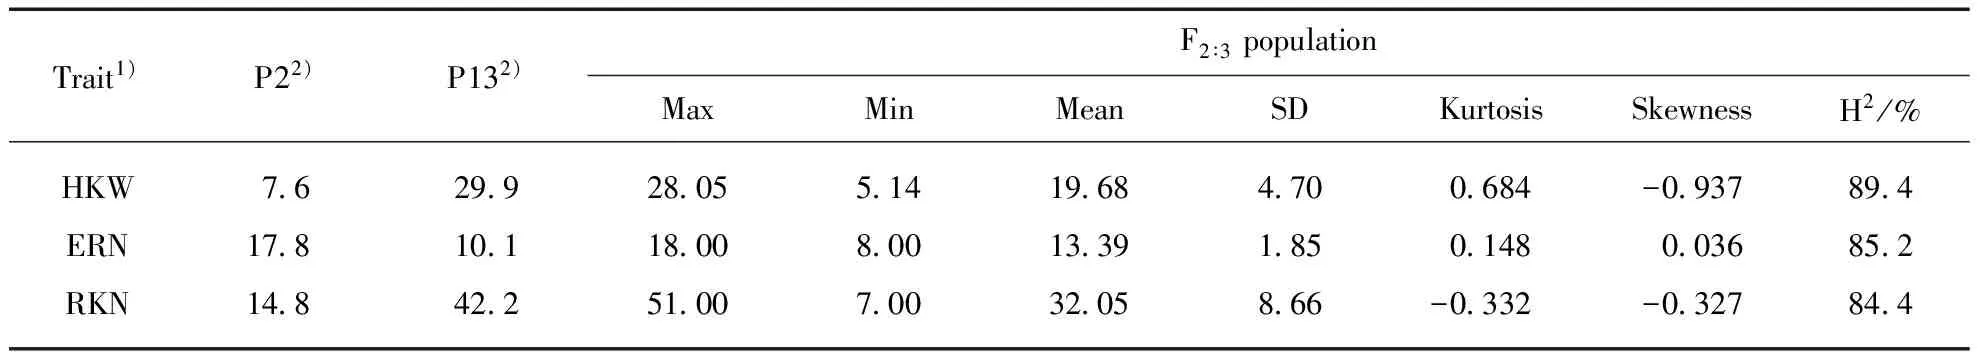
Tab.1 Phenotypes of the three yield-related traits in parental lines(P2 and P13) and F2∶3 family
1) HKW, 100-kernel weight; ERN, ear row number; RKN, kernel number per row. 2) All the differences between the two parents are statistically significant at the 0.01 probability level.
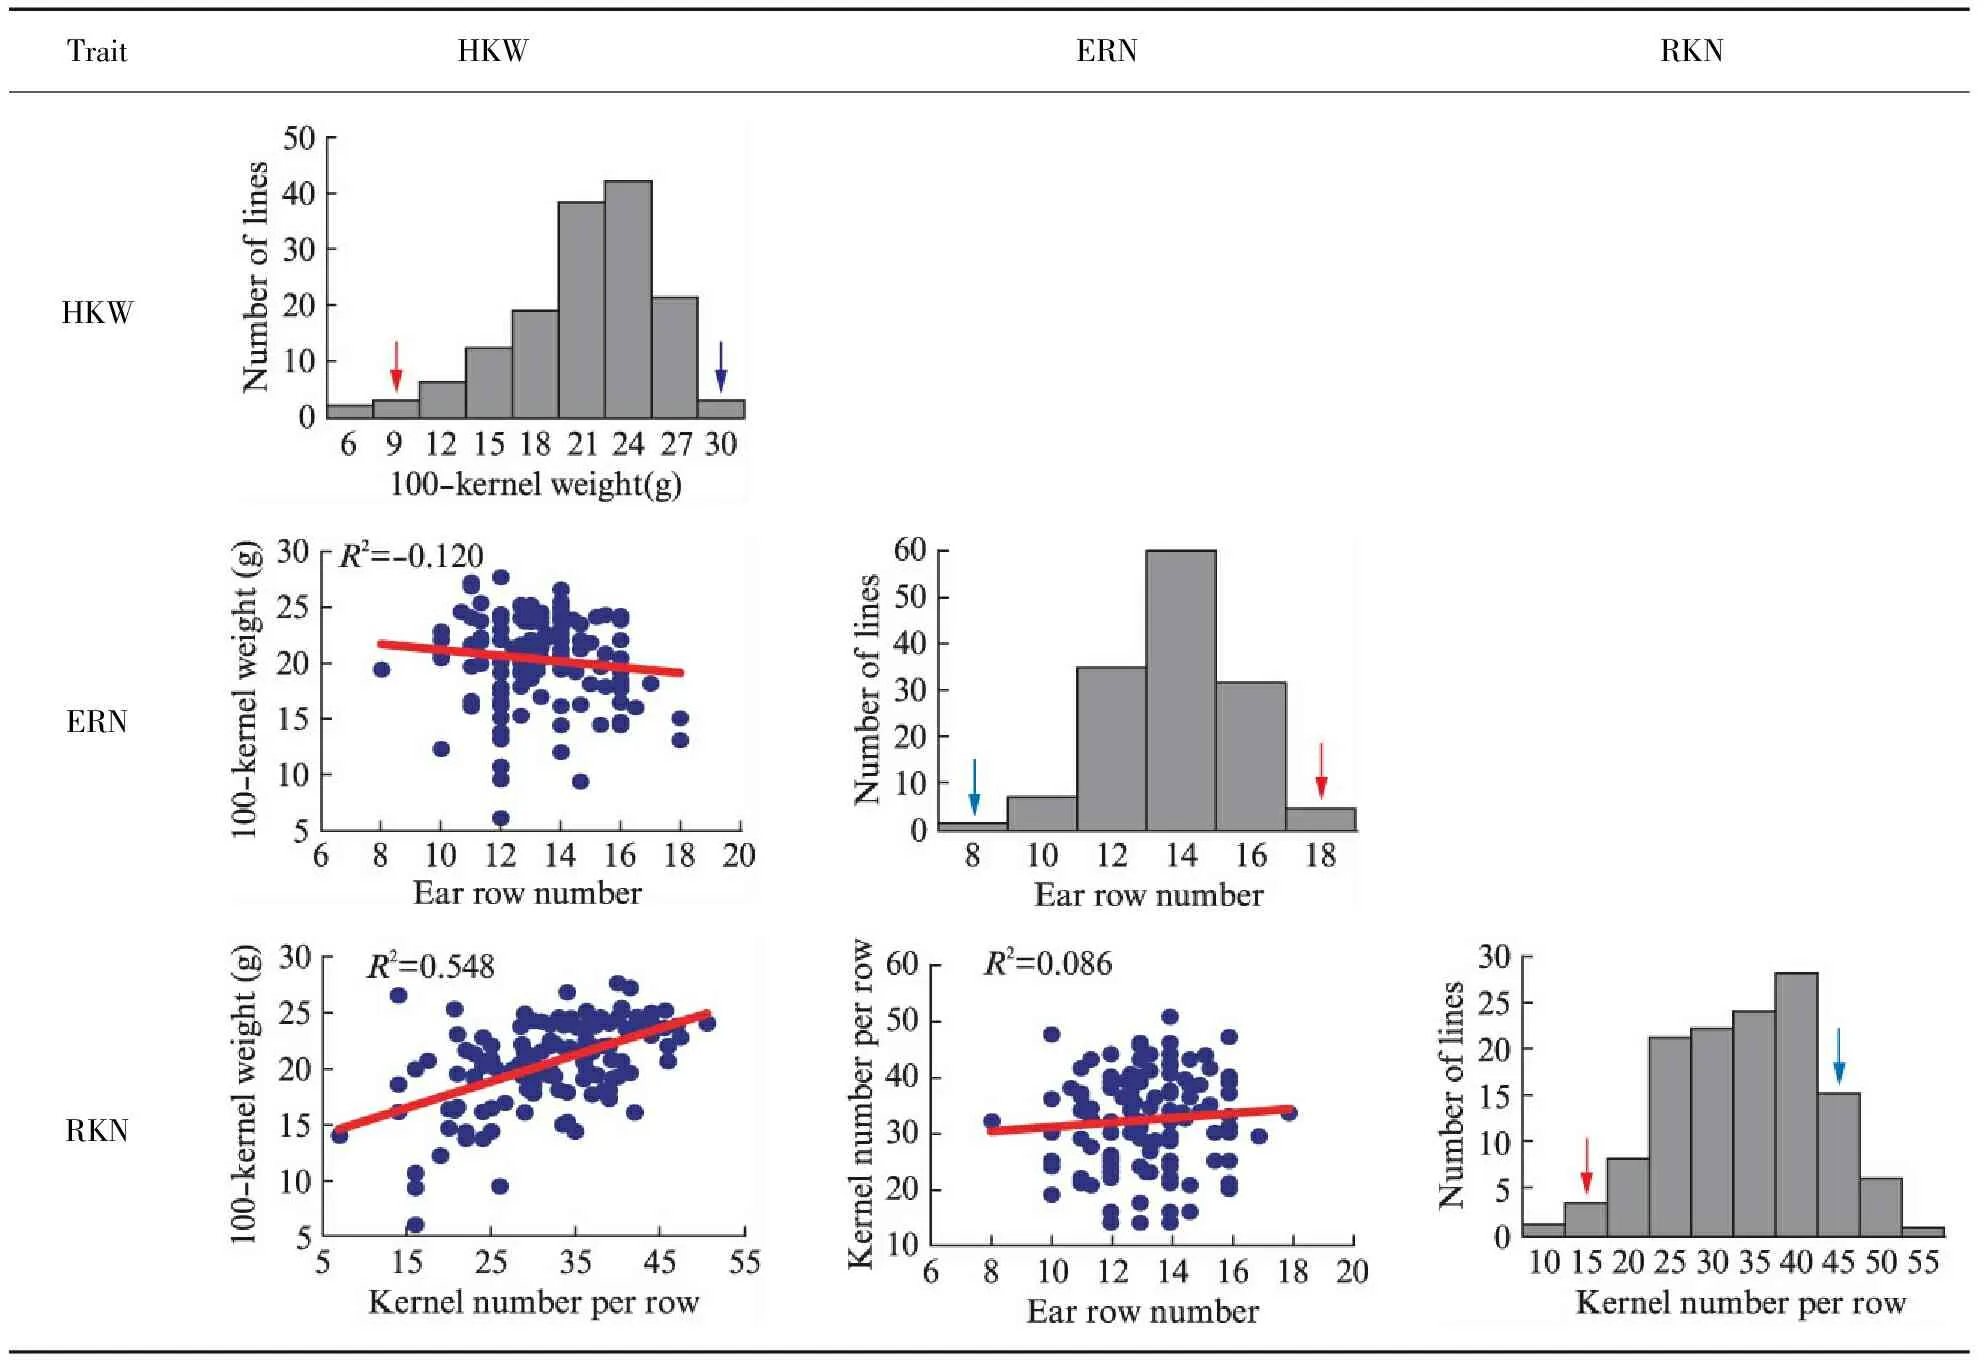
Tab.2 Frequency distribution of ERN, RKN and HKW, and correlation analysis among HKW, ERN and RKN in the F2∶3 family
Note: The red arrows indicate the average values of P2; the blue arrows indicate the average values of P13.
3.2 QTL analysis
A total of 176 polymorphic simple repeat sequence markers were used to construct marker linkage maps across all the 10 chromosomes with a size of 2058.26Mb, the average interval between two adjacent markers were 11.69Mb(Fig.1). Sequentially, 14 QTLs for ERN, RKN and HKW were identified in the F2∶3mapping population through single environments QTL analysis, distributed on 9 chromosomes except for chromosome 9.
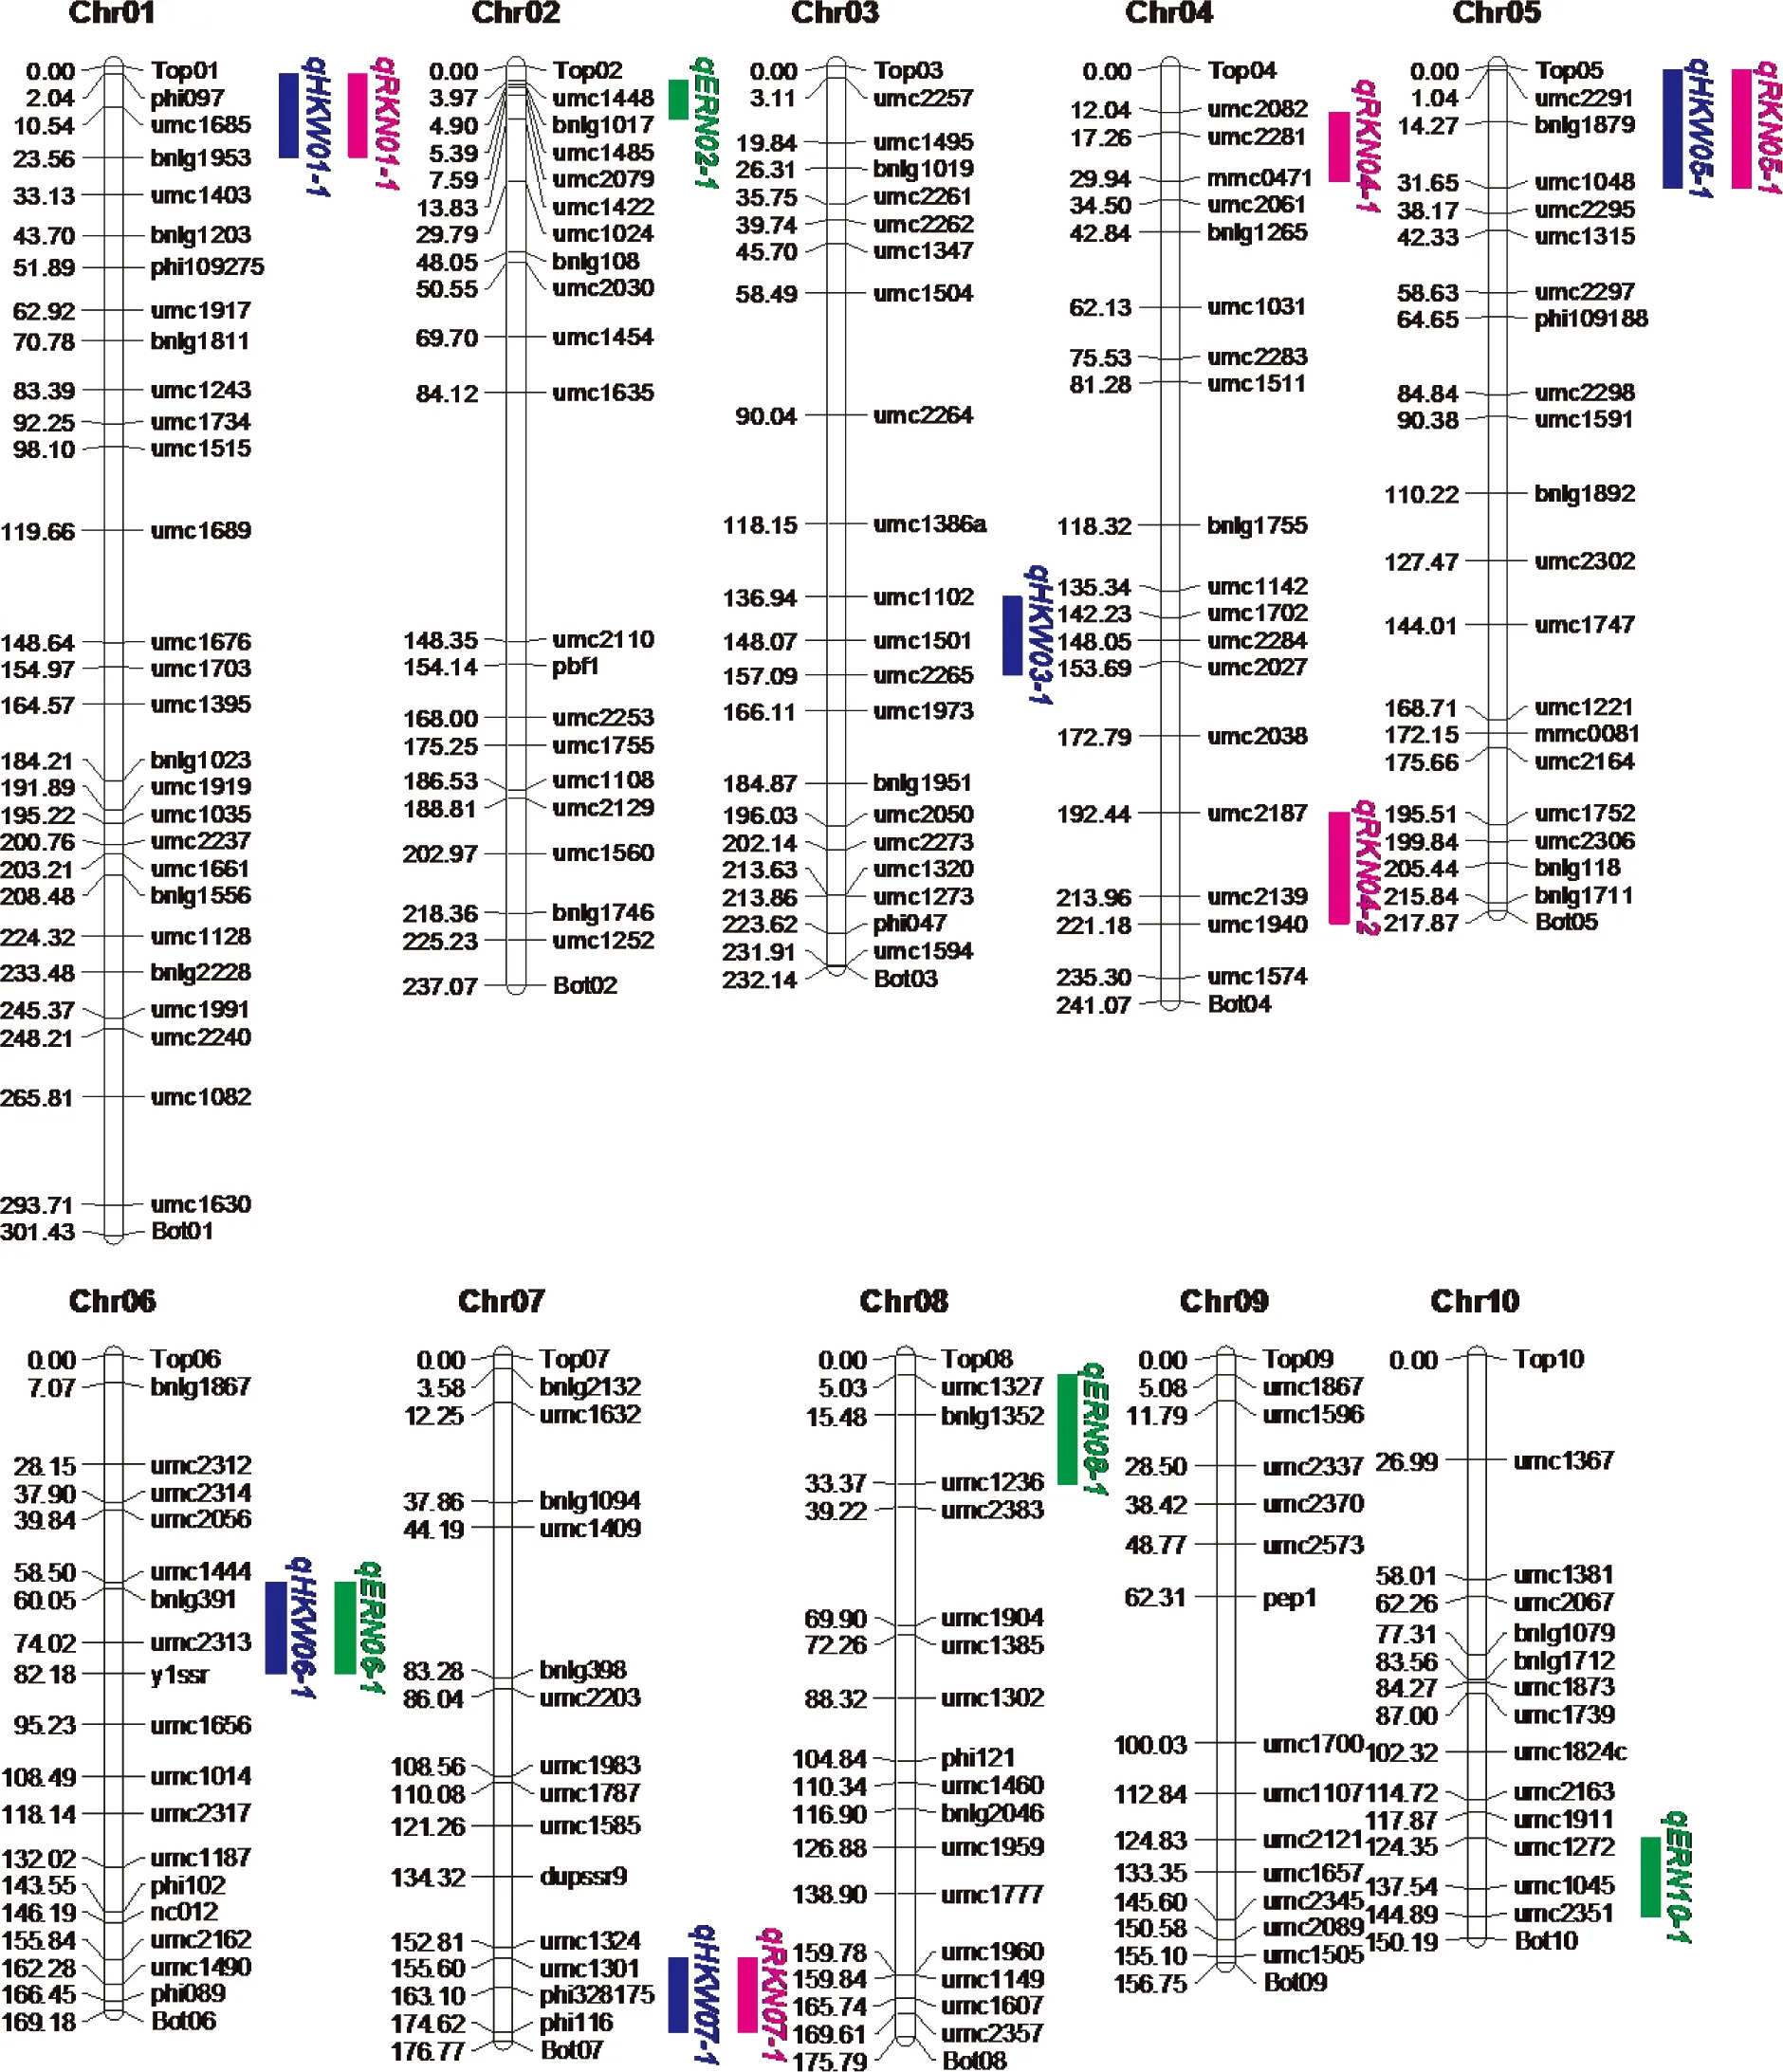
Fig.1 Genetic linkage map and major QTLs for ERN, RKN and HKW detected in F2∶3 population of P2×P13
Among them, four QTLs detected for ERN, accounting for 34.0% of the total phenotypic variance, were distributed on chromosome 2, 6, 8 and 10, respectively(Fig.1, Tab.3, see page 426). Single QTL explained the phenotypic variance ranged from 5.6% to 12.4%. Five QTLs identified for RKN, accounting for 41.6% of the total phenotypic variance, were distributed on chromosome 1, 4(two), 5 and 7, respectively. Single QTL explained 5.4%—11.8% of the phenotypic variance. Five QTLs on chromosome 1, 3, 5, 6 and 7, respectively, were detected for HKW(Fig.1, Tab.3), which explained 52.8% of the total phenotypic variance, and single QTL accounted for from 4.9% to 18.8% of the phenotypic variance. Additionally, four chromosomal regions were repeatedly detected for different traits, forming the QTL clusters(Tab.4). For example, three QTLs were simultaneously detected in HKW and RKN, locating on chromosome 1(phi097-bnlg1953 region), chromosome 5(umc2291—umc1048 region) and chromosome 7(umc1301-phi116 region), respectively. It was notable that all the QTLs for HKW and RKN had positive additive effect, and the whole QTLs for ERN had negative additive effect. The results indicated that the P13 contributed alleles for increasing HKW and RKN, and the P2 contributed alleles for increasing ERN.
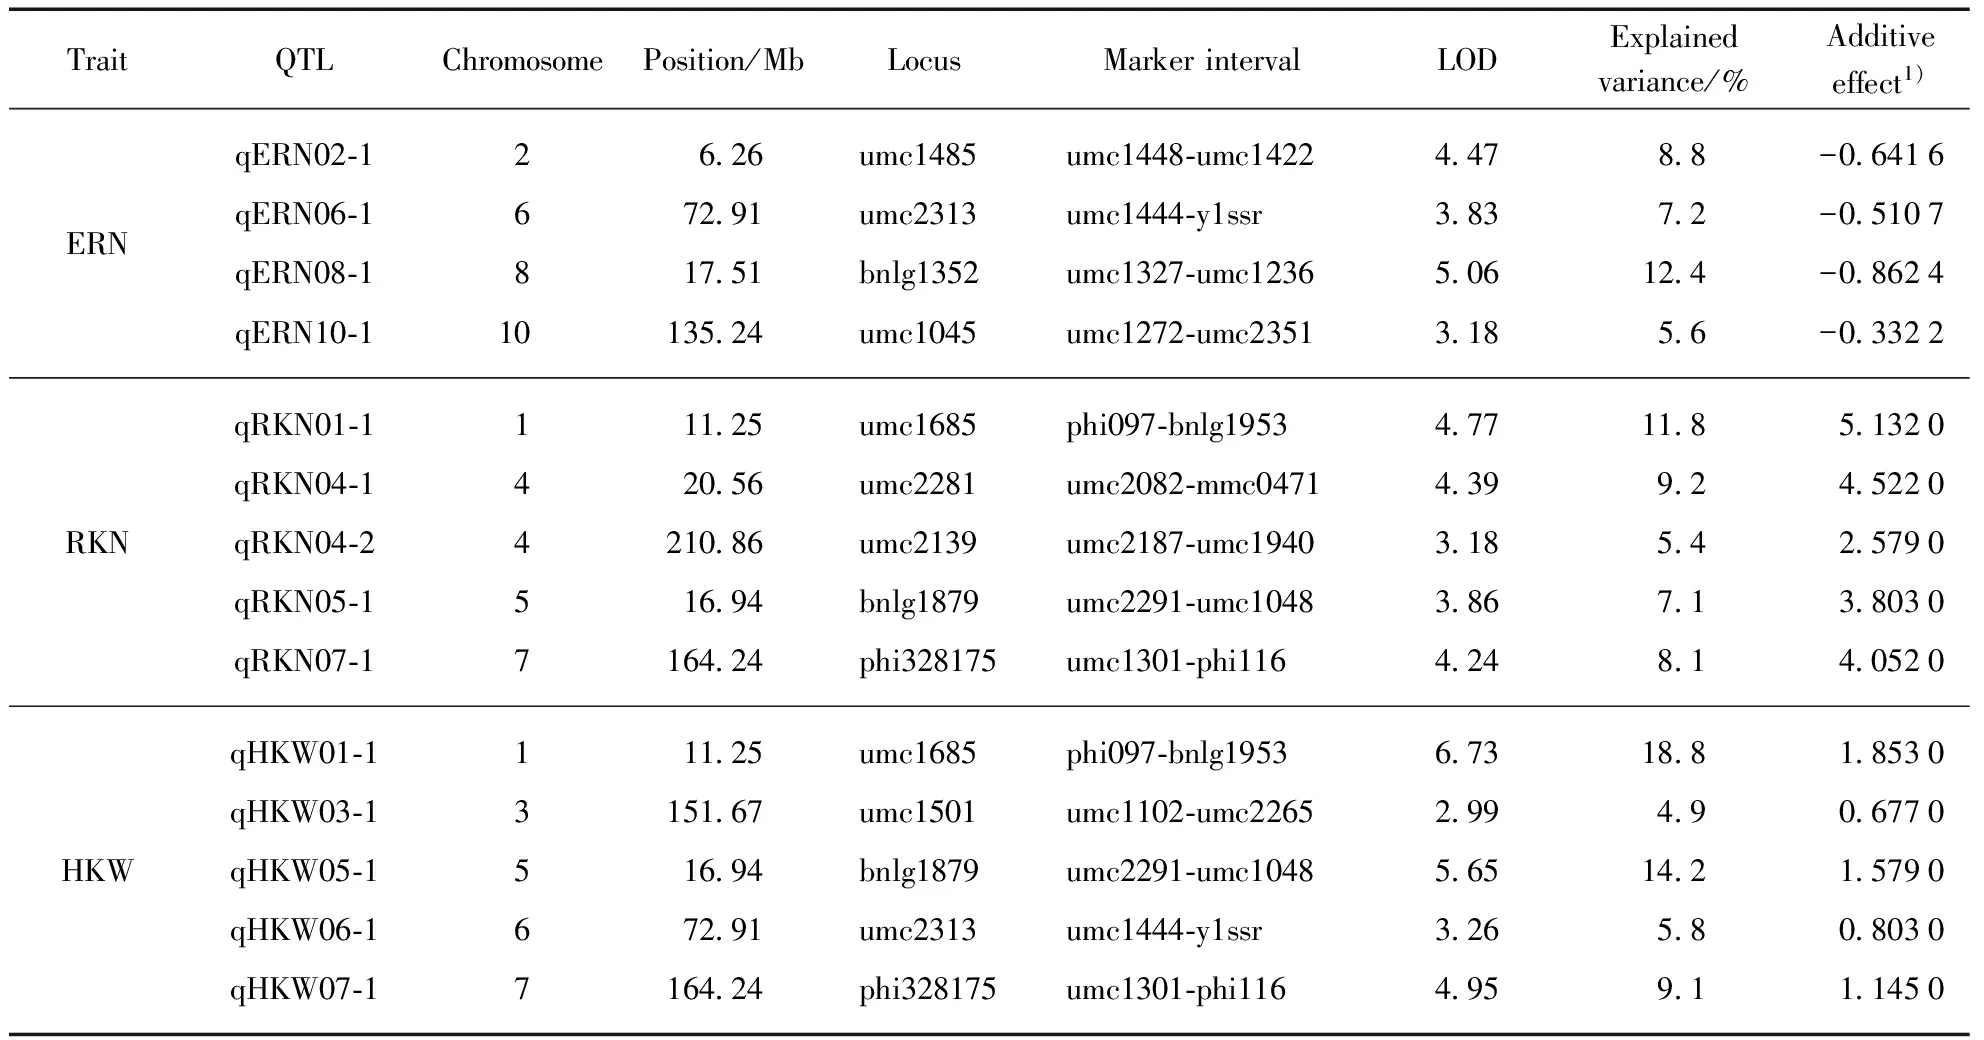
Tab.3 QTL analysis of maize ERN, RKN and HKW in the F2∶3 population of P2×P13
1) effect of the substitution of the P2 allele by the P13 allele. A positive value indicates that the P13 allele increases the value of the trait; a negative value indicates that the P2 allele increases the value of the trait.
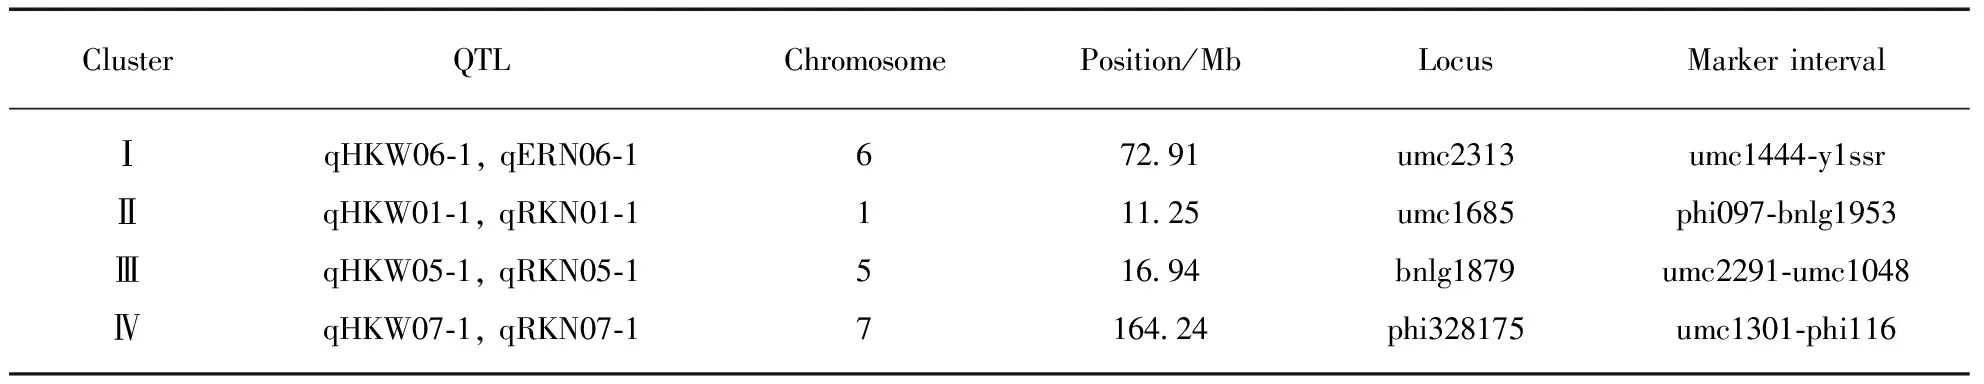
Tab.4 QTL clusters detected in the F2∶3 population of P2×P13
4 Discussion
The ultimate objective of mapping QTLs for certain traits is to dissect the molecular and genetic basis of their variation. Ear is the main harvested organ in maize, and kernel is an important indication of grain quality. Ear row number, kernel number per row and 100-kernel weight, which highly positive correlate with grain yield, are widely investigated grain yield-related traits and are important targets to improve maize yield. Therefore, identification and confirmation of QTLs responsible for the ear and kernel-related traits would provide greater opportunities for breeders to improve yield by marker-assisted breeding. In the past few decades, a large number of QTLs have been detected for ERN, RKN and HKW across diverse populations and environments on all the 10 chromosomes in maize(Fig.2).
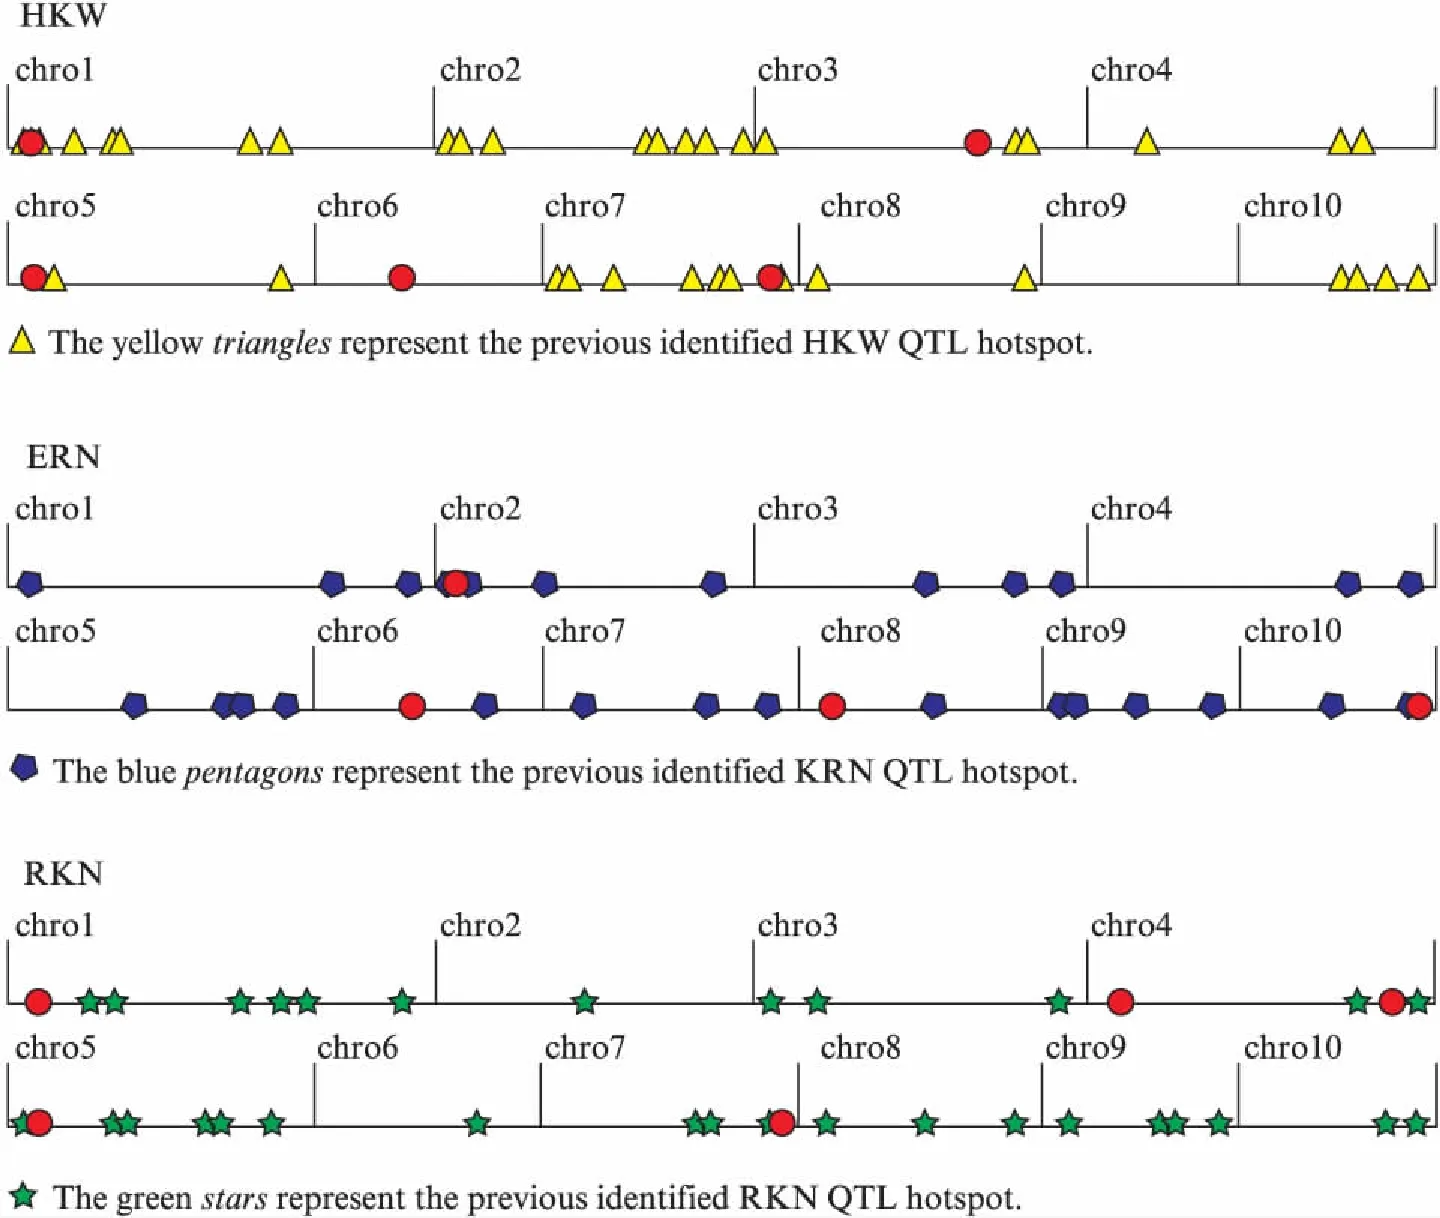
Fig.2 Comparison the QTLs detected in this study with the previous studyThe red dots represent the QTL detected in this study, and the physical distance for each chromosome is represented in Mb units on the horizontal axis.
In this study, there was a wide variation of ear and kernel-related traits in the F2∶3population derived from two parents with contrasting traits: P2(small ear and kernel) and P13(large ear and kernel). The close correlation among ear and kernel-related traits and the relatively high broad-sense heritability indicated stable phenotypic and genetic association among ERN, RKN and HKW. In terms of QTL mapping results, 14 QTLs were identified for the three traits, distributed on all the 10 chromosomes except chromosome 9. The disparate numbers of significant QTL per trait which ranged from 4 for ERN to 5 for HKW as well as a clustered distribution among genomic regions revealed the complex nature of the ear and kernel-related traits. Compared with previous studies(Fig.2), eight of the 14 QTLs were found located on the similar chromosomal locations under the condition of different mapping population and environment. We speculated that the hot spots for these consistent QTLs should be the important QTLs for ERN, RKN and HKW. Liuetal. reported a QTL for HKW on the umc1727—umc2224 region of maize chromosome 1[14], and Prodoetal. mapped a major QTL for HKW on the similar chromosome interval[35]. Given our results,qHKW01-1, which was closely linked to umc1685, also identified on the same chromosome region. It could explain 18.8% of the phenotypic variation, was an extremely important QTL for HKW. Besides,qHKW05-1 and qHKW07-1, the other two QTLs for HKW were also consistent with the detected regions of Liuetal[14]. qERN02-1 was an ear row number-associated locus detected in linkage mapping in our study, which was also identified in genome-wide association study by Liuetal[36]. Yangetaldetected two QTLs for kernel number per row(qcGPR1-5-1 andqzGPR1-7-1)[37], located near toqRKN05-1 andqRKN07-1 in our study, respectively. The consistent QTLs detected in different conditions show that these regions are extremely important in the control of the three traits, and these consistent QTLs can be used for the identification of candidate genes in future studies. In addition, the other six QTLs are unique to the population. It is worth mentioned that one of the co-located QTLs controlling HKW and ERN was located on chromosome 6 was unique to the population.qERN08-1 was also specific for ERN in this study, which explained 12.4% of the phenotypic variation. The novel QTL may be due to the specific genetic background from the two parents with contrasting traits[38]. Furthermore, after further validation, particularly in other breeding populations with diverse genetic backgrounds, the newly detected major QTLs in this study may serve a complementary role in revealing the genetic nature of ear and kernel-related traits.
In the overview of the identified QTL in this study, 4 QTL clusters comprising 8 QTLs were scattered on chromosomes 1, 5, 6 and 7(Tab.2, Tab.3; Fig.2). In the cluster Ⅱ, Ⅲ, Ⅳ, QTLs for HKW were always detected together with QTL for RKN. As we mentioned earlier,qHKW01-1 is a major QTL for HKW, andqRKN01-1 for RKN located on the same interval. Additionally, the other two co-located QTLs for HKW and RKN were located on chromosome 5 and 7, respectively. The co-localization of QTL for HKW and RKN was consistent with the significantly positive correlation between the two traits. The similar co-localization QTLs were widely reported[6,37]. Austin and Lee found that 53 of 80(66%) loci for grain yield and yield components were associated with 2 or more traits in maize[2]. Zhouetal. found that a QTL qEL7.2 for kernel number per row was simultaneously responsible for ear length and ear weight and the pleiotropic QTL was validated on bin 7.02 using a NIL-derived population[39].The co-localization of QTL for yield correlated traits might mean pleiotropy and/or tight linkage. The real situations can only be revealed by further study, through developing heterogeneous inbred families(HIFs) for these QTL regions for fine mapping and cloning of these QTLs.
In summary, an F2∶3population, derived from the two parental lines P2 with small ear and kernel and P13 with large ear and kernel, was used to map the QTLs associated with ear and kernel-related traits in our study. Fourteen QTLs for HKW, RKN and ERN were identified on 9 chromosomes except chromosome 9. The P13 contributed alleles for increasing HKW and RKN, and the P2 contributed alleles for increasing ERN. The results are helpful in determining the genetic basis of ear and kernel-related traits in maize breeding projects. By properly introgressing the identified QTLs or pyramiding the favorable alleles of these QTLs, maize yield may be increased through improving ear and kernel-related traits. Additionally, the information generated in this study could well aid in fine-mapping/cloning genes underlying the robust major QTL. However, due to the limited resolution in the present study, there could be hundreds or thousands of genes underlying the major QTL. Therefore, further QTL validation will be proceeding with heterogeneous inbred families(HIFs). This will provide valuable materials and genetic basis for subsequent fine mapping and cloning, and help to explore the genetic mechanism of them maize breeders to accelerate the genetic improvement of high-yield maize.
[1] YANG C, LIU J, RONG T Z. Detection of quantitative trait loci for ear row number in F2populations of maize [J].GenetMolRes, 2015,14(4): 14229-14238.
[2] AUSTIN D F, LEE M. Comparative mapping in F2∶3and F6∶7generations of quantitative trait loci for grain yield and yield components in maize [J].TheorApplGenet, 1996,92(7): 817-826.
[3] MESSMER R, FRACHBOUD Y, BNZIGER M,etal. Drought stress and tropical maize: QTL by environment interactions and stability of QTLs across environments for yield components and secondary traits [J].TheorApplGenet, 2009,119(5), 913-930.
[4] XU Q, SAITO H, HIROSE I,etal. The effects of the photoperiod-insensitive alleles se13, hd1 and ghd7, on yield components in rice [J].MolBreed, 2014,33(4), 813-819.
[5] BEAVIS W D, SMITH O S, GRANT D,etal. Identification of quantitative trait loci using a small sample of topcrossed and F4progeny from maize [J].CropSci, 1994,34(4): 882-896.
[6] YAN J B, TANG H, HUANG Y Q,etal. Quantitative trait loci mapping and epistatic analysis for grain yield and yield components using molecular markers with an elite maize hybrid [J].Euphytica, 2006,149(1): 121-131.
[7] PENG B, LI Y, WANG Y,etal. QTL analysis for yield components and kernel-related traits in maize across multi-environments [J].TheorApplGenet, 2011,122(7): 1305-1320.
[8] SABADIN P K, JUNIOR C L D S, SOUZA A P D,etal. QTL mapping for yield components in a tropical maize population using microsatellite markers [J].Hereditas, 2008,145(4): 194-203.
[9] LI M, GUO X, ZHANG M,etal. Mapping QTLs for grain yield and yield components under high and low phosphorus treatments in maize [J].PlantSci, 2010,178(5): 454-462.
[10] LIU R X, JIA H T, CAO X L,etal. Fine mapping and candidate gene prediction of a pleiotropic quantitative trait locus for yield related trait inZeamaysL. [J].PLoSOne, 2012,7(11): e49836.
[11] HELENTJARIS T, SLOCUM M, WRIGHT S,etal. Construction of genetic linkage maps in maize and tomato using restriction fragment length polymorphisms [J].TheorApplGenet, 1986,72(6), 761-769.
[12] STUBER C W, LINCOLN S E, WOLFF D W,etal. Identification of genetic factors contributing to heterosis in a hybrid from two elite maize inbred lines using molecular markers [J].Genetics, 1992,132(3): 823-839.
[13] VELDBOOM L R, LEE M. Molecular-marker facilitated studies of morphological traits in maize Ⅱ determination of QTL for grain yield and yield components [J].TheorApplGenet, 1994,89(4): 451-458.
[14] LIU Y, WANG L W, SUN C L,etal. Genetic analysis and major QTL detection for maize kernel size and weight in multi-environments [J].TheorApplGenet, 2014,127(5): 1019-1037.
[15] HUO D A, NING Q, SHEN X M,etal. QTL mapping of kernel number-related traits and validation of one major QTL for ear length in maize [J].PLoSOne, 2016,11(5): e0155506.
[17] BEAVIS W D. QTL analyses: Power, precision, and accuracy [M]∥Molecular dissection of complex traits. Boca Raton, FL, USA: CRC Press, 1998,145-162.
[18] MELCHINGER A E, UTZ H F, SCHÖN C C. Quantitative trait locus(QTL) mapping using different testers and independent population samples in maize reveals low power of QTL detection and large bias in estimates of QTL effects [J].Genetics, 1998,149(1): 383-403.
[19] DOEBLEY J F, STEC A, HUBBARD L. The evolution of apical dominance in maize [J].Nature, 1997,386(6624): 485-488.
[20] BOMBLIES K, DOEBLEYJ F. Pleiotropic effects of the duplicate maize FLORICAULA/LEAFY geneszfl1 andzfl2 on traits under selection during maize domestication [J].Genetics, 2016,172(1): 519-531.
[21] BOMMERT P, NAGASAWA N S, JACKSON D. Quantitative variation in maize kernel row number is controlled by the FASCIATED EAR2 locus [J].NatGenet, 2013,45(3): 334-337.
[22] LIU L, DU Y, SHEN X,etal.KRN4 controls natural variation of kernel row number in maize [J].PLoSGenetics, 2015,11(11): e1005670.
[23] CHUCK G S, BROWN P J, MEELRY R,etal. Maize SBP-box transcription factors unbranched2 and unbranched3 affect yield traits by regulating the rate of lateral primordia initiation [J].ProcNatAcadSciUSA, 2014,111(52): 18775-18780.
[24] COE E H, HOISINGTON D, CHAO S. Gene list and working maps [J].MaizeGenetCoopNewsLett, 1990,64: 134-163.
[25] MAITZ M, SANTANDREA G, ZHANG Z Y,etal. rgf1, a mutation reducing grain filling in maize through effects on basal endosperm and pedicel development [J].PlantJ, 2000,23(1): 29-42.
[26] LID S E, GRUIS D, JUNG R,etal. The defective kernel 1(dek1) gene required for aleurone cell development in the endosperm of maize grains encodes a membrane protein of the calpain gene superfamily [J].ProcNatlAcadSciUSA, 2002,99(8): 5460-5465.
[27] CLARK J K, SHERIDAN W F. Developmental profiles of the maize embryo-lethal mutants dek22 and dek23 [J].JHered, 1986, 77(2): 83-92.
[28] SHERIDAN W F. Maize developmental genetics: Genes of morphogenesis [J].AnnuRevGenet, 1988,22: 353-385.
[29] CARLSON S, CHOUREY P. A re-evaluation of the relative roles of two invertases, INCW2 and IVR1, in developing maize kernels and other tissues [J].PlantPhysiol, 1999,121(3): 1025-1035.
[30] WILSON L M, WHITT S R, IBEZ A M,etal. Dissection of maize kernel composition and starch production by candidate gene association [J].PlantCell, 2004,16(10): 2719-2733.
[31] CHEN M, SANMIGUEL P, DE OLIVEIRA A,etal. Microcolinearity in sh2-homologous regions of the maize, rice, and sorghum genomes [J].ProNatlAcadSciUSA, 1997,94(7): 3431-3435.
[32] MARTIN A, LEE J, KICHEY T,etal. Two cytosolic glutamine synthetase isoforms of maize are specifically involved in the control of grain production [J].PlantCell, 2006,18(11): 3252-3274.
[33] HALLAUER A R, MIRANDA J B. Quantitative genetics in maize breeding [M]. Iowa, USA: Iowa State University Press, 1988.
[34] SAGHAI-MAROOF M A, SOLIMAN K M, JORGENSEN R A,etal. Ribosomal DNA spacer length polymorphisms in barley: Mendelian inheritance chromosomal location and population and population dynamics [J].ProcNatlAcadSciUSA, 1984,81(24): 8014-8018.
[36] LIU L, DU Y, HUO D,etal. Genetic architecture of maize kernel row number and whole genome prediction [J].TheorApplGenet, 2015,128(11): 2243-2254.
[37] YANG G H, LI Y L, WANG Q L,etal. Detection and integration of quantitative trait loci for grain yield components and oil content in two connected recombinant inbred line populations of high-oil maize [J].MolBreed, 2012,29(2): 313-333.
[38] DUDLEY J W, DIJKHUIZEN A, PAUL C,etal. Effects of random mating on marker-QTL associations in the cross of the Illinois high protein X illinois low protein maize strains [J].CropSci, 2004,44(4): 1419-1428.
[39] ZHOU G, ZHU Q, YANG G,etal.qEL7.2 is a pleiotropic QTL for kernel number per row, ear length and ear weight in maize(ZeamaysL.) [J].Euphytica, 2015,203(2): 429-436.
玉米产量相关性状的QTL定位与剖析
张玉娜,张 强,潘芳芳,蔡晓芸,张 宁,李 鑫,黄雪清
(复旦大学 生命科学学院 遗传工程国家重点实验室,上海 200438)
玉米因其自身具有高产潜质而成为了当今世界最重要的粮食作物之一.玉米产量是复杂的数量性状,由许多主/微效基因控制,易受各种环境因素影响.果穗是玉米的主要收获器官,籽粒性状是玉米品质的重要体现,因此发掘玉米穗部性状和籽粒性状相关QTL对玉米的遗传改良,培育优质高产的玉米具有重要意义.本研究白刺包谷(P2)和妻染黄(P13)为亲本构建了包含152个家系的F2∶3作图群体,选择在两亲本间具有多态性的176个微卫星标记构建遗传图谱,对产量相关性状进行了单环境的QTL定位与分析.最终定位到了14个QTL,分布在除9号染色体外的其余9条染色体上,单个QTL可解释的表型变异率为4.9%~18.8%.值得注意的是,在6号染色体上的百粒重和穗行数的一致性QTL(qHKW06-1和qERN06-1) 与8号染色体上的穗行数QTL(qERN08-1)是本研究中特有的,其中qERN08-1解释了12.4%的表型变异率.
玉米; 数量性状位点; 穗行数; 行粒数; 百粒重
0427-7104(2017)03-0421-10
date: 2016-10-28
National Natural Science Foundation of China(31471151)
Biography: ZHANG Yuna(1992—), female, graduate candidate; Corresponding author: HUANG Xueqing, male, professor, E-mail: xueqinghuang@fudan.edu.cn.
Q37DocumentcodeA
猜你喜欢
长江蔬菜(2021年12期)2021-04-04
读天下(2020年4期)2020-04-14
中国种业(2019年7期)2019-07-24
中国果业信息(2019年11期)2019-01-05
中国种业(2018年2期)2018-03-06
现代园艺(2017年21期)2018-01-03
西南农业学报(2016年5期)2016-05-17
中国康复理论与实践(2015年10期)2015-12-24
医学研究杂志(2015年5期)2015-06-10
现代检验医学杂志(2015年5期)2015-02-06