
Leaf area index based nitrogen diagnosis in irrigated lowland rice
2018-01-04 02:04LIUXiaojunCAOQiangYUANZhaofengLIUXiaWANGXiaolingTIANYongchaoCAOWeixingZHUYan
LIU Xiao-jun, CAO Qiang, YUAN Zhao-feng, LIU Xia, WANG Xiao-ling, TIAN Yong-chao, CAO Wei-xing,ZHU Yan
National Engineering and Technology Center for Information Agriculture/Key Laboratory for Crop System Analysis and Decision Making, Ministry of Agriculture/Jiangsu Key Laboratory for Information Agriculture/Jiangsu Collaborative Innovation Center for Modern Crop Production/Nanjing Agricultural University, Nanjing 210095, P.R.China
RESEARCH ARTICLE
Leaf area index based nitrogen diagnosis in irrigated lowland rice
LIU Xiao-jun, CAO Qiang, YUAN Zhao-feng, LIU Xia, WANG Xiao-ling, TIAN Yong-chao, CAO Wei-xing,ZHU Yan
National Engineering and Technology Center for Information Agriculture/Key Laboratory for Crop System Analysis and Decision Making, Ministry of Agriculture/Jiangsu Key Laboratory for Information Agriculture/Jiangsu Collaborative Innovation Center for Modern Crop Production/Nanjing Agricultural University, Nanjing 210095, P.R.China
Leaf area index (LAI) is used for crop growth monitoring in agronomic research, and is promising to diagnose the nitrogen(N) status of crops. This study was conducted to develop appropriate LAI-based N diagnostic models in irrigated lowland rice. Four field experiments were carried out in Jiangsu Province of East China from 2009 to 2014. Different N application rates and plant densities were used to generate contrasting conditions of N availability or population densities in rice. LAI was determined by LI-3000, and estimated indirectly by LAI-2000 during vegetative growth period. Group and individual plant characters (e.g., tiller number (TN) and plant height (H)) were investigated simultaneously. Two N indicators of plant N accumulation (NA) and N nutrition index (NNI) were measured as well. A calibration equation (LAI=1.7787LAI2000–0.8816,R2=0.870**) was developed for LAI-2000. The linear regression analysis showed a signi ficant relationship between NA and actual LAI (R2=0.863**). For the NNI, the relative LAI (R2=0.808**) was a relatively unbiased variable in the regression than the LAI (R2=0.33**). The results were used to formulate two LAI-based N diagnostic models for irrigated lowland rice(NA=29.778LAI–5.9397; NNI=0.7705RLAI+0.2764). Finally, a simple LAI deterministic model was developed to estimate the actual LAI using the characters of TN and H (LAI=–0.3375(TH×H×0.01)2+3.665(TH×H×0.01)–1.8249, R2=0.875**). With these models, the N status of rice can be diagnosed conveniently in the field.
leaf area index, rice, LAI-2000, nitrogen diagnosis, plant characters
1. Introduction
Leaf surfaces are the primary border of energy and mass exchange. The important processes such as canopy interception, evapotranspiration, and gross photosynthesis are directly proportional to the leaf area index (LAI) (Fang and Liang 2008; Liu and Li 2016), de fined as the one-sided green leaf area per unit ground area (Stroppiana et al.2006). The LAI being a very important variable in agronomic research (Soltani and Galeshi 2002), has been integrated/implemented in crop growth modeling, dynamic simulations of carbon and water, and crop nitrogen (N) dilution and diagnosis (Wang et al. 2002; Heuvelink et al. 2007; Xue and Yang 2008; Ata-Ul-Karim et al. 2014).
The LAI can be measured in situ either directly or indirectly.Direct methods measure the area of representative leaf samples and they are the only way to determine the actual leaf area. However, they are laborious and destructive,which limits their practical implementation in field. Alternat ively, indirect measurements can estimate LAI by evaluating some variables obtained easily. For example, optimal instruments are widely used to measure the radiation transmitted through the canopy, from which the LAI can be determined (Welles and Cohen 1996). Among the various commercial optical instruments currently available for indirect in situ LAI estimation, the LAI-2000 (LI-COR, Lincoln,NE, USA) is the most widely used. The LAI-2000 measures diffuse radiation in five distinct angular bands around the zenith to yield relatively accurate leaf area information with a single measurement only. This method is better than the one that relies on linear sensors (Welles and Cohen 1996).However, forest research has shown that the LAI determined with the LAI-2000 is considerably smaller than the actual LAI measured directly (Stenberg et al. 1994; White et al. 2000).By contrast, Dingkuhn et al. (1999) used the LAI-2000 to estimate the LAI of upland rice (Oryza sativa L.) and showed that the values within an LAI range of 0.2–2.0 were the same as those obtained by direct measurements. In the study of Sone et al. (2009), the two methods yielded equivalent results in upland rice for LAI values<4. However, the same research in paddy rice showed that LAI-2000 tends to underestimate LAI when LAI value>1, where the actual LAI can reach to 4 just at the end of tillering stage (Stroppiana et al. 2006). These studies indicated proper validation is needed when using the LAI-2000 to measure the LAI of a speci fic species or genotype both in forest and in crops.
Among rice ecosystems, irrigated lowland rice accounts for approximately 55% of the world’s rice planted area and 76% of global rice production (Fageria 2003; Fageria et al.2003). In addition, the LAI of irrigated lowland rice can reach 7 at the booting or heading stages, therefore it is essential to study the performance of LAI-2000 in irrigated lowland rice.
Nitrogen (N) is a major limiting factor after water de ficit for crop production, and therefore has a marked effect on the LAI. Various diagnostic methods, including those based on soil nitrate measurements (Isfan et al. 1995), the N nutrition index (NNI) (Debaeke et al. 2006; Ziadi et al. 2008), and the leaf N concentration (LNC) (Errecart et al. 2012), have been developed to optimize N management in crops. However,each method has its limitation, and the improvement of N diagnostic models is still urgently needed. Since most of the N in crops is contained in the green leaves during crop growth period, LAI is a very sensitive indicator of changes in crop N demand within a growing season (Wood et al. 2003).
Since the LAI is mainly used to monitor changes of canopy structure, its application in N diagnosis requires firstly to relate with proper N indicators, such as leaf N and chlorophyll contents (Yin et al. 2003; Heuvelink et al. 2007).However, these two N indicators together account for <50%of whole-plant N uptake (Makino and Mae 1997), given that most of the plant N accumulation (NA) occurs in the shoots. Indeed, previous studies have shown a signi ficantly positive correlation between plant NA and LAI under an adequate supply of N fertilizer (Plenet and Lemaire 1999).These observations suggest the use of NA as a promising N indicator in LAI-based N diagnosis. In recent years, the NNI, determined by dividing the actual plant N concentration by the critical N concentration, has been widely used in crop N diagnosis (Debaeke et al. 2006; Prost and Jeuffroy 2007;Yuan et al. 2016b). Since the NNI is linearly related to the chlorophyll content (Houlès et al. 2007), and NNI has a similar linear relationship to NA (Lemaire et al. 2008), thus,a key question is whether the NNI is an ideal N indicator for LAI. Although lots of researches have been conducted to optimize the N diagnosis in crops production, the controversy still exists. In comparison to soil nitrate measurement, LNC and NNI approaches, LAI approach was few reported in the literature. However, the LAI is of considerable importance as a basis for varying N supplementation rates, as it takes into account the current condition of growing crops. We hypothesized LAI approach is an appropriate tool for diagnosing the crop N status, and three LAI estimation methods were compared to facilitate the implementation of this tool.
The main objectives were, to analyze the correlation between LAI-2000 and LI-3000 based LAI in irrigated lowland rice, to develop N diagnostic models based on LAI and potential N indicators (NA and NNI), and to establish a simple model for estimating the LAI in the field that could be used for diagnosing rice N status.
2. Materials and methods
2.1. Field experiments
Four field experiments were conducted from 2009 to 2014 in Jiangsu Province of East China. Different N application rates(0–375 kg ha–1) were used to generate contrasting conditions of N availability in four japonica rice, Wuxiangjing 14(WXJ-14), Wuyunjing 19 (WYJ-19), Yongyou 8 (YY-8), and Wuyunjing 24 (WYJ-24), and two indica rice, Liangyoupei 9(LYP-9) and Y liangyou 1 (YLY-1). Detailed information is shown in Table 1. A randomized complete design with three replications was used in experiments 2, 3 and 4, in which the hill spacing was 0.25 m×0.15 m. A split-plot design was used in experiment 1 to achieve different N rates (150 and 300 kg N ha–1) and plant densities (0.5 m×0.15 m,0.3 m×0.15 m, and 0.1 m×0.15 m). Two seedlings per hill were transplanted manually in the 5 m×6 m plots in all experiments. The distribution of total N at different growth stages was 50% before transplanting, 20% at tillering stage,and 30% at booting stage. Phosphorus and potassiumfertilizers were added to the soil before transplanting as monocalcium phosphate Ca(H2PO4)2and potassium chloride(KCl) at rates of 135 kg P2O5ha-1and 190 kg K2O ha-1,respectively.
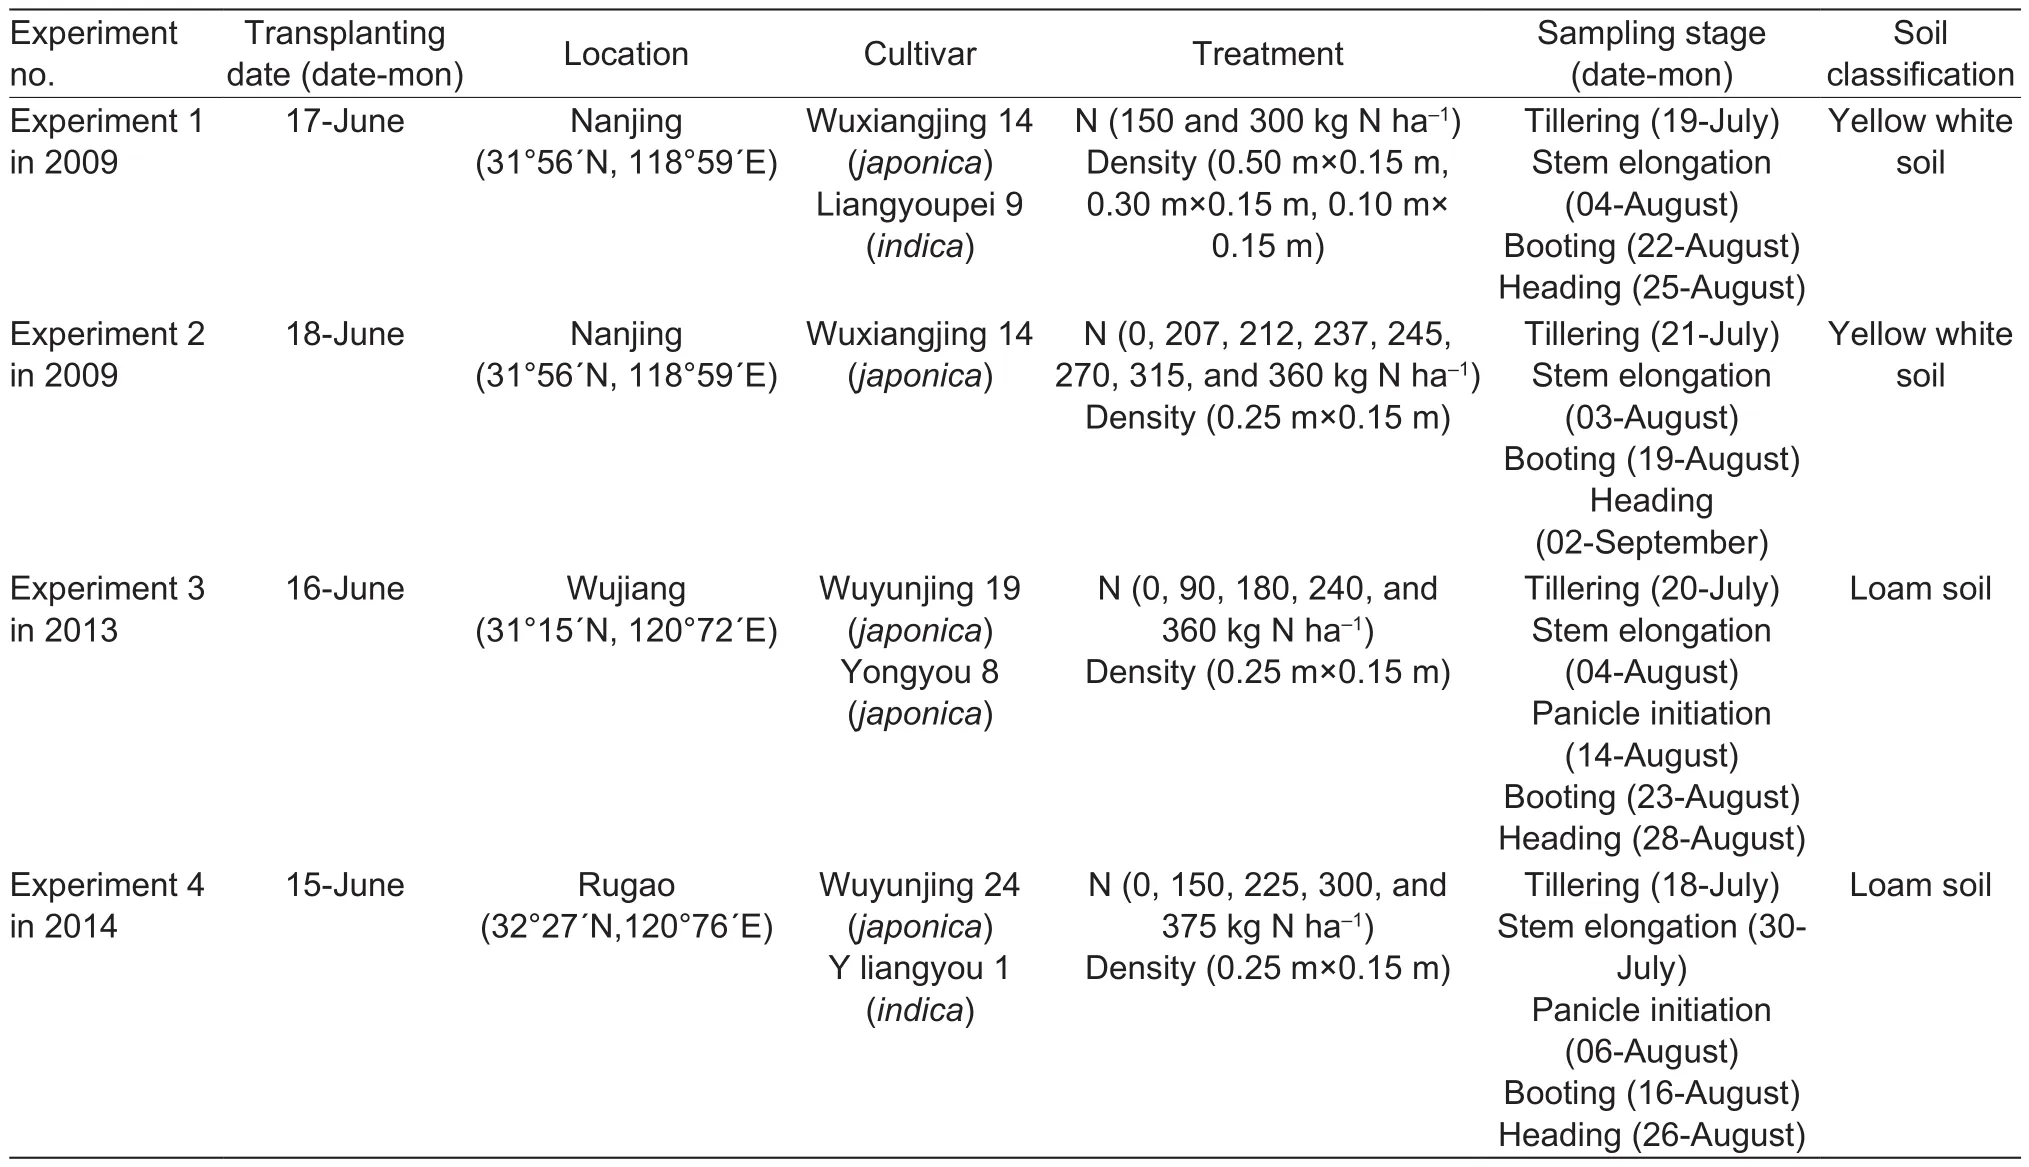
Table 1 Basic information about four field experiments used in the study
2.2. Sampling and measurements
At the tillering (TI), stem elongation (SE), panicle initiation(PI), booting (BT), and heading (HD) stages, the LAI-2000(LI-COR, Lincoln, NE, USA) was used for non-destructively estimation of LAI. The measurements were conducted at dusk and dawn and consisted of a sequence of readings(one above and four below the rice canopy) taken three times at each plot with a 90° view cap (Sone et al. 2009).
Tiller number (TN, 10 000 plants ha–1) and plant height(H, m) were estimated by counting or measuring the plants on 20 hills within the plot before each sampling, followed by sampling of the average tillers on the five hills. Rice plants were manually uprooted, and cut at ground level. Fresh plants were separated into green leaf blade (leaf) and culm plus sheath (stem). The area of all the separated green leaves was measured by LI-3000 leaf area meter (LI-COR, Lincoln,NE, USA). And, the LAI determined with the LI-3000 served as the actual LAI of the corresponding plot. In addition, the length (L, cm) and width (W, cm) of the uppermost four fully expanded leaves of the five main culms were measured using a ruler. Fresh plants were separated into leaf and stem, heated for 30 min at 105°C to halt metabolic processes,and dried at 80°C in a forced-draft oven until they reached a constant weight. Leaf and stem dry matters were determined from this material, followed by calculation of the leaf and stem N concentration with the micro-Kjeldahl method. Grain yield was determined for a 2-m2area in each plot and adjusted to a moisture content of 14%.
2.3. Data analysis
Comparison of LAILeaf area indices measured directly(using the LI-3000) and indirectly (using the LAI-2000) were compared using the dataset from experiment 4. Statistical differences of the regression lines from a 1:1 line were determined in a parallelism test using SPSS-16 (SPSS Inc., Chicago, IL, USA). The same software was used to calculate the linear relationship and 95% con fidence limits between the actual LAI (estimated by LI-3000) and the estimated LAI with the LAI-2000. Calibration was conducted using the independent experimental data from experiment 2; the coef ficient of determination (R2) and the relative root mean square error (RRMSE; eq. (1)) were used to evaluate the performance of the model:

Where, n is the number of samples, Oi is the observed value, Pi is the predicted value derived from the model, andis the mean observed value.
Estimation of N diagnostic modelsPlant NA and NNI were used to establish N diagnostic models with the dataset from experiments 3 and 4, while eqs. (2) and (3) give the NA and NNI. The linear relationship and 95% con fidence limits were used to test the correlation between NA and NNI with LAI at different growth stages during vegetative growth period using SPSS-16 software. Finally, two general N diagnostic models based on LAI were developed,irrespective of cultivars and growth stages:

Where, NA (kg N ha–1) is the actual N accumulation, LDM and SDM (kg ha–1) are the dry matters of leaf and stem,respectively, LNC and SNC (N%) are the N concentrations of leaf and stem, respectively.

Where, NNI is the N nutrition index, Ntis the total N concentration of shoot and Ncis the critical N concentration as determined by Ata-Ul-Karim et al. (2013) in the reaches of the Yangtze River for japonica rice and by Sheehy et al.(1998) for indica rice.
LAI estimation with simple modelsPlant height, tiller number, leaf length, leaf width, and their combinations(plant combination of plant height and tiller number (PCHT,eq. (4)) and plant combination of plant height, tiller number,leaf length and width (PCHTLW, eq. (5)) were used to develop a deterministic model to estimate LAI in the field under the varied N rates and plant densities of experiment 1. Calibration was achieved using the independent experimental data from experiment 4; R2and the RRMSE (eq. (1)) were used to estimate the performance of the model.

Where, H is plant height (m), TN is tiller number (10 000 plants ha–1), L is the length (cm), and W is the width (cm) of the uppermost four fully expanded leaves.
3. Results
3.1. LAI-2000 vs. LI-3000
There was a signi ficantly positive correlation (P<0.01)between the LAI measured by the LI-3000 (0.51–7.79)and LAI-2000 (0.30–4.63) from TI to HD stages in irrigated lowland rice. Linear regression equations were used to describe the relationship between two kinds of LAI with datasets from two cultivars (WYJ-24 and YLY-1). Fig. 1 shows the scatter plots corresponding to the TI, SE, PI, BT,and HD growth stages.
Regressions of the LAI as a function of the LAI-2000 records fitted for all the growth stages were signi ficant (R2,0.501–0.861; P<0.01). However, the correlation was very poor for the TI stage (R2=0.501), indicating that LAI-2000 is not reliable in estimating LAI when the actual LAI is <2 at an early growth stage. Nonetheless, given the complexity of the field ecosystem, this result is suf ficient for practical field conditions.
The parallelism test showed that the regression line and the 1:1 line were not statistically different at TI growth stage(P=0.870), whereas this was not the case for the regression lines of the SE, PI, BT, and HD growth stages (P<0.01 in each case). The slopes of those lines increased steadily,from 1.0207 at the TI stage to 1.7597 at the HD stage. These results showed that the LAI-2000 tends to underestimate the actual LAI of irrigated lowland rice between the TI and HD growth stages, and the difference tends to become larger with crop development progress.
Generally, the values in the LAI-2000 records deviated increasingly from the actual LAI values. However, they could be used to determine the actual LAI by transformation. Fig. 1 shows the scatter plots of the LAI-2000 data and the actual LAI data of irrigated lowland rice during the entire vegetative growth period. The conversion reference allowing the use of LAI-2000 to estimate the LAI of irrigated lowland rice is provided in eq. (6):

Where, LAI2000is the records of LAI-2000.
3.2. Correlation of NA and NNI with the actual LAI
Both NA and NNI were positively related to the LAI. A linear regression model was used to describe the correlation at different growth stages during vegetative growth period based on the cultivar dataset of WYJ-19, YY-8, WYJ-24,and YLY-1. Fig. 2 shows the scatter plots corresponding to the TI, SE, PI, BT, and HD growth stages.
For all of these growth stages, there was a signi ficant linear correlation between LAI and NA, irrespective of the cultivar (R2, 0.646–0.880; P<0.01). However, the determination coef ficient (R2=0.646) at the PI stage is not very stable. Generally, the relative standard relationship between LAI and NA serves as the basis for crop N diagnosis based on LAI. The results for the NNI followed a similar pattern at the SE, PI, BT, and HD growth stages(R2, 0.822–0.925; P<0.01). At the TI stage, the relationship between LAI and NNI varied among different cultivars, which could limit the use of LAI and NNI during the early growth in irrigated lowland rice. Yet, this result demonstrated that NNI is also a potential indicator for LAI-based N diagnosis.
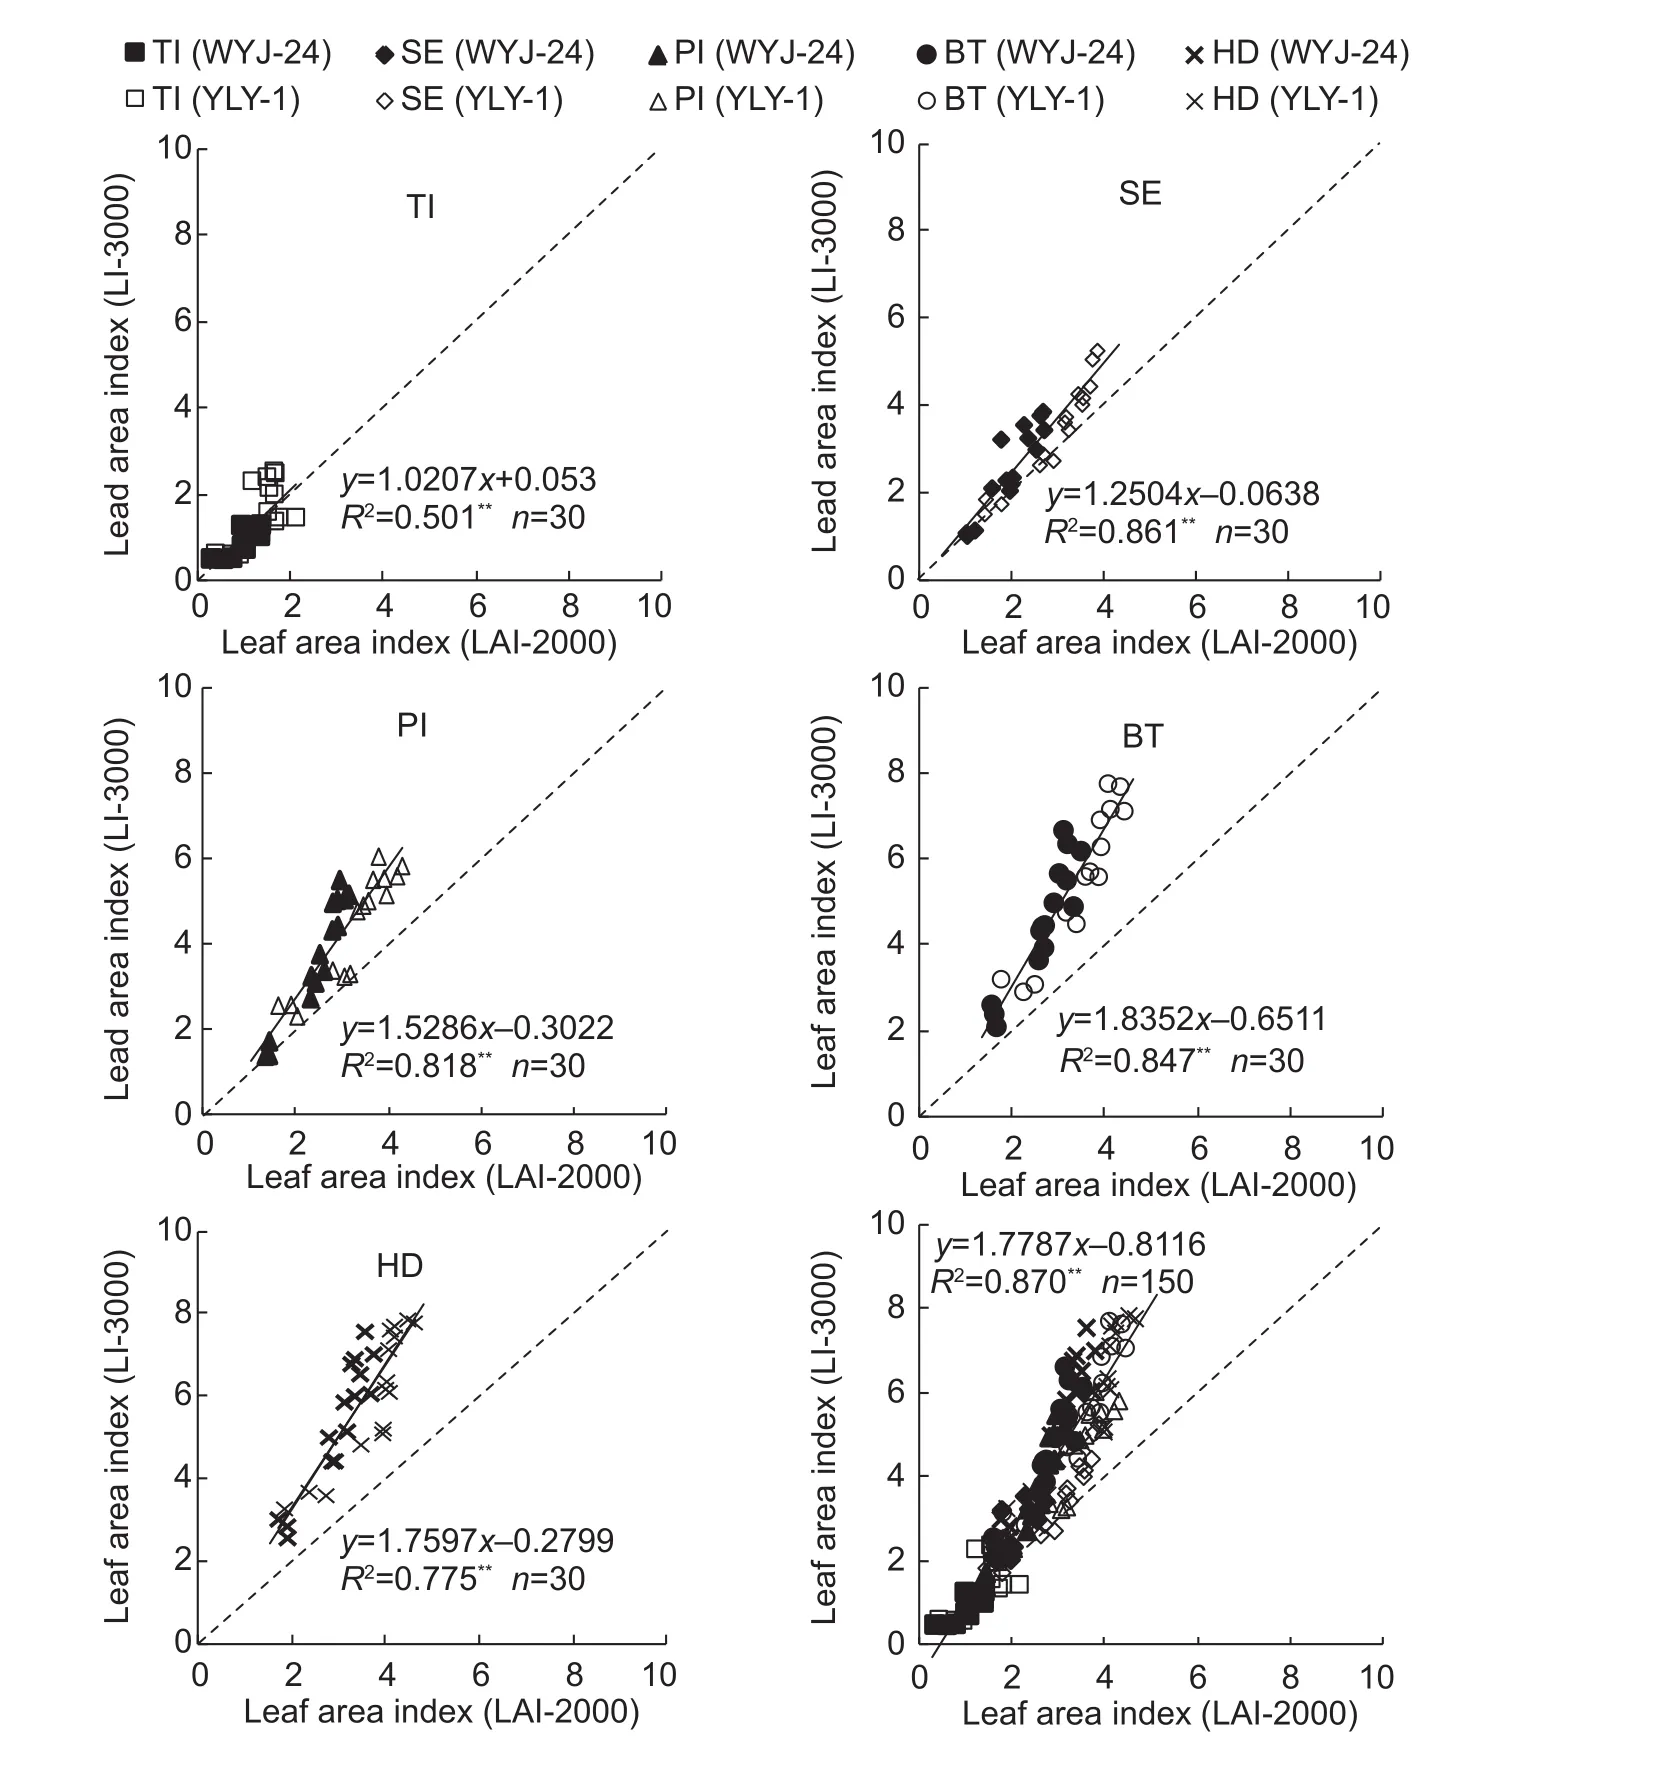
Fig. 1 Comparison of leaf area index (LAI) estimated by LI-3000 and LAI-2000 in two rice cultivars Wuyunjing 24 (WYJ-24) and Y liangyou 1 (YLY-1) at different growth stages during vegetative growth period. The solid line denotes the linear regression and the dotted line indicates a line inclined at 45° to the axes. TI, tillering; SE, stem elongation; PI, panicle initiation; BT, booting; HD, heading.
The relatively standard correlation between LAI and proper N indicators can be readily understood because the stage-speci fic regression contained the dataset from the same sampling date but under different N application rates. In fact, practical N diagnosis in crop production would greatly bene fit from interphase N diagnostic models that are independent of the growth stage. Fig. 2 shows the scatter plots between NA and NNI with LAI for data points during the entire vegetative growth period, the relationship between LAI and NA was very stable (R2=0.863; P<0.01). Thus, NA estimating model in eq. (7) could serve as an N diagnostic tool for in-season rice management:

However, the correlation between LAI and NNI (R2=0.330;P<0.05) was weak. NNI is a relative value, with a narrow range of variation during different growth stages. The relative LAI (RLAI) was calculated by dividing the LAI of the measured plot by the LAI of the fully fertilized plots at the same sampling date. Fig. 3 shows the scatter plots of RLAI and NNI, the determination coef ficient (R2=0.808;P<0.01) was greatly improved compared to the R2of LAI and NNI (R2=0.330; P<0.05), which demonstrates that the relationship between RLAI and NNI during the entire vegetative growth period is robust. Thus, NNI estimating model in eq. (8) could provide another N diagnostic approach for in-season rice production:

Where, RLAI is the relative LAI, calculated by dividing the LAI of the measured plot by the LAI of the fully fertilized plots at the same sampling date.
3.3. Correlation between plant characters and actual LAI

Fig. 2 Correlation between plant nitrogen accumulation (NA) or nitrogen nutrition index (NNI) and leaf area index (LAI) estimated by LI-3000 in four rice cultivars Wuyunjing 19 (WYJ-19), Yongyou 8 (YY-8), Wuyunjing 24 (WYJ-24), and Y liangyou 1 (YLY-1) at different growth stages during vegetative growth period.
A strong linear correlation between H and TN and LAI was demonstrated in an earlier study (Dammer et al. 2008).Fageria (2007) reviewed the conventional LAI estimation,in which eq. (9) is an important step:

Where, K is the adjustment factor, L and W are the leaf length (cm) and width (cm), respectively.

Fig. 3 Linear regression between nitrogen nutrition index (NNI)and relative leaf area index (RLAI) estimated by LI-3000 in four rice cultivars Wuyunjing 19 (WYJ-19), Yongyou 8 (YY-8),Wuyunjing 24 (WYJ-24), and Y liangyou 1 (YLY-1) during vegetative growth period.
In fact, the increase of LAI is caused by increases in the TN, the number of leaves on each tiller, and the size of successive leaves. In most cases, the number of leaves on the main culm is positively related to plant height before the booting (Fageria 2007). We therefore used plant height(H), tiller number (TN), leaf length (L), and leaf width (W)to develop a simple deterministic model to estimate LAI in the field.
The characters of H, TN, L, and W were signi ficantly related to LAI when considered individually, but the stability of the correlation was improved by combining these plant characters. Fig. 4 shows the quadratic regressions between two combinations of plant characters (A, PCHT; B,PCHTLW). The combination used in Fig. 4-A was proposed by Dammer et al. (2008) for the LAI estimation of cereal crops; its R2indicated that the combination of H and TN can explain 87.5% of the variability of LAI. PCHTLW(Fig. 4-B),the combination of L and W with PCHT, did not signi ficantly improve the determination coef ficient (R2=0.906). Thus,for practical applications, the combination of TN and H is suf ficient to develop a simple model in eq. (10) for estimating the LAI in the field.

Where, PCHTis the combination of plant characters,calculated using plant height (H, m) and tiller number (TN,10 000 plants ha–1).
4. Discussion
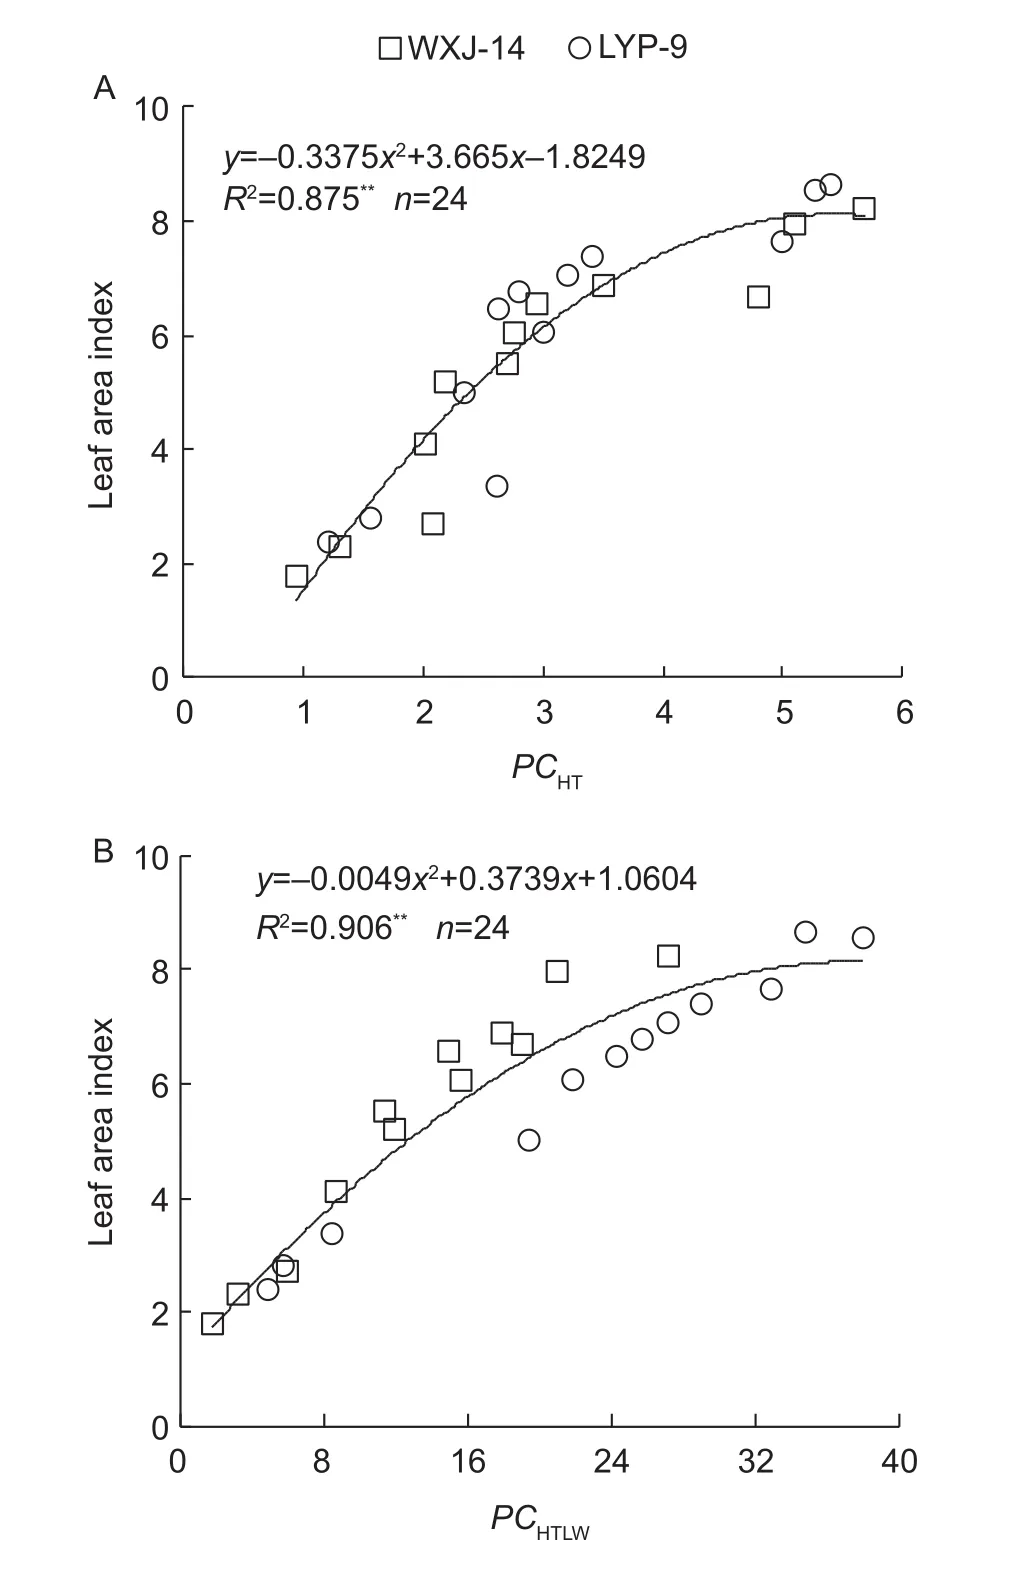
Fig. 4 Quadratic regressions between two combinations of plant characters (plant combination of plant height and tiller number(PCHT) and plant combination of plant height, tiller number,leaf length and width (PCHTLW)) and leaf area index estimated by LI-3000 in two rice cultivars Wuxiangjing 14 (WXJ-14) and Liangyoupei 9 (LYP-9) during vegetative growth period.
The study showed that, compared to the LI-3000, the LAI-2000 is not very sensitive to varied N rates treatments at the TI stage, and the parallelism test simultaneously showed that the regression line of LAI-2000 and the actual LAI is statistically not different from the 1:1 line. However, it is widely believed that in practical use, the LAI-2000 tends to underestimate the actual LAI (Sampson and Allen 1995;Sone et al. 2009). In the previous study, Stroppiana et al.(2006) concluded that the LAI-2000 tends to overestimate the LAI for values<1 and to increasingly underestimate the LAI for values>1. This was con firmed, to some extent, the data points tended to aggregate below the 1:1 line for LAI<1 but not for LAI>1 (Fig. 1). Fig. 5 shows the scatter plots of the predicted LAI based on conversion reference in eq. (6)for a japonica rice cultivar (WXJ-14) during the vegetative growth period. Both determination coef ficient (R2=0.963,P<0.01) and RRMSE (0.11) con firmed that conversion reference in eq. (6) provides a suitable transformation for data obtained with the LAI-2000 and thus an accurate estimate of the actual LAI in the field.
Fig. 5 Relationship between observed and predicted leaf area index (LAI) based on LAI-2000 for Wuxiangjing 14 (WXJ-14)during vegetative growth period. The solid line denotes the linear regression and the dotted line is a line inclined at 45° to the axes. TI, tillering; SE, stem elongation; BT, booting; HD, heading.
Estimating the actual LAI over time using the LAI-2000 allows an LAI-based in season N diagnosis for crops.The stable relationship between NA and LAI during the vegetative growth period can be explained by the fact that the increasing LAI re flects a larger carbon supply to the roots and greater N storage capacities (Lemaire et al. 2008).Plenet and Lemaire (1999) evaluated the correlation between LAI and NA for maize growth in temperate conditions in France: NA=28.9×LAI. Subsequently, Lemaire et al. (2008)examined the same linear regression for maize growth in the subtropical conditions of Australia: NA=30.4×LAI. These studies evidenced the strong linear correlation between NA and LAI for most crop species from seedling emergence to the maximum LAI of the crop. However, the relationships among different species or genotypes may vary. For example, an obvious intercept (–3.5141) was determined in our regression analysis of NA and LAI during the vegetative growth period. This difference between our results and those of previous studies might be due to the fact that, our study is concentrating on the vital N management period of crop production (Yuan et al. 2016a). According to Lemaire et al. (2008), there is a simple linear relationship (only one coef ficient of proportionality) between NA and LAI, with decreases in both NA and LAI per plant dry weight as crop development progresses. Yet these two reduction rates will not be exactly the same, and then another coef ficient(intercept) will appear in the relationship, when the data points representing seedling emergence are excluded. Thus, for the purpose of N diagnosis in crop production, it may be better to conduct the regression during the vital N management period.Eq. (7) developed under these conditions in this research would be reliable for an in-season N diagnosis in irrigated lowland rice, although proper validation is still needed before the relationship can be applied for practical use.
In fact, the correlation between NNI and RLAI may offer an approach to diagnose the N status of crops, irrespective of year, site, and species. Moreover, it could be theoretically more robust and allow crop N demand to be determined for different ecotypes of crops. By contrast, for other N diagnostic approaches, a reference fully fertilized plot is needed. Earlier research on chlorophyll meter showed that relative chlorophyll meter readings can ef ficiently reduce the in fluence of environmental effects, in spite of the requirement for N-rich plots or strips (e.g., year, site, cultivar and sampling date) (Debaeke et al. 2006; Prost and Jeuffroy 2007). A reliable method of N diagnosis is essential for optimizing N fertilizer management, achieving target yield as well as for diminishing N losses and negative impact of N on the environment. For these types of application, a reference plot and the combined use of different diagnostic models are recommended for practical N management in crops.Thus NNI estimation model in eq. (8) would seem to offer a promising tool for rice N diagnosis based on the LAI.
In this study, quadratic regressions were fitted between the yield and the LAI of three japonica (WYJ-19, YY-8, and WYJ-24) and one indica (YLY-1) rice cultivars at PI stage(Fig. 6). The R2ranged from 0.806 to 0.948 (P<0.01), which is in agreement with the results of Ohnishi et al. (1999).Together, these findings support the use of the LAI as a reliable indicator for predicting target grain yield superior to on-farm N diagnosis. When applied to crop production,this information could enable N regulation based on the LAI.
Although the LAI-2000 allows non-destructive estimation of LAI in the field, a drawback is the cost of this device.The simple model based on plant characters enables rice growers and researchers to estimate the in-season LAI conveniently in fields without using expensive commercial instruments, which would enlarge the application range of LAI-based N diagnosis in crop management. Compared to earlier efforts (Scotford and Miller 2005; Dammer et al.2008), our LAI estimating model relies on an increased number of leaf characters. Independent datasets were used to calibrate the former (Fig. 4-A) and newly proposed(Fig. 4-B) models for LAI estimation (Fig. 7). Similar determination coef ficients (R2=0.802, 0.890, P<0.01) and RRMSE (0.2148, 0.2330) were obtained using the two LAI deterministic models based on plant characters. However,the newly proposed model tends to underestimate the actual leaf area along with the rice development processes. To analyze the potential reasons, it may be mainly because leaf length (L) does not increase progressively during the vegetative growth period in cereals. For example, the L of wheat and barley normally increases progressively throughout the development of a stem (apart from the last two or three leaves) and then decreases to the flag leaf (Hay and Porter 2006; Wang et al. 2012). Therefore, considering the practical application, our results support the use of the simple model in eq. (10) to estimate the LAI in irrigated lowland rice field. The models established in this study (eqs.(6) and (10)) were also used to evaluate the LAI in wheat(Appendix A). The results showed that both equations can estimate the LAI in different N rates, but the evaluated data we used here are not systematic. Considering the practical use, the model parameters may need to be recalibrated for other crops.

Fig. 6 Correlation between the grain yield and leaf area index (LAI) based on LI-3000 in four rice cultivars, Wuyunjing 19 (WYJ-19), Yongyou 8 (YY-8), Wuyunjing 24 (WYJ-24), and Y liangyou 1 (YLY-1) at panicle initiation stage.
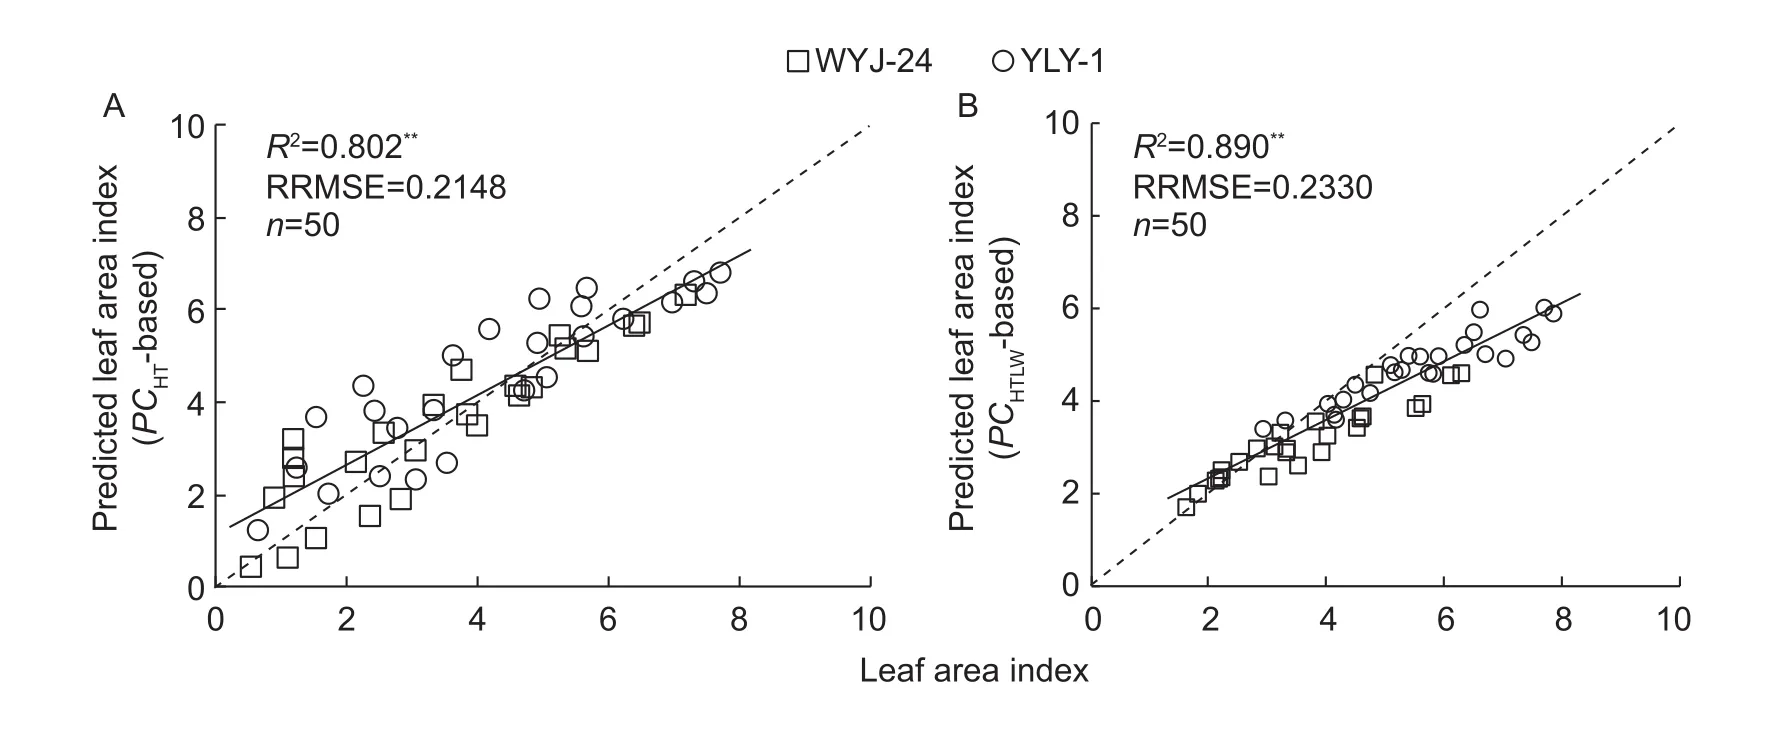
Fig. 7 Relationships between observed and predicted leaf area index (LAI) based on simple leaf area index deterministic models in two rice cultivars Wuyunjing 24 (WYJ-24) and Y liangyou 1 (YLY-1), during vegetative growth period. The solid line denotes the linear regression and the dotted line is a line inclined at 45° to the axes.
5. Conclusion
Leaf area index is an important parameter in crop production and management, but the direct method to gather actual LAI is destructive, which limits its application. Alternatively,measurements obtained with the LAI-2000 enable LAI determination indirectly. In this study, we compared actual LAI values with the LI-3000 and LAI-2000, and adjusted the conversion reference for the application of LAI-2000.Furthermore, we compared the relationships between NA and NNI and LAI during the vegetative growth period, and developed the LAI-based models for estimating NA and NNI in irrigated lowland rice. In addition, LAI is a promising indicator for predicting target yield before N diagnosis. To enlarge the range of in-season LAI-based N diagnosis,a simple LAI estimation model that makes use of plant characters was established and calibrated. These results proved that LAI-based models can contribute to diagnose the N nutrition status of irrigated lowland rice. Further studies under various cultivars and site conditions are desired to corroborate and apply this diagnosis approach widespread.
Acknowledgements
This work was supported by the Special Program for Agriculture Science and Technology from the Ministry of Agriculture of China (201303109), the National Key Research& Development Program of China (2016YFD0300604;2016YFD0200602), the Fundamental Research Funds for the Central Universities, China (262201602), the Priority Academic Program Development of Jiangsu Higher Education Institutions of China (PAPD), and the 111 Project of China (B16026).
Appendixassociated with this paper can be available on http://www.ChinaAgriSci.com/V2/En/appendix.htm
Ata-Ul-Karim S T, Yao X, Liu X J, Cao W X, Zhu Y. 2013.Development of critical nitrogen dilution curve of japonica rice in Yangtze River Reaches. Field Crops Research,149, 149–158.
Ata-Ul-Karim S T, Zhu Y, Yao X, Cao W X. 2014. Determination of critical nitrogen dilution curve based on leaf area index in rice. Field Crops Research,167, 76–85.
Dammer K H, Wollny J, Giebel A. 2008. Estimation of the leaf area index in cereal crops for variable rate fungicide spraying. European Journal of Agronomy,28, 351–360.
Debaeke P, Rouet P, Justes E. 2006. Relationship between the normalized SPAD index and the nitrogen nutrition index:Application to durum wheat. Journal of Plant Nutrition,29,75–92.
Dingkuhn M, Johnson D E, Sow A, Audebert A Y. 1999.Relationships between upland rice canopy characteristics and weed competitiveness. Field Crops Research,61,79–95.
Errecart P M, Agnusdei M G, Lattanzi F A, Marino M A. 2012.Leaf nitrogen concentration and chlorophyll meter readings as predictors of tall fescue nitrogen nutrition status. Field Crops Research,129, 46–58.
Fageria N K. 2003. Plant tissue test for determination of optimum concentration and uptake of nitrogen at different growth stages in lowland rice. Communications in Soil Science and Plant Analysis,34, 259–270.
Fageria N K. 2007. Yield physiology of rice. Journal of Plant Nutrition,30, 843–879.
Fageria N K, Slaton N A, Baligar V C. 2003. Nutrient management for improving lowland rice productivity and sustainability. Advances in Agronomy,3, 63–152.
Fang H, Liang S. 2008. Leaf area index models. In: Fath S E J D, ed., Encyclopedia of Ecology. Academic Press, Oxford,UK. pp. 2139–2148.
Hay R K M, Porter J R. 2006. The Physiology of Crop Yield.Blackwell Publishing, Oxford, UK.
Heuvelink E, Marcelis L F M, Bakke, M J, Ploeg A V D. 2007.Use of crop growth models to evaluate physiological traits in genotypes of horticultural crops. In: Spiertz J H J, Struik P C,VanLaar H H, eds., Scale and Complexity in Plant Systems Research: Gene-Plant-Crop Relations. Wageningen UR Frontis Series, Netherland. pp. 223–233.
Houlès V, Guérif M, Mary B. 2007. Elaboration of a nitrogen nutrition indicator for winter wheat based on leaf area index and chlorophyll content for making nitrogen recommendations. European Journal of Agronomy,27,1–11.
Isfan D, Zizka J, D’Avignon A, Deschênes M. 1995. Relationships between nitrogen rate, plant nitrogen concentration,yield and residual soil nitrate-nitrogen in silage corn.Communications in Soil Science and Plant Analysis,26,2531–2557.
Lemaire G, Jeuffroy M H, Gastal F. 2008. Diagnosis tool for plant and crop N status in vegetative stage: Theory and practices for crop N management. European Journal of Agronomy,28, 614–624.
Liu X, Li Y. 2016. Varietal difference in the correlation between leaf nitrogen content and photosynthesis in rice (Oryza sativa L.) plants is related to speci fic leaf weight. Journal of Integrative Agriculture,15, 2002–2011.
Makino A, Harada M, Sato T, Nakano A, Mae T. 1997. Growth and N allocation in rice plants under CO2enrichment. Plant Physiology,115, 199–203.
Ohnishi M, Horie T, Homma K, Supapoj N, Takano H,Yamamoto S. 1999. Nitrogen management and cultivar effects on rice yield and nitrogen use ef ficiency in Northeast Thailand. Field Crops Research,64, 109–120.
Plenet D, Lemaire G. 1999. Relationships between dynamics of nitrogen uptake and dry matter accumulation in maize crops. Determination of critical N concentration. Plant and Soil,216, 65–82.
Prost L, Jeuffroy M H. 2007. Replacing the nitrogen nutrition index by the chlorophyll meter to assess wheat N status.Agronomy for Sustainable Development,27, 321–330.
Sampson D A, Allen H L. 1995. Direct and indirect estimates of leaf area index (LAI) for lodgepole and loblolly pine stands.Trees,9, 119–122.
Scotford I M, Miller P C H. 2005. Vehicle mounted sensors for estimating tiller density and leaf area index (LAI) of winter wheat. In: Stafford J, ed., 5th European Conference on Precision Agriculture. 9–12 June 2005. Upsala, Sweden,pp. 201–208.
Sheehy J, Dionora M, Mitchell P, Peng S P, Cassman K, Lemaire G, Williams R. 1998. Critical nitrogen concentrations:Implications for high-yielding rice (Oryza sativa L.) cultivars in the tropics. Field Crops Research,59, 31–41.
Soltani A, Galeshi S. 2002. Importance of rapid canopy closure for wheat production in a temperate sub-humid environment:Experimentation and simulation. Field Crops Research,77, 17–30.
Sone C, Saito K, Futakuchi K. 2009. Comparison of three methods for estimating leaf area index of upland rice cultivars. Crop Science,49, 1438–1443.
Stenberg P, Linder S, Smolander H, Flower-Ellis J. 1994.Performance of the LAI-2000 plant canopy analyzer in estimating leaf area index of some Scots pine stands. Tree Physiology,14, 981–995.
Stroppiana D, Boschetti M, Confalonieri R, Bocchi S, Brivio P A.2006. Evaluation of LAI-2000 for leaf area index monitoring in paddy rice. Field Crops Research,99, 167–170.
Wang S S, Grant R F, Verseghy D L, Black T A. 2002.Modelling carbon-coupled energy and water dynamics of a boreal aspen forest in a general circulation model land surface scheme. International Journal of Climatology,22,1249–1265.
Wang W, Yao X, Tian Y C, Liu X J, Ni J, Cao W X, Zhu Y. 2012.Common spectral bands and optimum vegetation indices for monitoring leaf nitrogen accumulation in rice and wheat.Journal of Integrative Agriculture,11, 2001–2012.
Welles J M, Cohen S. 1996. Canopy structure measurement by gap fraction analysis using commercial instrumentation.Journal of Experimental Botany,47, 1335–1342.
White M A, Asner G P, Nemani R R, Privette J L, Running S W.2000. Measuring fractional cover and leaf area index in arid ecosystems: Digital camera, radiation transmittance, and laser altimetry methods. Remote Sensing of Environment,74, 45–57.
Wood G A, Welsh J P, Godwin R J, Taylor J C, Earl R, Knight S M. 2003. Real-time measures of canopy size as a basis for spatially varying nitrogen applications to winter wheat sown at different seed rates. Biosyststems Engineering,84, 513–531.
Xue L H, Yang L Z. 2008. Recommendations for nitrogen fertiliser topdressing rates in rice using canopy re flectance spectra. Biosyststems Engineering,100, 524–534.
Yin X, Lantinga E A, Schapendonk A H C M, Zhong X H. 2003.Some quantitative relationships between leaf area index and canopy nitrogen content and distribution. Annals of Botany,91, 893–903.
Yuan Z F, Ata-Ul-Karim S T, Cao Q, Lu Z Z, Cao W X, Zhu Y,Liu X J. 2016a. Indicators for diagnosing nitrogen status of rice based on chlorophyll meter readings. Field Crops Research,185, 12–20.
Yuan Z F, Cao Q, Zhang K, Ata-Ul-Karim S T, Tian Y C, Zhu Y,Cao W X, Liu X J. 2016b. Optimal leaf positions for SPAD meter measurement in rice. Frontiers in Plant Science,7,719.
Ziadi N, Brassard M, Bélanger G, Claessens A, Tremblay N,Cambouris A N, Nolin M C, Parent L É. 2008. Chlorophyll measurements and nitrogen nutrition index for the evaluation of corn nitrogen status. Agronomy Journal,100,1264–1273.
10 February, 2017 Accepted 5 July, 2017
LIU Xiao-jun, E-mail: liuxj@njau.edu.cn; Correspondence ZHU Yan, Tel: +86-25-84396598, Fax: +86-25-84396672, E-mail:yanzhu@njau.edu.cn
© 2018 CAAS. Publishing services by Elsevier B.V. All rights reserved.
10.1016/S2095-3119(17)61714-3
Section editor LI Shao-kun
Managing editor WANG Ning
 Journal of Integrative Agriculture2018年1期
- Journal of Integrative Agriculture的其它文章
- Climate change and agriculture: Impacts and adaptive responses in Iran
- Development of elite restoring lines by integrating blast resistance and low amylose content using MAS
- Evaluation of stability and yield potential of upland rice genotypes in North and Northeast Thailand
- ldenti fication of the resistance gene to powdery mildew in Chinese wheat landrace Baiyouyantiao
- New clues concerning pigment biosynthesis in green colored fiber provided by proteomics-based analysis
- Constitutive expression of feedback-insensitive cystathionine γ-synthase increases methionine levels in soybean leaves and seeds