
Transcriptome analysis of salt-responsive genes and SSR marker exploration in Carex rigescens using RNA-seq
2018-01-04 02:04LIMingnaLONGRuicaiFENGZirongLIUFengqiSUNYanZHANGKunKANGJunmeiWANGZhenCAOShihao
LI Ming-na, LONG Rui-cai, FENG Zi-rong, LIU Feng-qi, SUN Yan, ZHANG Kun, KANG Jun-mei,WANG Zhen, CAO Shi-hao
1 Grassland Science Department, College of Animal Science and Technology, China Agricultural University, Beijing 100193,P.R.China
2 Institute of Animal Science, Chinese Academy of Agricultural Sciences, Beijing 100193, P.R.China
3 Institute of Pratacultural Science, Heilongjiang Academy of Agricultural Sciences, Heilongjiang 150086, P.R.China
RESEARCH ARTICLE
Transcriptome analysis of salt-responsive genes and SSR marker exploration in Carex rigescens using RNA-seq
LI Ming-na1*, LONG Rui-cai2*, FENG Zi-rong1, LIU Feng-qi3, SUN Yan1, ZHANG Kun1, KANG Jun-mei2,WANG Zhen2, CAO Shi-hao1
1 Grassland Science Department, College of Animal Science and Technology, China Agricultural University, Beijing 100193,P.R.China
2 Institute of Animal Science, Chinese Academy of Agricultural Sciences, Beijing 100193, P.R.China
3 Institute of Pratacultural Science, Heilongjiang Academy of Agricultural Sciences, Heilongjiang 150086, P.R.China
Carex rigescens (Franch.) V. Krecz is a wild turfgrass perennial species in the Carex genus that is widely distributed in salinised areas of northern China. To investigate genome-wide salt-response gene networks in C. rigescens, transcriptome analysis using high-throughput RNA sequencing on C. rigescens exposed to a 0.4% salt treatment (Cr_Salt) was compared to a non-salt control (Cr_Ctrl). In total, 57 742 546 and 47 063 488 clean reads were obtained from the Cr_Ctrl and Cr_Salt treatments, respectively. Additionally, 21 954 unigenes were found and annotated using multiple databases. Among these unigenes, 34 were found to respond to salt stress at a statistically signi ficant level with 6 genes up-regulated and 28 downregulated. Speci fically, genes encoding an EF-hand domain, ZFP and AP2 were responsive to salt stress, highlighting their roles in future research regarding salt tolerance in C. rigescens and other plants. According to our quantitative RT-PCR results, the expression pattern of all detected differentially expressed genes were consistent with the RNA-seq results.Furthermore, we identi fied 11 643 simple sequence repeats (SSRs) from the unigenes. A total of 144 ampli fied successfully in the C. rigescens cultivar Lüping 1, and 69 of them re flected polymorphisms between the two genotypes tested. This is the first genome-wide transcriptome study of C. rigescens in both salt-responsive gene investigation and SSR marker exploration. Our results provide further insights into genome annotation, novel gene discovery, molecular breeding and comparative genomics in C. rigescens and related grass species.
salt stress, Carex rigescens, transcriptome, differentially expressed genes, SSR markers
1. Introduction
Abiotic stresses such as high salinity have been shown to limit growth, distribution and yield in many plant species(Shabala and Cuin 2008). It has been shown that more than eight million square kilometers of land are affected by salt throughout the world (FAO 2008). These impacted soils account for more than 6% of the total land. In China,saline soils cover over 360 thousand square kilometers,amounting to 4.88% of the total available land (NSSO 1998). Soil salinization has severe effects on ecological construction and environmental control especially in arid and semi-arid regions in northern China. High salt concentrations in soils create an ion imbalance leading to plant stresses such as oxidative damage, slowed growth rate, cell dehydration, chlorophyll degradtion or even cell death (Munns and Tester 2008). Understanding plant salt stress response mechanisms and the genetic basis for plant growth and development under salt stress is imperative.Plants defend themselves against salt stress by regulating a series of physiological responses via altering salt stressspeci fic gene expression. During the past decades, studies have focused on exploring plant salt tolerance mechanisms including plant sensory mechanisms, transcription factor(TF) regulation, Na+transport network processes and low Na+maintenance in the cytoplasm based on sodium hydrogen exchange (NHX) and salt overly sensitive (SOS)pathways (Deinlein et al. 2014). Nevertheless, salt stress response mechanisms in plants remain poorly understood due to the complexity of the response process and the genetic variability among plant species.
Next-generation high-throughput sequencing techniques have became an increasingly useful tool for exploring whole plant genomes (Deshmukh et al. 2014), providing a means for analyzing plant molecular regulatory mechanisms in speci fic environments such as various abiotic stress conditions. Many independent studies have been conducted exploring salt stress response mechanisms in a variety of plant species,such as Medicago sativa (Postnikova et al. 2013; Long et al.2015), Medicago truncatula (Long et al. 2015), Halogeton glomeratus (Wang et al. 2015), and Caragana korshinskii (Li S et al. 2016). These studies have advanced our knowledge on how the genome, transcriptome and genes function and interact in plants under salt stress. However, few turfgrass species have been studied in regards to salt stress response mechanisms on the molecular level using RNA sequencing techniques. A database was created to confer the global transcript resource of Japanese lawngrass (Zoysia japonica Steud.) (Xie et al. 2015) and the highly polyploidy, facultative apomictic Kentucky bluegrass (Poa pratensis L.) (Bushman et al. 2016) using transcriptome technology. Furthermore,using these RNA-seq databases, candidate genes involved in salt tolerance have been identi fied in the halophytic turfgrass Sporobolus virginicus (Yamamoto et al. 2015) and in both shoot and root tissues of Kentucky bluegrass (Bushman et al. 2016). The protective roles of exogenous melatonin in response to salt stress have been illustrated in the widely planted turfgrass bermudagrass (Cynodon dactylon) (Shi et al. 2015). These results have strengthened the knowledge on salt stress response and tolerance mechanisms as well as the genetic basis of these mechanisms in turfgrass species but the molecular mechanisms regarding the other important turfgrass species respond to salt stress still remain largely unexplored.
Carex rigescens (Franch.) V. Krecz. is a perennial plant that belongs to the Carex genus and is widely distributed in China’s northern regions such as Liaoning, Hebei,Henan, Shandong and Inner Mongolia. This grassy plant possesses many adaptions for survival in various soil types such as tolerances to cold, drought, and heat stresses (He et al.1993). As a wild grass, C. rigescens has the potential to be utilized as a genetic resource and has been genetically utilized for integration into important turfgrass species in Beijing, China (Wang 1997). Presently,research endeavors on C. rigescens focus on breaking seed dormancy (Liang et al. 2011), improving seed germination rates (Sun et al. 2011), salinity threshold calculations and pharmaceutical usage (Gao et al. 2009; Zhang et al.2017). Few studies have been devoted to C. rigescens genomics and gene expression pro files in response to salt stress. In this study, two RNA sequence libraries,one control and one salt-treated, were constructed using de novo Illumina sequencing. The transcriptome analyses were used to characterize C. rigescens and discriminate its gene expression pro files in response to salt stress.To our knowledge, this is the first study on C. rigescens response to salt stress using transcriptome technology. Our findings provide insight into novel gene discovery, molecular breeding and comparative genomics of C. rigescens.
2. Materials and methods
2.1. Plant materials and sample preparation
C. rigescens Lüping 1 was used in this study. The seeds of Lüping 1 were sown into pots and incubated in a regime of 16 h light/8 h dark in 25°C light/20°C dark for 30 days.For the salt treatment, seedlings were irrigated with 50 mL of 0.4% NaCl dissolved in sterilized water (Cr_Salt).Seedlings irrigated with an equal volume of sterilized water were used as a control (Cr_Ctrl). This salt concentration was chosen as it has been shown to be crucial to plant growth(Mohammadi-Nejad et al. 2010; Yang et al. 2014). Whole fresh seedlings from the control and treatment groups (four seedlings each) were pooled for sample collection at 24 h after irrigation. Samples were stored at –80°C after flashfreezing with liquid nitrogen.
2.2. RNA extraction and sequencing
Total RNA was isolated from C. rigescens seedlings using Trizol Reagent (Biomed Biotech, Beijing, China) according to the manufacturer’s instruction. The RNA purity and integrity were assessed using a NanoPhotometer®spectrophotometer (IMPLEN, CA, USA) and RNA Nano 6000 Assay Kit in an Agilent Bioanalyzer 2100 System(Agilent Technologies, CA, USA), respectively. A Qubit®RNA Assay Kit and a Qubit®2.0 Fluorimeter (Life Technologies,CA, USA) were used to determine RNA concentration.Sequencing libraries were generated using NEBNext®Ultra™ RNA Library Prep Kit from Illumina®(NEB, USA)following manufacturer’s recommendations and index codes were added to attribute sequences to each sample. The clustering of the index-coded samples was performed on a cBot Cluster Generation System using TruSeq PE Cluster Kit v3-cBot-HS (Illumina) according to the manufacturer’s instructions. After cluster generation, the libraries were sequenced on an IlluminaHiseq 2000 platform and pairedend reads were generated.
2.3. Unigene assembly, functional annotation and differential unigene expression analysis
Raw data (raw reads) in fastq format were first processed through in-house perl scripts (Hu et al. 2015). To obtain clean data (clean reads), the adapter sequences, poly-N nucleotides and low quality reads were removed from the raw data. The Q20, GC-content and two sequence duplication level of the clean data were calculated. All downstream analyses used were based on the clean data.Transcriptome assembly was accomplished based on the pooled files for each treatment using Trinity (Grabherr et al.2011) with min_kmer_cov set to 2 with all other parameters being set to default. For data analysis, FPKM (fragments per kilobase million) was used as it considers both the in fluence of sequencing depth and the gene length of reads. Gene function was annotated based on the following databases:Nr (NCBI non-redundant protein sequences); Nt (NCBI nonredundant nucleotide sequences); Pfam (protein family);KOG/COG (clusters of orthologous groups of proteins);Swiss-Prot (a manually annotated and reviewed protein sequence database); KO (KEGG orthology database) and GO (gene ontology). For differential gene expression analysis, the read counts of each library were adjusted using the edgeR Program (Robinson et al. 2010) package through one scaling normalized factor. Differential expression analysis of the two samples was performed using the DEGseq R package (Wang et al. 2010). The P-value was adjusted using the q-value (Storey and Tibshirani 2003). A q-value<0.005 and |log2(fold change)|>1 were set as the threshold for signi ficant differential expression.
2.4. Quantitative real-time PCR (qRT-PCR) validation
RNA samples of C. rigescens Lüping 1 seedlings were reverse-transcribed into cDNA using the PrimeScriptTMRT Reagent Kit (TaKaRa Biomedicals, Japan) after being treated with RNase-free DNase I (TaKaRa). Quantitative RT-PCR reactions were performed using the Applied Biosystems 7300 Sequence Detection System (Carlsbad,CA, USA) with SYBR®Premix Ex TaqTMII (TaKaRa). The CrActin gene (GenBank no. KX343900) was used as an internal control and triplicate quantitative assays were performed. Primer sequences for the selected genes are listed in Table 1. Primers were designed using NCBI’s primer designing tool (http://www.ncbi.nlm.nih.gov/tools/primer-blast/). The PCR cycling conditions comprised an initial polymerase activation step of 95°C for 30 s,followed by 40 cycles of 95°C for 5 s and 60°C for 31 s.To con firm the speci ficity of the product a dissociation curve was designed after each PCR run. The formula 2–ΔΔCtwas used to calculate the relative transcript levels(Livak and Schmittgen 2001). All data are shown as the means±SD (n=3).
2.5. DNA extraction and SSR marker exploration
DNA was extracted from two different genotypes of C. rigescens Lüping 1 (samples 1 and 2) using a Plant Genomic DNA Extraction Kit (TaKaRa). Simple sequence repeats (SSRs) were predicted by MISA (1.0) (http://pgrc.ipkgatersleben.de/misa/misa.html) according to the unigenes obtained from the transcriptome data. The primers for the SSRs were designed using Primer3 (version 2.3.5).The PCR ampli fication reactions contained 1 μL Taq DNA polymerase, 0.1 mmol L–1dNTP, 2 mmol L–1Mg2+, 1 μL 10×buffer (without Mg2+), 1 μmmol L–1primers, 100 ng DNA, and ddH2O was added to the 10 μL reaction. Thermocycling was performed at 94°C for 3 min; 10 cycles with 94°C for 30 s,60.5°C for 30 s (each loop reduced 0.5°C), 72°C for 3 min;23 cycles with 94°C for 30 s, 55°C for 30 s, 72°C for 1 min and an additional polymerization step at 72°C for 5 min. After separated in 10% PAGE electrophoresis, the PCR products were visualized by silver staining and imaged using a UMAX 2100XL Scanner (UMAX Technologies, USA).
3. Results
3.1. Transcriptome sequencing and assembly
The RNA extracted from whole plants of C. rigescens with or without salt treatment was sequenced using the pairedend technique to compare gene expression patterns. In total, 108 307 484 raw reads were obtained (Table 2),including 59 544 878 and 48 762 606 from the Cr_Ctrl and Cr_Salt samples, respectively. After removing the adapter sequences, ambiguous nucleotides and low-quality sequences, a new total of 104 806 034 clean reads were indenti fied, consisting of 57 742 546 in the Cr_Ctrl samples and 47 063 488 in the Cr_Salt samples. When combining the reads from the two sample groups, 81 860 transcripts with a mean length of 1 046 bp and an N50 of 1 679 bp were generated using the Trinity software. A total of 43 847 unigenes were annotated with a mean length of 858 bp and an N50 of 1 561 bp. The length distribution of unigenes and transcripts were analyzed and were presented as a function of the different interval lengths (Fig. 1).
3.2. Blast analysis
All assembled unigenes were blasted against public databases, including NCBI, KO, Swiss-Prot, Pfam, GO and KOG for similarity searches using the Blast algorithm(E-value<1E-5). A total of 21 954 unigenes were annotated in at least one searched database, accounting for 50.06% of the total unigenes obtained. Among them, 20 330 (46.36%)and 5 497 (12.53%) assembled unigenes showed identity with sequences in the Nr and Nt databases, respectively.The percentage of assembled unigenes homologous to sequences in KO, Swiss-Prot, Pfam, GO and KOG databases were 14.84, 35.46, 35.88, 39.38 and 19.68%,respectively (Table 3).
3.3. Functional annotation and pathway assignment
When the GO database was used to classify unigene functions, all 17 268 GO database results matched the Cr_Ctrl or Cr_Salt group unigenes. These were then classi fied into three functional categories: biological processes,cellular components and molecular functions (Fig. 2).Within the biological processes category, 22 subcategories were created to further classify the matched unigenes. The two dominant subcategories were cellular processes and metabolic processes. In the cellular components category,these sequences were further divided into 14 classi fications.The most represented subcategories were cell and cell part.Among the molecular functions terms, these unigenes were classed into 11 classi fications. The largest subcategory was binding and the second largest was catalytic activity (Fig. 2).
To get a better understanding of the biological relevance of the systemic function categories from the annotated C. rigescens genes, the KEGG pathway mapping database was searched. According to the KEGG pathway analysis,6 075 unigenes were assigned to five pathways: cellular processes (688, 11.3% of unigenes), environmental information processing (517, 8.5% of unigenes), genetic information processing (1 558, 25.6% of unigenes),metabolism (2 925, 48.1% of unigenes) and organismsystem (967, 15.9% of unigenes) (Fig. 3). The largest group accounting for 48.1% of analyzed unigenes belonged to the metabolism category and included genes involved in carbohydrate metabolism (559), amino acid metabolism(459), energy metabolism (472), lipid metabolism (317),biosynthesis of other secondary metabolites (233) and metabolism of cofactors and vitamins (192). The genetic information processing category representing 25.6% of the unigenes was the second largest group containing genes involved in translation (670), folding, sorting and degradation(495), transcription (254) and replication and repair (175).The third largest group was the organism system comprising 15.9% of the unigenes and included genes involved in environmental adaptation (234) and immune system (188).The cellular processes and environmental information processing pathways were also represented in the unigenes from C. rigescens but with low percentages of 11.3 and 8.5%, respectively.

Table 1 Primers used in quantitative RT-PCR for validation of differentially expression genes

Table 2 Summary of assembled transcripts and unigenes for all Carex rigescens samples

Fig. 1 Carex rigescens unigene and transcript lengths identi fied using transcriptome databases.

Table 3 Blast analysis of assembled unigenes using various databases
3.4. Gene expression analysis
Using the RNA-seq results, total unigenes were obtained from the Cr_Ctrl or Cr_Salt samples (Table 2). After standardizing the read counts, DEGseq was used for the data analysis within the threshold value of [q-value<0.005 and |log2(fold change)|>1]. Thirty-four unigenes were identi fied that were differentially expressed after salt stress (Table 4), of which 6 were up-regulated and 28 were down-regulated. The log2(fold changes) of the differentially expressed genes (DEGs) ranged from –4.15 to 1.74 (Table 4).
3.5. Cluster analysis of differentially expressed genes

Fig. 2 Gene ontology (GO) categorization of assembled unigenes in Carex rigescens. These unigenes were separated into metabolic categories based on biological processes, cellular components and molecular functions.

Fig. 3 Kyoto encyclopedia of genes and genomes (KEGG) classi fication of assembled unigenes in Carex rigescens. The unigenes identi fied using the KEGG database were further parsed into metabolic categories and presented as the percent of each subcategory of the total genes identi fied. The total amount of genes can be seen to the right of each subcategory. A, cellular processes pathway. B, environmental information processing pathway. C, genetic information processing pathway. D, metabolism pathway. E, organism system pathway.
To determine the clustering model of the DEG expression pro files under salt stress, a hierarchical cluster analysis was performed based on sample’s log10(FPKM+1). The average reads of the two replicates were used for each experiment. Our results suggested that 34 DEGs were differentially expressed after salt stress as clear expression variations were observed between the Cr_Ctrl and Cr_Salt samples (Fig. 4).
The red bands represent the high gene expression quantity and the blue represent low gene expression quantityas deduced from expression fold changes.

Table 4 Differentially expressed genes under salt stress1)
3.6. Differential expression validation using quantitative RT-PCR
To validate the transcriptome data, the expression pro files of eight candidate DEGs from C. rigescens were analyzed using qRT-PCR. The results showed that all eight DEGs had signi ficant changes in transcript expression after exposure to salt stress. These transcripts were quanti fied using qRT-PCR and were consistent with the RNA-seq data (Table 5 and Fig. 5). The qRT-PCR validation analysis provided additional support that our transcriptome results were reliable.
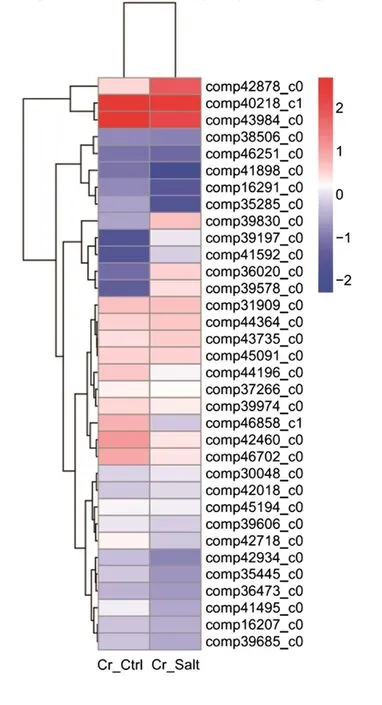
Fig. 4 Hierarchical cluster analysis of the differentially expressed genes under salt stress.
3.7. Potential SSR marker exploration
A total number of 43 847 sequences were examined for putative SSR markers using MISA (1.0) (Nagaraja Reddy et al. 2011). From these sequences, 11 643 SSR motifs were predicted. The SSR motifs that were identi fied possessed repeated structures ranging from a mono-motif unit to a hexa-motif unit. The motif units were parsed into repeat types based on the amount of nucleotides in each repeat.These repeats were placed into categories comprised of 5–8, 9–12, 13–16, 17–20, and 21–26 nucleotides and separated further by motif units (Fig. 6). The SSR-speci fic primers ampli fied clear target bands in 144 of the 193 pairs of primers tested (Appendix A). The primers that yielded clear amplicons made up 74.61% of the total primers tested and of this percentage, 69 primer pairs (47.92%) re flected polymorphisms between the two different genotypes of C. rigescens Lüping 1 (Fig. 7, Table 6, and Appendix A).These results provided potential SSR markers related to salt stress and our working primers offer a foundation for further exploration of these polymorphisms.
4. Discussion
The natural habitat of C. rigescens con fines this species to drought stressed regions in northern China, resulting in its high tolerance to water de ficit. Water availability, the most important abiotic factor affecting plants, is highly related to salt stress, particularly in irrigated land. To determine the gene expression pro files of C. rigescens under salt stress on a genome-wide scale, full plant tissues from salt-treated or untreated samples were used to test transcript abundance via high-throughput RNA-seq.
Results showed that several genes changed in their expression pro files after the salt treatment. These genes likely have an important function in salt stress response in C. rigescens. For example, the EF-hand domain genes(comp16207_c0, comp41495_c0 and comp42934_c0)have been shown to be involved in high-af finity Ca2+-binding helix-loophelix structures and are conserved Ca2+sensors (Jing et al. 2016; Zhang et al. 2016). These genes were also found to respond to salt stress in our system.These Ca2+sensors play crucial roles in response to environmental and developmental stimulations, including calcineurin B-like proteins (CBLs), calmodulin-like proteins(CMLs), calmodulins (CaM), and calcium dependent protein kinases (CDPKs) (Kudla et al. 2010). Previous studies have illustrated that these EF-hand domains contain Ca2+sensors that have regulatory roles in response to salt stress in many plant species such as Arabidopsis (Li P et al. 2016),maize (Wang and Shao 2012; Zhang et al. 2016), rice(Jing et al. 2016) and Glycine soja (Chen et al. 2015). In our study, the EF-hand domain gene expression changed after exposure to salt stress. This altered expression could re flect the EF-hand domain’s involvement in signal sensing and transduction to an important second Ca2+messenger in C. rigescens. However, the putative EF-hand domain regulatory function in response to salt stress calls for further study in C. rigescens.
Another group of genes whose change in expression in C. rigescens were found after salt stress was the zinc finger protein (ZFP) related genes (comp44364_c0, comp30048_c0,comp42718_c0, and comp39606_c0). The zinc finger proteins are one of the most common TFs and play critical roles in response to abiotic stress via transcriptionalregulation of the downstream genes responsible for plant stress tolerance (Kielbowicz-Matuk 2012). The C2H2-type ZFPs are some of the best characterized TFs and their involvement in plant development and stress resistance processes have been largely con firmed (Tang et al. 2013;Ma et al. 2016). The C2H2-type ZFP gene (comp42718_c0)in our study was down-regulated, indicating its role in salt stress response in C. rigescens. Identi fication and expression of the C2H2-type ZFP gene has been conducted in many plant species, such as alfalfa (Tang et al. 2013),Carica papaya (Jiang and Pan 2012), and chrysanthemum(Gao et al. 2012), highlighting its role in regulating abiotic stress. Additionally, the BTB/POZ domain ZFP gene(comp30048_c0) was up-regulated in our study. This is consistent with previous studies regarding salt responses where this ZFP acts as a regulatory mechanism for transcriptional control of hormone processes such as ABA and ethylene (Weber and Hellmann 2009; Kim et al. 2016).Another gene in C. rigescens that responded to salt exposure was the C3HC4-type RING ZFP gene (comp39606_c0). This gene has been shown to have an essential role in regulating actin as a general stress modulator and its expression was able to be altered to elevate salt stress tolerance(Jung et al. 2013). In addition, the C-x8-C-x5-C-x3-H type ZFP gene (comp44364_c0) was also down-regulated in C. rigescens. Overexpression of the CCCH type gene AtZFP1 in Arabidopsis has been shown to enhance salt tolerance by maintaining ionic balance and limiting oxidative and osmotic stresses (Han et al. 2014). We posit that the change in expression of the C-x8-C-x5-C-x3-H type ZFP could have a similar ionic balance mechanism to relieve salt stress in C. rigescens.

Table 5 Veri fication of differentially expressed genes by qRT-PCR1)

Fig. 5 Relative transcript expression level of the eight saltresponsive candidate genes. Cr_Salt, transcript expression level in salt treated Carex rigescens; Cr_Ctrl, transcript expression level in control C. rigescens. Data are shown as means±SD (n=3). Asterisks indicate statistically signi ficant difference at * P<0.05 and ** P<0.01 respectively using ANOVA test.

Fig. 6 Distribution of simple sequence repeats (SSRs) identi fied from Carex rigescens.
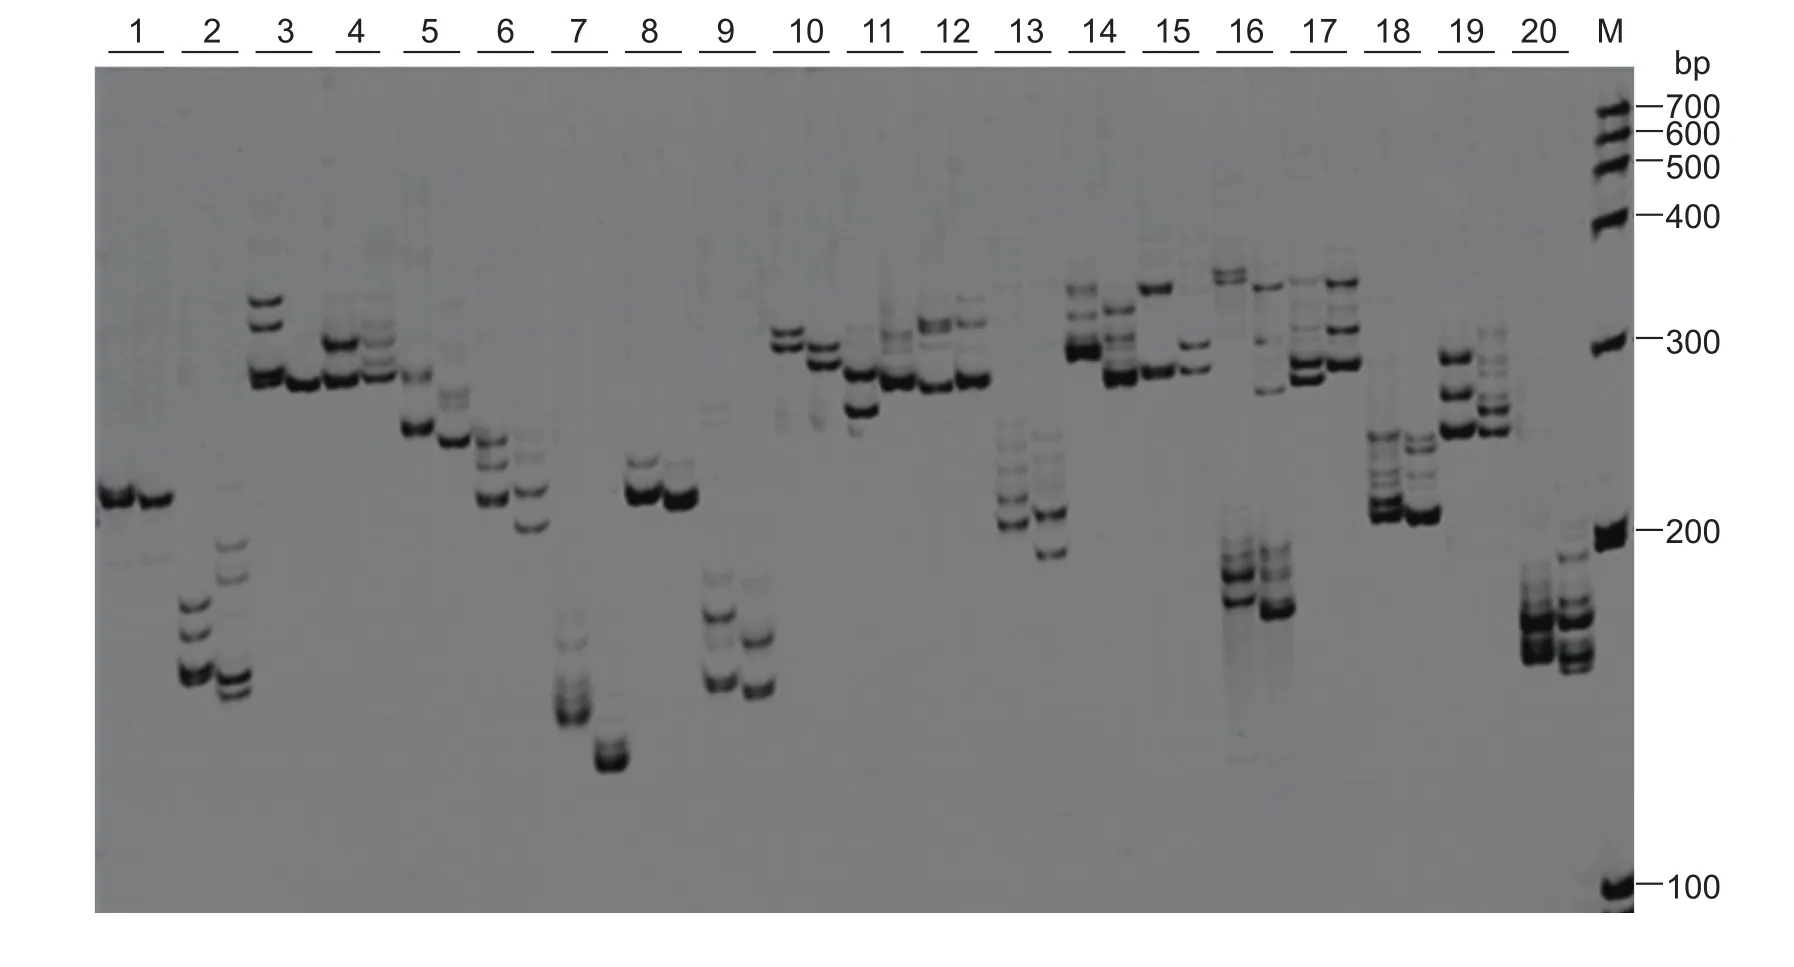
Fig. 7 Polymorphism analysis of 20 simple sequence repeat (SSR) loci using PCR. A representative polyacrylamide gel electrophoresis presented the PCR results of 20 putative SSR loci. For each SSR locus, two individual DNA samples were tested from genotypes of Carex rigescens Lüping 1 samples 1 and 2, in the left and right lane, respectively. The 20 loci (1–20) from left to right were: Cr2, Cr21, Cr31, Cr33, Cr43, Cr44, Cr105, Cr118, Cr119, Cr124, Cr150, Cr157, Cr169, Cr185, Cr189, Cr20, Cr151,Cr156, Cr184 and Cr187; M was DNA maker I. Cr1 was used as the negative control showing no polymorphism between the two samples.

Table 6 Diversity analysis of simple sequence repeat (SSR) in 20 loci
We also found that genes with the AP2 domain(comp43735_c0, comp44196_c0, and comp35445_c0)showed a change in expression after salt stress in C. rigescens. It has been demonstrated that the TFs of the AP2/ERF family are able to regulate diverse processes in plant development and stress responses (Xu et al. 2011).In rice, the AP2/ERF domain-containing genes such as OsAP21 (Jin et al. 2013) and OsRAVs (Duan et al. 2016)have been shown to have a crucial role in salt stress response as veri fied in over-expression experiments using Arabidopsis and the CRISPR/Cas9 system, respectively. In addition, the JcERF2 gene, a novel AP2/ERF TF in Jatropha curcas, has been shown to confer salt tolerance (Wang et al.2015). Accordingly, homologous genes were identi fied in C. rigescens and also had a change in expression after salt treatment. These homologs could be important AP2/ERF TFs that respond to salt stress or have involvement in salt stress adaptation.
An additional TF that showed down-regulated expression in C. rigescens was the auxin response factors (ARF)(comp39685_c0) that has been known to bind auxin response elements to speci fically regulate the expression of auxin response genes. Changes in ARF after salt stress have been studied in Vigna unguiculata, Arabidopsis and maize, and using a miR160 target transcript, ARF was shown to better aid in root development and auxin signaling under salt stress (Liu et al. 2008; Paul et al. 2011).
Many other genes had also shown a change in expression post-salt stress in C. rigescens. One of these genes was the MFS (comp39578_c0), which encodes a Na+/H+antiporter that is considered a molecule transporter sensor in higher plants and acts as a distinct mechanism for salt-stress adaptation (Reddy et al. 2012; Sekhwal et al.2013). Another pertinent example was the gene encoding saccharopine dehydrogenase (comp41592_c0) that was up-regulated after salt treatment in C. rigescens. Though saccharopine dehydrogenase has long been known to be up-regulated under osmotic stress in Brassica napus (Moulin et al. 2000), its behavior under salt stress has only been reported in the seed developmental stage of maize where signi ficant changes in the saccharopine pathway occurred(Kiyota et al. 2015).
5. Conclusion
In this study, we have annotated 21 954 unigenes of the total generated 43 847, and identi fied 34 differentially expressed genes in response to salt stress in the C. rigescens variety Lüping 1 using RNA-seq. We also veri fied 144 SSR markers and 69 of them re flected a polymorphism between the two different genotypes of C. rigescens variety Lüping 1. This is the first study examining gene expression pro files and SSR markers in C. rigescens in response to salt stress. Our results may provide further insight into genome annotation,novel gene discovery, molecular breeding and comparative genomics in C. rigescens and related species.
Acknowledgements
This work was supported by the National Natural Science Foundation of China (31472139).
Appendixassociated with this paper can be available on http://www.ChinaAgriSci.com/V2/En/appendix.htm
Bushman B S, Amundsen K L, Warnke S E, Robins J G,Johnson P G. 2016. ranscriptome pro filing of Kentucky bluegrass (Poa pratensis L.) accessions in response to salt stress. BMC Genomics,17, 48.
Chen C, Sun X, Duanmu H, Zhu D, Yu Y, Cao L, Liu A, Jia B,Xiao J, Zhu Y. 2015. GsCML27, a gene encoding a calciumbinding Ef-Hand protein from Glycine soja, plays differential roles in plant responses to bicarbonate, salt and osmotic stresses. PLOS ONE,10, e0141888.
Deinlein U, Stephan A B, Horie T, Luo W, Xu G, Schroeder J I. 2014. Plant salt-tolerance mechanisms. Trends Plant Science,19, 371–379.
Deshmukh R, Sonah H, Patil G, Chen W, Prince S, Mutava R, Vuong T, Valliyodan B, Nguyen H T. 2014. Integrating omic approaches for abiotic stress tolerance in soybean.Frontiers in Plant Science,5, 244.
Duan Y B, Li J, Qin R Y, Xu R F, Li H, Yang Y C, Ma H, Li L, Wei P C, Yang J B. 2016. Identi fication of a regulatory element responsible for salt induction of rice OsRAV2 through ex situ and in situ promoter analysis. Plant Molecular Biology,90, 49–62.
FAO. 2008. FAO land and plant nutrition management service.[2016-03-24]. http://www.fao.org/ag/agl/agll/spush
Gao C, Rong R, Zhang Z Q, Guo P J, Meng H. 2009.Experimental research of extracting extracorporeal antiherpes virus. China Pharmaceuticals,18, 5–6. (in Chinese)
Gao H, Song A, Zhu X, Chen F, Jiang J, Chen Y, Sun Y, Shan H, Gu C, Li P, Chen S. 2012. The heterologous expression in Arabidopsis of a chrysanthemum Cys2/His2 zinc finger protein gene confers salinity and drought tolerance. Planta,235, 979–993.
Grabherr M G, Haas B J, Yassour M, Levin J Z, Thompson D A, Amit I, Adiconis X, Fan L, Raychowdhury R, Zeng Q D, Chen Z H, Mauceli E, Hacohen N, Gnirke A, Rhind N, di Palma F, Birren B W, Nusbaum C, Lindblad-Toh K,Friedman N, et al. 2011. Full-length transcriptome assembly from RNA-Seq data without a reference genome. Nature Biotechnology,29, 644–652.
Han G L, Wang M J, Yuan F, Sui N, Song J, Wang B S. 2014.The CCCH zinc finger protein gene AtZFP1 improves salt resistance in Arabidopsis thaliana. Plant Molecular Biology,86, 237–253.
He S, Xing Q, Yin Z. 1993. Flora of Beijing. Beijing Publishing House, China. pp. 1293–1314. (in Chinese)
Hu L, Li H, Chen L, Lou Y, Amombo E, Fu J. 2015. RNA-seq for gene identi fication and transcript pro filing in relation to root growth of bermudagrass (Cynodon dactylon) under salinity stress. BMC Genomics,16, 575.
Jiang L, Pan L J. 2012. Identi fication and expression of C2H2 transcription factor genes in Carica papaya under abiotic and biotic stresses. Molecular Biology Reports,39,7105–7115.
Jin X, Xue Y, Wang R, Xu R, Bian L, Zhu B, Han H, Peng R,Yao Q. 2013. Transcription factor OsAP21 gene increases salt/drought tolerance in transgenic Arabidopsis thaliana.Molecular Biology Reports,40, 1743–1752.
Jing P, Zou J, Kong L, Hu S, Wang B, Yang J, Xie G. 2016.OsCCD1, a novel small calcium-binding protein with one EF-hand motif, positively regulates osmotic and salt tolerance in rice. Plant Science,247, 104–114.
Jung Y J, Lee I H, Nou I S, Lee K D, Rashotte A M, Kang K K.2013. BrRZFP1 a Brassica rapa C3HC4-type RING zinc finger protein involved in cold, salt and dehydration stress.Plant Biology,15, 274–283.
Kielbowicz-Matuk A. 2012. Involvement of plant C2H2-type zinc finger transcription factors in stress responses. Plant Science,185–186, 78–85.
Kim H, Kim S H, Seo D H, Chung S, Kim S W, Lee J S, Kim W T, Lee J H. 2016. ABA-HYPERSENSITIVE BTB/POZ PROTEIN 1 functions as a negative regulator in ABA-mediated inhibition of germination in Arabidopsis. Plant Molecular Biology,90, 303–315.
Kiyota E, Pena I A, Arruda P. 2015. The saccharopine pathway in seed development and stress response of maize. Plant Cell and Environment,38, 2450–2461.
Kudla J, Batistic O, Hashimoto K. 2010. Calcium signals: The lead currency of plant information processing. The Plant Cell,22, 541–563.
Li P, Zhang G, Gonzales N, Guo Y, Hu H, Park S, Zhao J.2016. Ca2+-regulated and diurnal rhythm-regulated Na+/Ca2+exchanger AtNCL affects flowering time and auxin signalling in Arabidopsis. Plant, Cell & Environment,39, 377–392.
Li S, Fan C, Li Y, Zhang J, Sun J, Chen Y, Tian C, Su X, Lu M,Liang C, Hu Z. 2016. Effects of drought and salt-stresses on gene expression in Caragana korshinskii seedlings revealed by RNA-seq. BMC Genomics,17, 200.
Liang F, Bai S Y, Dong A X, Wu N. 2011. Biological character comparison with the seeds of 18 plant species in Carex genus. Pratacultural science,28, 1825–1830. (in Chinese)
Liu H H, Tian X, Li Y J, Wu C A, Zheng C C. 2008.Microarray-based analysis of stress-regulated microRNAs in Arabidopsis thaliana. RNA - A Publication of the RNA Society,14, 836–843.
Livak K J, Schmittgen T D. 2001. Analysis of relative gene expression data using real-time quantitative PCR and the 2-ΔΔCTmethod. Methods,25, 402–408.
Long R C, Li M N, Kang J M, Zhang T J, Sun Y, Yang Q C.2015. Small RNA deep sequencing identi fies novel and salt-stress-regulated microRNAs from roots of Medicago sativa and Medicago truncatula. Physiologia Plantarum,154, 13–27.
Ma X, Liang W, Gu P, Huang Z. 2016. Salt tolerance function of the novel C2H2-type zinc finger protein TaZNF in wheat.Plant Physiology and Biochemistry,106, 129–140.
Mohammadi-Nejad G, Singh R K, Arzani A, Rezaie A M, Sabouri H, Gregorio G B. 2010. Evaluation of salinity tolerance in rice genotypes. International Journal of Plant Production,4, 199–207.
Moulin M, Deleu C, Larher F. 2000. L-Lysine catabolism is osmo-regulated at the level of lysine-ketoglutarate reductase and saccharopine dehydrogenase in rapeseed leaf discs. Plant Physiology and Biochemistry,38, 577–585.
Munns R, Tester M. 2008. Mechanisms of salinity tolerance.Annual Review of Plant Biology,59, 651–681.
Nagaraja Reddy R, Madhusudhana R, Murali Mohan S,Chakravarthi D V N, Seetharama N. 2011. Characterization,development and mapping of unigene-derived microsatellite markers in sorghum [Sorghum bicolor (L.) Moench].Molecular Breeding,29, 543–564.
Paul S, Kundu A, Pal A. 2011. Identi fication and validation of conserved microRNAs along with their differential expression in roots of Vigna unguiculata grown under salt stress. Plant Cell Tissue and Organ Culture,105, 233–242.
Postnikova O A, Shao J, Nemchinov L G. 2013. Analysis of the alfalfa root transcriptome in response to salinity stress.Plant & Cell Physiology,54, 1041–1055.
Reddy V S, Shlykov M A, Castillo R, Sun E I, Saier Jr M H.2012. The major facilitator superfamily (MFS) revisited.FEBS Journal,279, 2022–2035.
Robinson M D, McCarthy D J, Smyth G K. 2010. edgeR: A bioconductor package for differential expression analysis of digital gene expression data. Bioinformatics,26, 139–140.
Sekhwal M K, Sharma V, Sarin R. 2013. Identi fication of MFS proteins in sorghum using semantic similarity. Theory in Biosciences,132, 105–113.
Shabala S, Cuin T A. 2008. Potassium transport and plant salt tolerance. Physiologia Plantarum,133, 651–669.
Shi H, Jiang C, Ye T, Tan D X, Reiter R J, Zhang H, Liu R, Chan Z. 2015. Comparative physiological, metabolomic, and transcriptomic analyses reveal mechanisms of improved abiotic stress resistance in bermudagrass [Cynodon dactylon (L). Pers.] by exogenous melatonin. Journal of Experimental Botany,66, 681–694.
Storey J D, Tibshirani R. 2003. Statistical signi ficance for genomewide studies. Proceedings of the National Academy of Sciences of the United States of America,100, 9440–9445.
Sun Y, Li M L, Mao P S. 2011. Study of standard germination method in Carex rigescens. Northern Horticulture,19,68–70. (in Chinese)
Tang L, Cai H, Ji W, Luo X, Wang Z, Wu J, Wang X, Cui L,Wang Y, Zhu Y, Bai X. 2013. Overexpression of GsZFP1 enhances salt and drought tolerance in transgenic alfalfa(Medicago sativa L.). Plant Physiology and Biochemistry,71, 22–30.
NSSO (The National Soil Survey Of fice of China). 1998. Soil of China. China Agriculture Press, China. (in Chinese)
Wang C T, Shao J M. 2012. Characterization of the ZmCK1 gene encoding a calcium-dependent protein kinase responsive to multiple abiotic stresses in maize. Plant Molecular Biology Reporter,31, 222–230.
Wang J, Li B, Meng Y, Ma X, Lai Y, Si E, Yang K, Ren P, Shang X, Wang H. 2015. Transcriptomic pro filing of the salt-stress response in the halophyte Halogeton glomeratus. BMC Genomics,16, 169.
Wang L K, Feng Z X, Wang X, Wang X W, Zhang X G.2010. DEGseq: An R package for identifying differentially expressed genes from RNA-seq data. Bioinformatics,26,136–138.
Wang X, Han H, Yan J, Chen F, Wei W. 2015. A new AP2/ERF transcription factor from the oil plant jatropha curcas confers salt and drought tolerance to transgenic tobacco.Applied Biochemistry and Biotechnology,176, 582–597.
Wang Y. 1997. Advances in research of heat shock factors.Journal of China Three Gorges University,2, 110–114.(in Chinese)
Weber H, Hellmann H. 2009. Arabidopsis thaliana BTB/ POZMATH proteins interact with members of the ERF/AP2 transcription factor family. FEBS Journal,276, 6624–6635.
Xie Q, Niu J, Xu X, Xu L, Zhang Y, Fan B, Liang X, Zhang L,Yin S, Han L. 2015. De novo assembly of the Japanese lawngrass (Zoysia japonica Steud.) root transcriptome and identi fication of candidate unigenes related to early responses under salt stress. Frontiers in Plant Science,6, 610.
Xu Z S, Chen M, Li L C, Ma Y Z. 2011. Functions and application of the AP2/ERF transcription factor family in crop improvement. Journal of Integrative Plant Biology,53, 570–585.
Yamamoto N, Takano O, Tanakay K, Ishige T, Terashima S, Endo C, Kurusu T, Yajima S, Yano K, Tada Y. 2015.Comprehensive analysis of transcriptome response to salinity stress in the halophytic turf grass Sporobolus virginicus. Frontiers in Plant Science,6, 00241.
Yang Z, Xie T, Liu Q. 2014. Physiological responses of Phragmites australisto the combined effects of water and salinity stress. Ecohydrology,7, 420–426.
Zhang F, Li L, Jiao Z, Chen Y, Liu H, Chen X, Fu J, Wang G,Zheng J. 2016. Characterization of the calcineurin B-Like(CBL) gene family in maize and functional analysis of ZmCBL9 under abscisic acid and abiotic stress treatments.Plant Science,253, 118–129.
Zhang K, Li M N, Cao S H, Sun Y. 2017. Response of Carex rigescens to different NaCl concentrations and its salinity threshold calculation. Pratacultural science,34, 479–487.(in Chinese)
10 April, 2017 Accepted 15 August, 2017
LI Ming-na, E-mail: naljt4@163.com; LONG Rui-cai, E-mail:dragongodsgod@163.com; Correspondence SUN Yan, E-mail:02008@cau.edu.cn
*These authors contributed equally to this study.
© 2018 CAAS. Publishing services by Elsevier B.V. All rights reserved.
10.1016/S2095-3119(17)61749-0
Section editor LUO Xu-gang
Managing editor ZHANG Juan
 Journal of Integrative Agriculture2018年1期
- Journal of Integrative Agriculture的其它文章
- Climate change and agriculture: Impacts and adaptive responses in Iran
- Development of elite restoring lines by integrating blast resistance and low amylose content using MAS
- Evaluation of stability and yield potential of upland rice genotypes in North and Northeast Thailand
- ldenti fication of the resistance gene to powdery mildew in Chinese wheat landrace Baiyouyantiao
- New clues concerning pigment biosynthesis in green colored fiber provided by proteomics-based analysis
- Constitutive expression of feedback-insensitive cystathionine γ-synthase increases methionine levels in soybean leaves and seeds