
Nitrous oxide emissions following seasonal freeze-thaw events from arable soils in Northeast China
2018-01-04 02:04CHENZheYANGShiqiZHANGAipingJINGXinSONGWeiminMIZhaorongZHANGQingwenWANGWenyingYANGZhengli
CHEN Zhe, YANG Shi-qi ZHANG Ai-ping JING Xin, SONG Wei-min, MI Zhao-rong, ZHANG Qingwen WANG Wen-ying, YANG Zheng-li
1 Key Laboratory for Agro-environment, Ministry of Agriculture/Institute of Environment and Sustainable Development in Agriculture,Chinese Academy of Agricultural Sciences, Beijing 100081, P.R.China
2 School of Life Sciences, Qinghai Normal University, Xining 810008, P.R.China
3 Key Laboratory for Earth Surface Processes, Ministry of Education/Department of Ecology, College of Urban and Environmental Sciences, Peking University, Beijing 100871, P.R.China
4 Center for Earth System Science, Tsinghua University, Beijing 100084, P.R.China
5 Farmland Irrigation Research Institute, Chinese Academy of Agricultural Sciences, Xinxiang 453002, P.R.China
RESEARCH ARTICLE
Nitrous oxide emissions following seasonal freeze-thaw events from arable soils in Northeast China
CHEN Zhe1,2, YANG Shi-qi1, ZHANG Ai-ping1, JING Xin3, SONG Wei-min4, MI Zhao-rong5, ZHANG Qingwen1, WANG Wen-ying2, YANG Zheng-li1
1 Key Laboratory for Agro-environment, Ministry of Agriculture/Institute of Environment and Sustainable Development in Agriculture,Chinese Academy of Agricultural Sciences, Beijing 100081, P.R.China
2 School of Life Sciences, Qinghai Normal University, Xining 810008, P.R.China
3 Key Laboratory for Earth Surface Processes, Ministry of Education/Department of Ecology, College of Urban and Environmental Sciences, Peking University, Beijing 100871, P.R.China
4 Center for Earth System Science, Tsinghua University, Beijing 100084, P.R.China
5 Farmland Irrigation Research Institute, Chinese Academy of Agricultural Sciences, Xinxiang 453002, P.R.China
Seasonal soil freeze-thaw events may enhance soil nitrogen transformation and thus stimulate nitrous oxide (N2O) emissions in cold regions. However, the mechanisms of soil N2O emission during the freeze-thaw cycling in the field remain unclear.We evaluated N2O emissions and soil biotic and abiotic factors in maize and paddy fields over 20 months in Northeast China,and the structural equation model (SEM) was used to determine which factors affected N2O production during non-growing season. Our results veri fied that the seasonal freeze-thaw cycles mitigated the available soil nitrogen and carbon limitation during spring thawing period, but simultaneously increased the gaseous N2O-N losses at the annual time scale under field condition. The N2O-N cumulative losses during the non-growing season amounted to 0.71 and 0.55 kg N ha–1for the paddy and maize fields, respectively, and contributed to 66 and 18% of the annual total. The highest emission rates (199.2–257.4 μg m–2h–1) were observed during soil thawing for both fields, but we did not observe an emission peak during soil freezing in early winter. Although the pulses of N2O emission in spring were short-lived (18 d), it resulted in approximately 80% of the non-growing season N2O-N loss. The N2O burst during the spring thawing was triggered by the combined impact of high soil moisture, flush available nitrogen and carbon, and rapid recovery of microbial biomass. SEM analysis indicated that the soil moisture, available substrates including NH4+and dissolved organic carbon (DOC), and microbial biomass nitrogen (MBN) explained 32, 36, 16 and 51% of the N2O flux variation, respectively, during the non-growing season. Our results suggested that N2O emission during the spring thawing make a vital contribution of the annual nitrogen budget, and the vast seasonally frozen and snow-covered croplands will have high potential to exert a positive feedback on climate change considering the sensitive response of nitrogen biogeochemical cycling to the freeze-thaw disturbance.
N2O, non-growing season, nitrogen biogeochemical cycling, soil moisture, snow cover, structural equation model
1. Introduction
Over the past decade, agricultural ecosystems contributed 80% of the increase in atmospheric nitrous oxide (N2O) due to the application of nitrogen-fertilizers (IPCC 2013). However,current inventories of the N2O budget in seasonally frozen farmlands focus on the crop-growing season, whereas the episodic emissions during the non-growing season (when soil is freezing, thawing and covered with snow) are often not considered. Goodroad and Keeney (1984) first observed that the N2O fluxes increase signi ficantly during soil thawing in early spring. Subsequent researches con firmed that the peak fluxes of the N2O bursts from arable soils in spring thawing are range from 86.4 μg m–2h–1(Maljanen et al. 2007)to 13.7 mg m–2h–1(Nyborg et al. 1997). The cumulative emissions during the non-growing season (from October to the following April) are approximately 0.7 to 27.2 kg NO2-N ha–1(Nyborg et al. 1997; Dörsch et al. 2004; Regina et al.2004; Syväsalo et al. 2004; Matzner and Borken 2008) and between 50 to 80% of the annual N2O-N budget occurs in whole winter (Wagner-Riddle et al. 1997; Röver et al. 1998;Papen and Butterbach-Bahl 1999; Teepe et al. 2000; Regina et al. 2004; Syväsalo et al. 2004). Moreover, cold climate areas also tend to retain more nitrogen within the soil organic matter, but the global warming is undoubtedly altering the freeze-thaw pattern (Henry 2008; Gaëlle et al. 2011; Schuur and Abbott 2011; Elberling et al. 2013; Schuur et al. 2015;Wipf et al. 2015). Consequently, the vulnerable organic nitrogen will be metabolized and transformed to N2O-gas intensively (Matzner and Borken 2008; Risk et al. 2013;Bracho et al. 2016), and the warming potential of which is about 265 times more than CO2over a 100-year period(IPCC 2013). Thus, better understanding the effects of seasonal freeze-thaw events on N2O emission of arable soils in middle-high latitudes is important in evaluating the cold climate ecosystem nitrogen cycle to the climate feedback.
Physical release and newly produce are proposed as two main mechanisms to explain N2O emission increase during soil freeze-thaw cycles (Risk et al. 2013). The former hypothesis suggests that N2O is produced by microorganisms that are harboured by thin water films in the soil matrix where the soil water remains unfrozen, and the N2O is trapped under the frozen soil until the diffusion barrier disappears during thawing periods (Kaiser et al.1998; Teepe et al. 2001). However, a few studies supported the emission of newly produced N2O at the onset of thaw,which is stimulated by the effects of freeze-thaw events on disrupting soil aggregates (Chai et al. 2014), lysing microbial cells (Freppaz et al. 2007), increasing nutrition availability(Deluca et al. 1992; Herrmann and Witter 2002; Grogan et al. 2004; Liu et al. 2014; Yang et al. 2014), changing microbial community structure (Kumar et al. 2013) and enhancing denitri fication (Nyborg et al. 1997; Öquist et al.2004; Wagner-Riddle et al. 2008). Whereas, these results were mostly based on single factor laboratory experiments,and the real circumstances of the freeze-thaw regimes, soil moisture, litter layer, snow cover and melting process cannot be simulated properly (Henry 2007). Hence, more in-situ studies are needed to inquire the main factors that control soil N2O fluxes in seasonal freeze-thaw events.
Furthermore, elevated N2O emissions were detected during both soil freezing and thawing processes during previous simulation tests (Teepe et al. 2001; Koponen et al. 2006). Öquist et al. (2004) noted that a large amount of N2O is generated by intense denitri fication when soil temperatures fall below 0°C and the rate is much higher when there are high moisture contents in laboratory test.The reality is that, during spring thawing period, surface layer temperature usually fluctuates around 0°C (Zhang et al. 2004), and soil is waterlogged after snow melt if the winter snowpack >30 cm (Liptzin et al. 2009). Moreover,microbial biochemistry is still continuing during the winter climatic harshness (Clein and Schimel 1995), and microbial biomass shift is large enough to change overall pattern of soil N cycling from net mineralization to net immobilization(Schimel et al. 2007). These reasons indicated that soil freezing in early winter and thawing in early spring are likely crucial periods for monitoring the N2O emissions.
In Northeast China, the region is not only a typical seasonally frozen area but also one of the world’s top three black soil (Mollisols) zones and a major grain-producing area in China. The high organic matter, clay content,macroaggregate stability, cation exchange capacity, and favourable soil structure make the black soil very fertile and productive (Xing et al. 2005). However, in pursuit of higher and higher crop yields, the application rates of nitrogen-fertilizer for paddy and maize fields were as high as 300 and 260 kg N ha–1yr–1, respectively (Ju 2015). This signi ficantly increased soil nitrate accumulation (Ju 2014),and led to enhanced rate of microbial denitrogenation during the non-growing season (Schimel and Bennett 2004;Groffman et al. 2006). Therefore, this region is probably a hotspot of N2O emission during winter. Nevertheless,the relevant researches have rarely been reported, not to mention the seasonal differences of N2O emissions among different crop systems and the contribution of the non-growing season emissions to the year. For above reasons, we hypothesized that: (1) The soil moisture, soil temperature, available substrates and microbial biomass pool are the main factors which collectively control the N2O emission during the seasonal freeze-thaw process in the field; (2) there exists a signi ficant seasonal variability in the N2O flux between paddy and maize fields.
In order to test the hypotheses and better understand the effects of seasonal freeze-thaw events on N2O emission in different land use types, we conducted a 20-mon in situ experiment in Heilongjiang Province in Northeast China.This study mainly (1) quanti fied the annual N2O fluxes of paddy and maize fields, with an emphasis on soil freezing and thawing periods and (2) evaluated the importance of abiotic (snow cover, soil water, soil temperature and climate), biotic factors (microbial biomass) and soil available substrates (including NH4+, NO3
–, dissolved organic nitrogen,dissolved organic carbon) to N2O emission during the nongrowing season.
2. Materials and methods
2.1. Site description
The research site is located in the Songnen Plain(128°48´43´´E, 45°49´46´´N) of the Heilongjiang Province,Northeast China. The climate is temperate continental monsoon. According to the 2005 to 2015 climate data from the local meteorological station, the average annual temperature was 3.1°C, and the mean monthly air temperatures ranged from –20.5°C in January to 22.2°C in July. The soil in this region usually begins to freeze at the early October and the deepest frozen ground reach to 100 cm during January–February (Song et al. 2008). The snow begins to thaw with the increasing air temperature during early March, and the topsoil starts to thaw after snow melt during mid-March. The frozen ground completely thawed at the end of April. The topsoil usually undergo multiple diurnal freeze-thaw cycles from October to November and March to April.
The mean annual precipitation was 570 mm and potential evaporation was 1 300 mm in last 10 years. Approximately 70–90% of the precipitation fell as rain between April and November, and 10–30% of which fell as snow from November to the following March. The snow depth usually ranges from 15–50 cm and the deepest snowpack appeared in the end of February, but then it melting rapidly with the air temperature increasing (less than half a month).
This study area is an important grain production base in China, which has bene fited from the very fertile and productive black soil. The black soil belongs to the pachic Haploborolls subtype of Haploborolls in the Borolls suborders, and it was named Mollisols in the Chinese Soil Taxonomy (CRGCST 2001). The rice and maize are the chief crops in the study region. Our experimental paddy field is lowland and the maize field is upland, all of them have been cultivated for more than 30 years. The two fields are about 1 km apart. Our experiment plots were conventionally managed. In paddy field, 585 kg NPK compound fertilizer(N:P2O5:K2O=18:18:18) and 228 kg urea were applied as the base fertilizer (20 May) and tillering fertilizer (15 July),respectively. In mazie field, 507 kg compound fertilizer and 198 kg urea were applied on 1 May and 15 June,respectively. The maize was sowed during early May and harvested during early October, and stalks were cut and removed from the field after harvest. The rice seedlings were transplanted during late May and harvested during late September. But the rice straws were chopped and left on the ground until next year to plough. The rest time is the non-growing season, which lasts more than 200 days.There was no irrigation for the maize field, but we regularly irrigated in paddy field and keep the surface water level at 10 cm from June to August. Both fields were not ploughed in the fall until the following spring, and the topsoil (0–20 cm) all of the plots were tillaged during 27 April to 5 May in 2015 and 2016.
We arranged three replicate 10 m×10 m plots in each field, and three chambers were installed in each plot randomly for measuring soil N2O flux. In addition, surface(10 cm) and deep soil (30 cm) temperature were recorded every half an hour by using HOBO Micro Station Data Logger(H21, ONSET, USA). Snow depth was measured everyday manually during the winter. The field soil (0–30 cm)properties of the sample plots were presented in Table 1(sampled in May 2014).
2.2. De finition of time periods for monitoring of N2O fluxes
Based on the data of temperature, snowpack, the local meteorological condition and cultivation system, the monitoring time for the annual N2O flux was divided into four periods: 1) the growing season ranges from sowing(1 May) to harvest (30 September 2015); 2) the freezing period begins at the end of crops harvest and ends when there are seven consecutive days of soil covered with snowpack (from 1 October to 28 November 2014 and1 October to 1 December, 2015, respectively); 3) the snow covered period begins at the end of the soil freezing period and ends when the snow cover melts out (from 28 November, 2014 to 14 March, 2015 and 2 December, 2015 to 12 March, 2016, respectively); 4) the thawing period,which is between the snow covered period and growing season (15 March to 30 April, 2015 and 13 March to 30 April, 2016, respectively) (Song et al. 2015).

Table 1 Properties of soil samples in paddy and maize field
2.3. N2O flux measurements
Soil N2O flux was measured using a static opaque chamber and gas chromatography techniques. The static chambers were constructed of stainless-steel and consisted of two separate parts: a chamber-pedestal (50 cm×50 cm×15 cm)and a removable top (50 cm×50 cm×50 cm). Three pedestals were randomly inserted into each plot and remained intact during the entire observation period. A mini-fan was fixed inside the chamber to stir air. A highly sensitive temperature sensor and a three-way valve were installed in the chamber.To maintain a consistent temperature inside, we wrapped a feather quilt around the outside of the chamber. The gas flux during mid-morning (9:00–11:00 a.m.) was used to represent one-day’s average flux (Mosier et al. 1991). A 100-mL gas sample was taken from inside the chamber with a plastic syringe and injected immediately into a pre-evacuated gas sampling bag through the three-way valve. Gas samples were collected at 0, 10, 20, and 30 min after the chambers were closed. We increased the sampling frequency to once every two days in early winter (October to November) and early spring (March to April). On other dates, the gas was measured every ten days. The N2O concentration of the gas sample was analysed within 24 h using gas chromatography(Agilent 7890A, Agilent Technologies, USA). The N2O flux was calculated according to the following equation:

Where, F (in μg m–2h–1) is the N2O flux, dc/dt is the slope of the linear regression for the N2O concentration gradient as a function of time, M (in g mol–1) is the molecular mass of N2O, P (in Pa) is the atmospheric pressure, T (in K) is the absolute temperature during sampling, V0(in L), T0(in K) and P0(in Pa) are the gas mole volume, absolute air temperature and atmospheric pressure under standard condition, respectively, and H (in cm) is the height of the chamber. A positive F-value means that there is a net emission of N2O, and a negative value is opposite.
2.4. Soil sampling
The soil sampling dates were the same as for gas sampling.Soil samples (0–20 cm) were collected from five points randomly in each plot. The five samples were mixed into one homogeneous sample that was then divided into two parts. One part was used to determine the soil moisture,and the other was prepared for available nitrogen and microbial biomass analysis. All of the soil samples were immediately placed in sealed plastic bags in an ice cooler and transported to the laboratory. The samples were passed through a 2-mm sieve and were stored in a refrigerator at 4°C in preparation for the measurements. To accomplish soil sampling after the soil frozen in winter, we inserted 30 stainless-steel tubes (diameter of 3 cm; length of 20 cm)into the soil in each plot before autumn freeze up, then five tubes of which were excavated every two weeks from December 2014 to February 2015, and these soil column were treated as before.
2.5. Soil chemical measurements
All chemical indexes were performed within one week. The soil mineral nitrogen was quanti fied by colorimetric analysis.First, the fresh soil samples were extracted with 2 mol L–1KCl(soil:solution=1:10) by shaking for 0.5 h on a reciprocating shaker at 200 r min–1and then filtered. Second, the extracts were analysed for NH4+and NO3–with a continuous flow analyser (AutoAnalyzer 3, SEAL, Germany). The microbial biomass nitrogen (MBN) was determined using a chloroform fumigation-direct extraction procedure (Ehrlich et al. 1985). Brie fly, each sample was weighed 15 g in duplicate for subsamples: One was fumigated with ethanolfree chloroform for 24 h, and the other was non-fumigated.Both soils were extracted with 100 mL of 0.5 mol L–1K2SO4by shaking for 0.5 h on a shaker at 125 r min–1and then filtered. Two drops of phosphoric acid were added into the leaching solution to remove the inorganic carbon. A TOC/TN analyser (Multi N/C 2100, Jena, Germany) was used to determine the nitrogen content and dissolved organic carbon (DOC) in the extracts. The MBN was estimated via the following equation: BN=EN/KN, where, BNis the MBN, ENis the difference between the extract nitrogen content in the fumigated and non-fumigated soil, and KNis the correction factor, where, KN=0.45 (Wu et al. 1990). The nitrogen content of the extract for the non-fumigated soil represented the total dissolved nitrogen (TDN). The dissolved organic nitrogen (DON) is equal to the TDN minus the NO3–and NH4+. All of these nitrogen contents were expressed as mg N kg–1dried soil. The soil water content was determined gravimetrically via oven-drying for 24 h at 105°C.
2.6. Data analysis
Repeated measures-ANOVA was used to determine the main effects of the cropland type and date and their interactive effects on the annual average N2O fluxes. The differences of the N2O fluxes among the seasons in the same field and the differences between the two fields in the same period were analysed using one-way ANOVA.The cumulative N2O emissions were estimated using a linear interpolation method. Linear, polynomial, exponential and peak function regressions were performed to test the relationships between the N2O fluxes and soil temperature(ST), soil moisture (SM), number of thawing days (NTD,which begin with the snow melt and end with the soil thawed completely), amplitude of daily temperature (ADT), DON,DOC, and MBN. The results were presented via the best fitting regression models. Using R Statistical Software ver.3.2.1, we established structural equation model in which the soil conditions, metabolic substrates, and freeze-thaw climate are all predictors of the N2O flux during the nongrowing season. To eliminate the impact of a variable dimension on the path coef ficient in the structural equation model, all data were standardized using a Z-score. The Z-score was calculated using every variable by subtracting the mean value and dividing by the standard deviation.
3. Results
3.1. Environmental conditions
In this study, pronounced seasonal variations for the precipitation, air temperature and soil temperature were observed. The total precipitation in 2015 was 489 mm, 79%of which fell during the growing season and 103.9 mm fell as snow during winter (Fig. 1-A). A continuous snowpack developed in late November in both 2014 and 2015. The maximum snow depth was reached to 44.7 cm on 2 March,2015 and 38.0 cm on 21 February, 2016. Snowpack began to melt on 14 March, 2015 and 12 March, 2016, respectively,when the air temperature was above 0°C. The snow melting process lasted about 10 d in both years. The snow-covered period was 107 and 102 d in the two non-growing season,respectively (Fig. 2-A).
The mean annual air temperature was 3.7°C, and the lowest and highest monthly mean temperatures were –21.5°C in January 2016 and 22.1°C in July 2015,respectively. The extreme low-temperature was –33.8°C which occurred on 9 February 2015. During the freezing and thawing periods, the air temperature was >0°C during the day and <0°C during the night (Fig. 1-B).
Soil temperature followed the same trend with air temperature in general. The maximum monthly mean temperatures of surface (10 cm) and deep (30 cm) soil were 25°C in July 2015 and 21.9°C in August 2015, respectively,and decreased gradually from September to November.From late October, the upper soil layers began to freeze top-down (Fig. 2-B). The minimum surface temperature occurred in February both in 2015 and 2016. By the time the snowpack reached more than 10 cm, the soil temperature at 10 and 30 cm depth stayed constant at approximately–6 and –4°C, respectively. Soil thawing began after the snow melted, and the surface soil temperature fluctuated from –1 to 4°C until the soil was dry and the melt water was evaporated, but the deep soil thawing was delayed half a month when compared with the surface (Figs. 2-A and 3-A).During thawing period, the snow melt dramatically increased the soil moisture of the two sites (Figs. 2-A and 3-A).
3.2. Soil nitrogen dynamics during the non-growing season
During the freezing period, the soil NH4+, NO3–and MBN contents all exhibited a decreasing trend in the two fields(Fig. 3-B, C and F). However, the soil DON in maize field and DOC in both field increased firstly and then decreased(Fig. 3-D and E). The NO3–and MBN contents increased slowly during the snow-covered period, but NH4+and DON continued to decrease in the two sites. DOC decreased at the start of the snow covered period then increased from January to mid-March. During the thawing period, the soil NH4+, DON, DOC in both fields and NO3–in the maize field all exhibited a pulse released, which concentrations increased by approximately 2 to 7 times compared with the end of winter (2 March, 2015). The duration of the nutrient flush were short, which decreased after the snow melted and then increased as the soil temperature increased and the moisture decreased. The NO3–content of the paddy field soil diminished signi ficantly in early thawing period, and it was maintained at low content in long-term. Different from that of other available carbon and nitrogen variation patterns, the MBN contents increased gradually during all of the thawing periods, but no obvious peak was observed (Fig. 3-F).

Fig. 1 Daily precipitation (A) and air temperature (B) recorded at the nearby weather station during the experimental period from October 2014 to May 2016.
The soil NO3–and MBN contents of the maize field were higher than that of the paddy field throughout the nongrowing season (Fig. 3-C and F). The DON, DOC and NH4+contents of the paddy field were lower and/or nearly the same than the maize field during freezing and snowcovered period, but increased signi ficantly in thawing period(Fig. 3-B, D and E). The peaks of DOC and NH4+contents of the paddy field were higher than those of maize field.
3.3. Annual dynamics of N2O fluxes
The N2O fluxes of the soil exhibited obvious variations in the paddy and maize fields (Fig. 2-C). During the two consecutive non-growing seasons, from October 2014 to early March 2015 and from October 2015 to early March 2016, the N2O emission rates held steady at low levels, and it even consumed weakly during the snow-covered period in both fields. However, paddy and maize fields showed a similar increase in the N2O emissions after the thawing process started. The maximum fluxes of the paddy and maize fields were 257.43 and 207.44 μg m–2h–1, respectively,on 22 March, 2015. The emission peaks lasted from 14 March to 31 March, 2015. In early April, the N2O fluxes quickly dropped to lower rates in both of the fields. Although the upsurge was short, the peak in the maize field was nearly 100 times the mean rate in early winter, and this was 40 times in the paddy field. The emission peaks were also measured during the following spring thawing in both fields in mid-March 2016. In the spring thawing of 2015, peak emissions happened at the same date for both crop systems and paddy soil had higher N2O flux compared with maize field. In spring thawing of 2016, the N2O fluxes were similar in the both crop systems, while the emission peak of maize field occurred 6 d earlier than paddy field. Additionally, the peaks in the non-growing season were higher than that in the growing season at both sites. For example, the peak of the growing season in the paddy field was 18.54 μg m–2h–1, which was only 7% of the thawing peak.
During the early growing season, the N2O fluxes tended to increase in both fields. Shortly after fertilizer was applied,a peak for the second N2O release was observed in early June to late July. The peak emission rate of the maize field was 152.51 μg m–2h–1(on 6 June) and was higher than that of the paddy field (18.54 μg m–2h–1, on 15 July). After the peak, the N2O flux of the paddy field decreased with time,but the flux of the maize field first decreased from July to early August and then increased in September. The third peak for the maize field was 56.20 μg m–2h–1and occurred in the end of the growing season (mid-to-end of September 2015) (Fig. 2-C).

Fig. 2 Dynamics of the snow depth (A), soil temperature (in-depth of 10 and 30 cm) (B) and N2O emissions of the paddy and maize fields (C) from October 2014 to May 2016. Error bars represent standard deviations of the mean.
3.4. Seasonal cumulative N2O-N losses
The statistical results revealed that both the date and cropland type had signi ficant impacts on N2O fluxes(Table 2). In the time scale, there were signi ficant seasonal patterns in the N2O emission at both sites. From October 2014 to September 2015, the average flux in the paddy soil during the non-growing season was 26.34 μg m–2h–1, more than that during the growing season, which was 10 μg m–2h–1(P<0.01). However, the mean flux in the maize field during the growing season (69.36 μg m–2h–1) was signi ficantly higher than those during the non-growing season (21.45 μg m–2h–1). When the non-growing season was divided into freezing, snow-covered, and thawing periods, the mean fluxes of N2O in the paddy and maize fields were 51.38 and 46.53 μg m–2h–1, respectively, for the thawing period. The mean rates during the thawing period in both fields were signi ficantly higher than during the freezing and snowcovered period. The average flux of the paddy soil during the thawing period was five times more than that during the growing season; however, in the maize field, the average flux during the growing season was signi ficantly higher than that during the thawing period (Table 2).
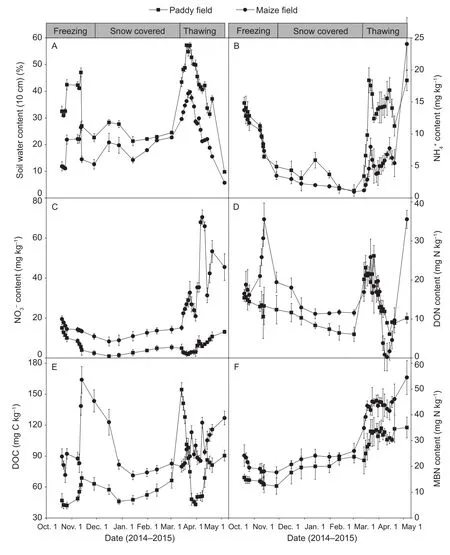
Fig. 3 Variations in soil moisture (A), ammonium (NH4+) (B), nitrate (NO3–) (C), dissolved organic nitrogen (DON) (D), dissolved organic carbon (DOC) (E) and microbial biomass nitrogen (MBN) (F) during the non-growing season from October 2014 to May 2015. Error bars represent standard deviations of the mean.
During the same period, the average N2O fluxes were signi ficantly different between the two farmlands, except during the thawing period. The mean N2O flux in the maize field during the growing season was approximately seven times more than in the paddy field. Although the N2O emission rates during the non-growing season of the two fields were not signi ficantly different, the N2O emission rates of the paddy field in the freezing and snow-covered period(7.61 and 1.8 μg m–2h–1, respectively) were signi ficantly higher than those in the maize field (2.64 and –3.06 μg m–2h–1, respectively). The average N2O flux of the maize field during the snow-covered period was negative, resulting in a net “sink” in atmospheric N2O (Table 2).
The annual N2O-N loss in the paddy and maize fields from October 2014 to September 2015 was 1.08 and 3.01 μg m–2h–1, respectively (Fig. 4). The loss during the nongrowing season in the paddy field contributed up to 66%to the annual loss, but it was 18% in the maize field. Dueto the large amount of N2O emission during the thawing period, the spring cumulative emissions of the both fields accounted for >80% of the total non-growing season N2O-N loss. Therefore, the N2O-N release during spring was an important parameter for soil nitrogen cycling.

Table 2 Mean fluxes of N2O (μg m–2 h–1) during different seasons from October 2014 to September 2015 and the results of statistical analysis
3.5. Effects of abiotic and soil substrates on N2O flux during the non-growing season
We analysed the impacts of environmental factors, soil available nitrogen/carbon, and microbial biomass on the N2O fluxes. For the abiotic factors: there was a positive exponential relationship between soil moisture and N2O fluxes in both fields (Fig. 5-D), whereas soil temperature and amplitude of daily temperature had no signi ficant correlation with the N2O fluxes (Fig. 5-B and C). The structural equation model showed that among these abiotic factors only soil moisture directly affecting N2O fluxes during the non-growing season, and the path coef ficient (β) was 0.32.This implied that 32% of the variation in N2O fluxes could be explained by soil moisture (Fig. 6). In addition, a high temporal consistency between the N2O fluxes peak and the maximum soil water contents are existed in the both fields(Figs. 2-C and 3-A).
Despite no signi ficant relationships between air temperature, amplitude of daily temperature and N2O fluxes, the structural equation model analysis demonstrated that air temperature indirectly (via the soil temperature,β=0.78) impacted the N2O fluxes. The amplitude of daily temperature indirectly impacted the N2O fluxes through the MBN (Fig. 6). Although the number of thawing days affected the N2O fluxes directly in a negative way, it could promote N2O emissions indirectly by increasing NH4+content.Additionally, for both sites, a peak function relationship existed between N2O fluxes and the number of thawing days, and the corresponding x-axis value of the functions’peak was 8.9 days (Fig. 5-A). This indicated that the N2O fluxes progressively increased during the first 9 days and then decreased during the next 9 days. Therefore, after approximately 18 days, the rates returned to the pre-levels.

Fig. 4 N2O cumulative emissions from the paddy and maize fields from October 2014 to September 2015.
For the soil available nitrogen/carbon, the relationship between N2O fluxes and MBN and DOC can be expressed as the positive exponential and line functions respectively in both fields (Fig. 5-H and I). The MBN could explain as high as 51% of the variation in N2O fluxes, and DOC could explain 16% (Fig. 6). Although the inorganic nitrogen exhibited weak associations with N2O fluxes in the regression analysis (Fig. 5-E and F), the structural equation model results revealed that the NH4+contents directly explained 36% of the N2O variation (Fig. 6). Therefore, rich carbon and nitrogen source, and high soil microbial biomass were the most important drivers that controlled the N2O emission during the non-growing season.
4. Discussion
4.1. N2O fluxes
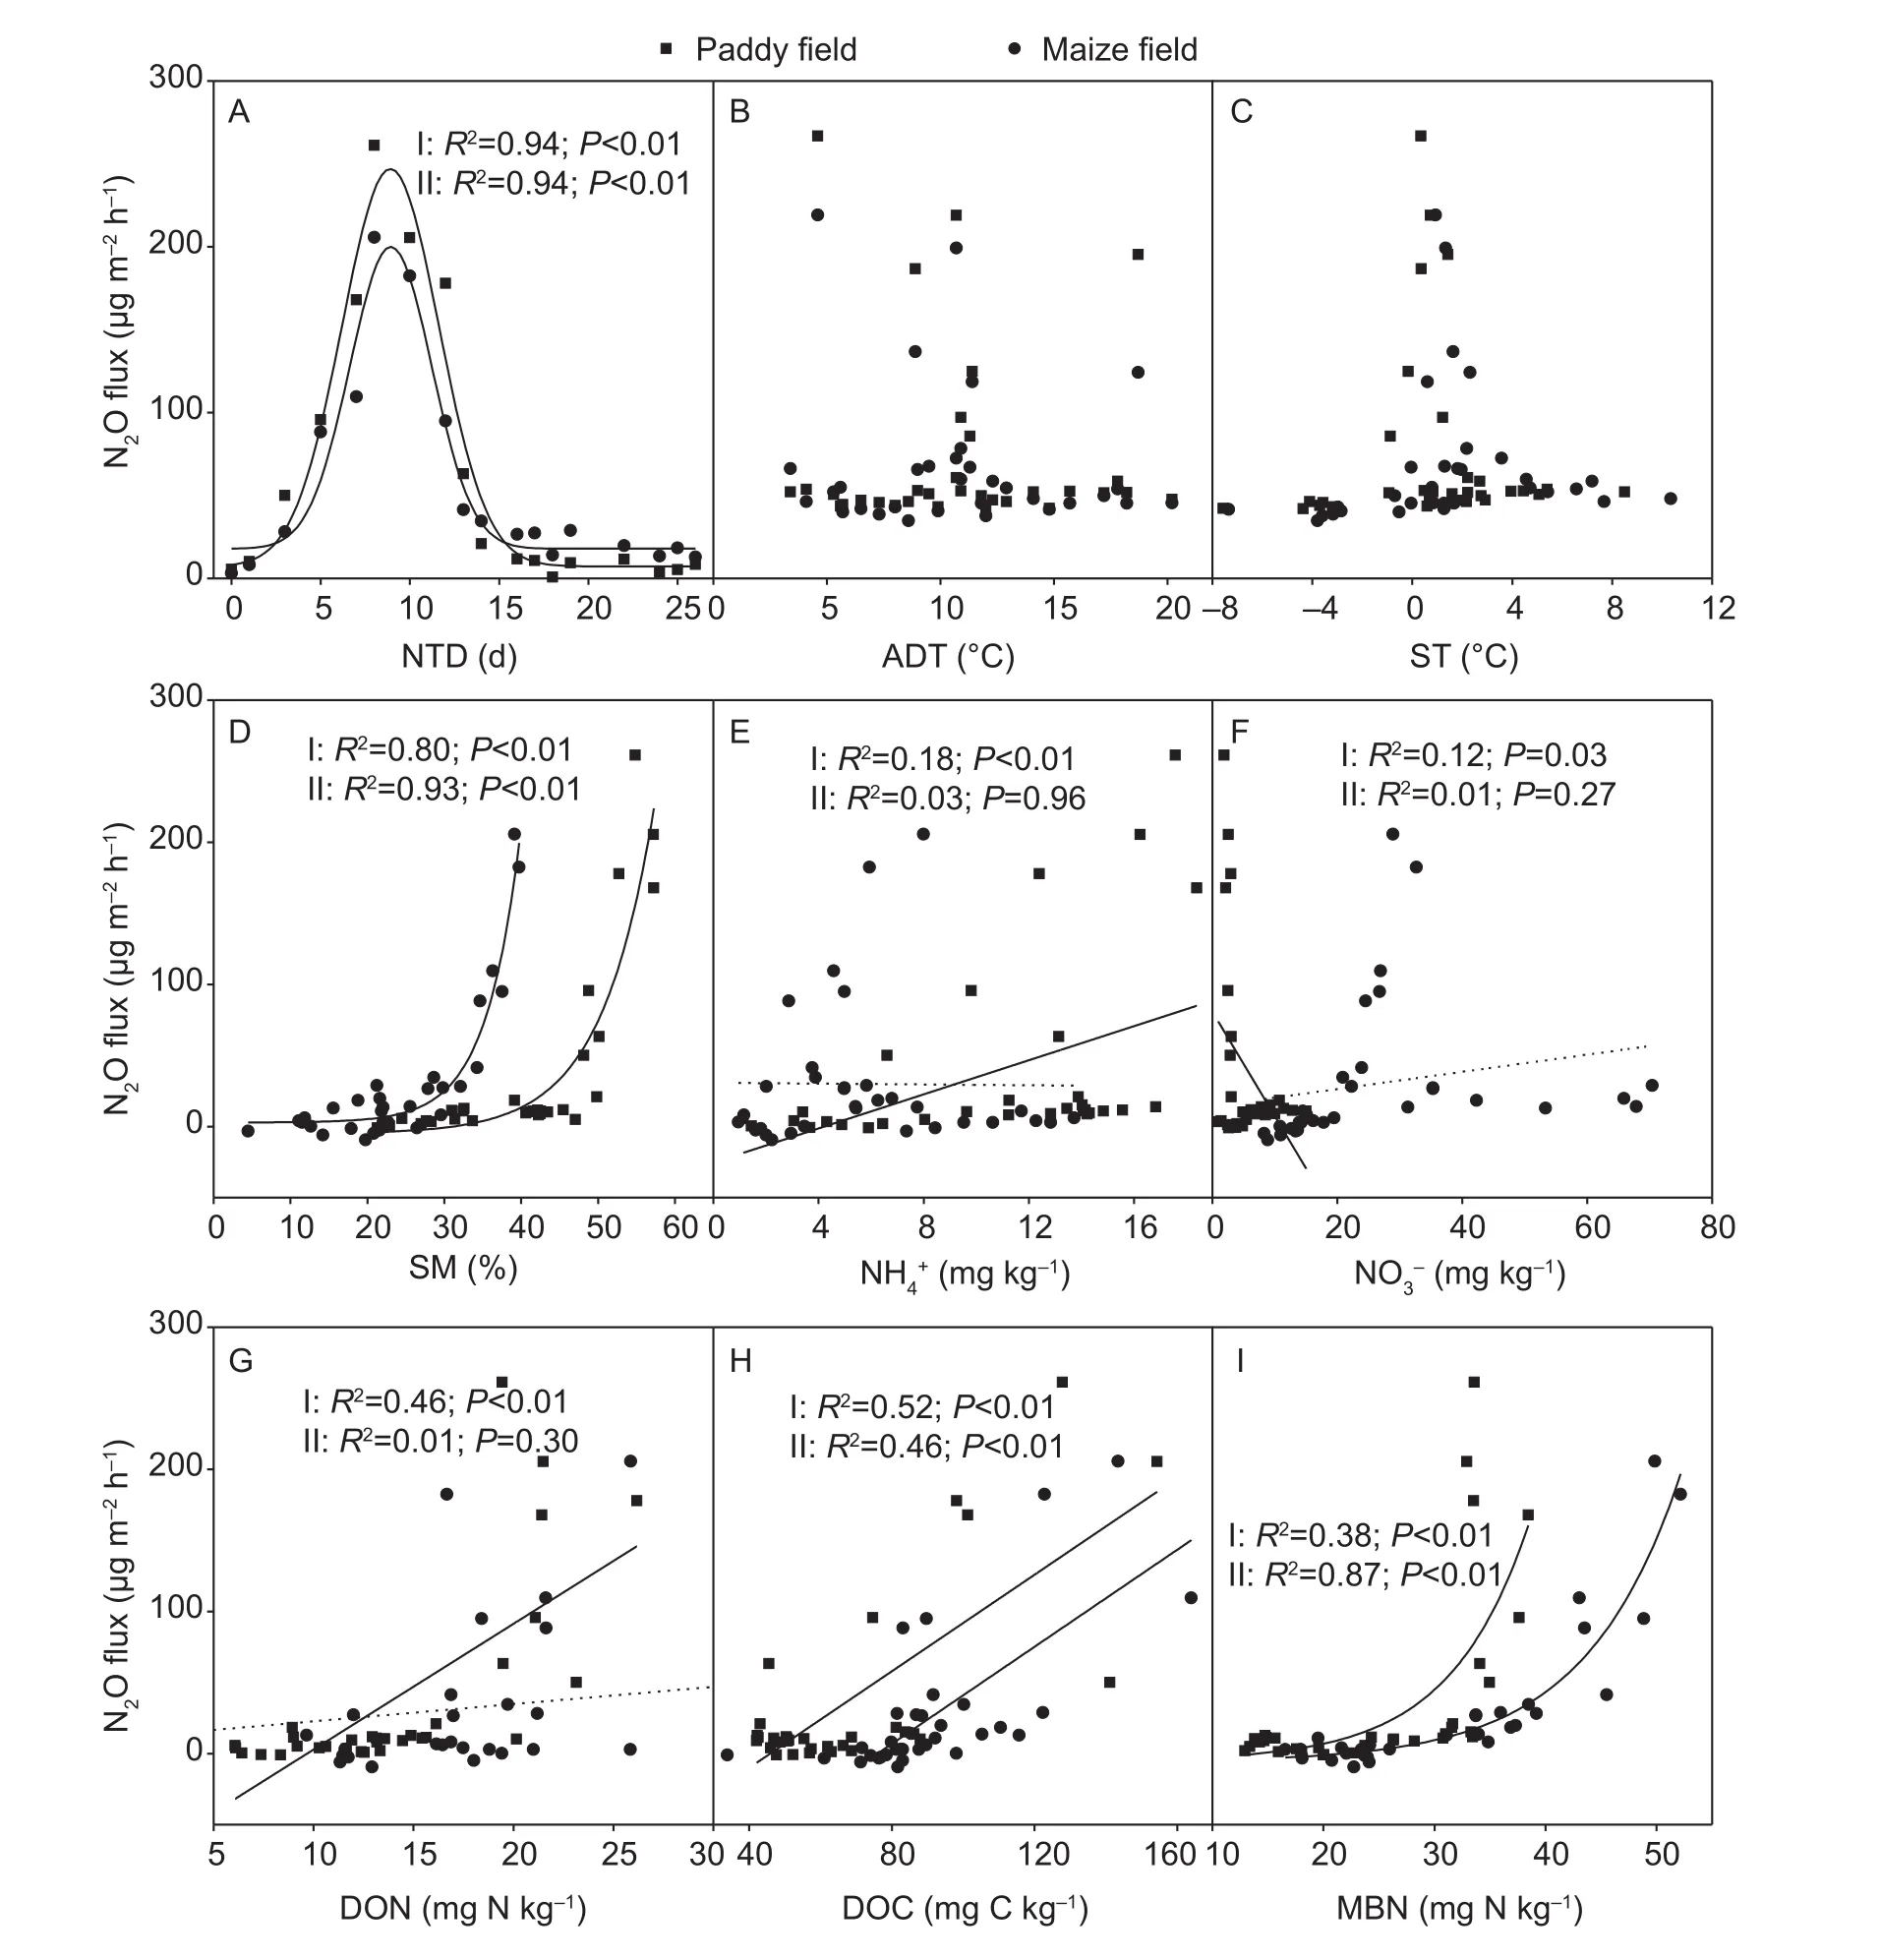
Fig. 5 Relationships between the N2O fluxes and the number of thawing days (NTD) (A), amplitude of daily temperature (ADT)(B), soil temperature (ST) (C), soil moisture (SM) (D), ammonium (NH4+) (E), nitrate (NO3–) (F), dissolved organic nitrogen (DON)(G), dissolved organic carbon (DOC) (H), and microbial biomass nitrogen (MBN) (I) for the paddy (I) and maize (II) fields from October 2014 to May 2015. The solid lines represent a signi ficant correlation between the N2O fluxes and the variables, and the dotted lines represent no signi ficant correlation.
We observed that the soil N2O fluxes increased signi ficantly during spring thawing and the total emissions during this period account for more than 80% of the non-growing season, similar to previous investigations (Kaiser and Heinemeyer 1996; Wagner-Riddle et al. 1997; Kaiser et al.1998; Röver et al. 1998; Papen and Butterbach-Bahl 1999;Teepe et al. 2000; Regina et al. 2004). Brooks et al. (1997)reported that the N2O fluxes just before their sites were snow-free and which were almost eight times more than during late winter. In this study, we further pointed out that the peak period began during snow melting and terminated when the soil was dry, which lasted for approximately 18 days. However, the N2O cumulative emissions from October 2014 to April 2015 were only 0.5 to 0.7 kg N ha–1, which were lower than in prior studies (1 to 19 kg N ha–1) (Wagner-Riddle et al. 1997; Teepe et al. 2000; Regina et al. 2004).The large range of the flux is primarily due to the differences in soil texture and type, climates, agricultural practices and crop systems. For instance, Regina et al. (2004) reported that the emissions of N2O from farmed peat soils in south of Finland were larger than those in the north, because there were no signi ficant thaw periods in the middle of winter in the north and the spring thawing did not induce large N2O emissions. Furthermore, in the southern field, the mean annual fluxes of grass, barley, potato and fallow plots were 7.3, 15, 10 and 25 kg N2O-N ha–1, respectively. Beyond that, the inconsistent measurements may also cause the large range of cumulative N2O emissions between different researches. In this study, the N2O emission peak in spring lasted only 18 days when the gas sampling was performed every two days. If the field measurements were conducted weekly to biweekly as most previous studies (Teepe et al.2000; Regina et al. 2004; Groffman et al. 2006), and using the peak values represents the mean monthly N2O emission rate, were actually exaggerated the cumulative emission on a monthly scale during the thawing period. There have been studies conducted with eddy covariance or other automated measuring system to determine N2O fluxes continuously over winter (Wagner-Riddle et al. 1997; Holst et al. 2008),but due to the cost of the instrument required to use eddy covariance, there is still limited information on N2O fluxes in cold regions and remote locations. Thus, to accurately evaluate the non-growing season N2O emission, more field measurements with dynamic monitoring and multiyear coverage are needed.
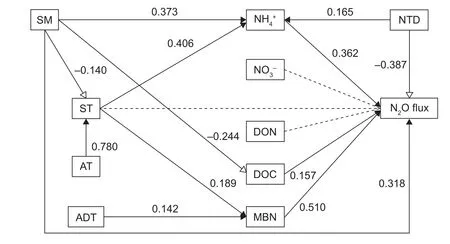
Fig. 6 Structural equation model of the nitrogen, soil, and climate as predictors of the N2O flux during the non-growing season.SM, soil moisture; ST, soil temperature; AT, air temperature; ADT, amplitude of daily temperature; NH4+, ammonium; NO3–, nitrate;DON, dissolved organic nitrogen; DOC, dissolved organic carbon and; MBN, microbial biomass nitrogen; NTD, number of thawing days; N2O, nitrous oxide. The solid black arrows represent positive paths (P<0.05), hollow arrows represent negative paths(P<0.05) and dotted black arrows represent non-signi ficant paths (P<0.05). The numbers beside the arrows are the standardized path coef ficients. The widths of the arrows indicate the strengths of the relationships.
The most of the annual N2O emission of paddy soil was in the non-growing season, but it was only account for 16% in the maize field. This could be attributed to different emissions during the growing season. For instance, the mean flux of the maize field during the growing season was approximately 7-fold than that of the paddy field.Three possible reasons are provided as follows. First,the anoxic soil of the paddy field resulted in a conversion of the majority of the N2O into N2via denitri fication, and the stagnant water prevented N2O from spreading into the atmosphere. Second, an excessive amount of urea fertilizer was added into the maize field during the growing season, which provided suf ficient inorganic nitrogen as a substrate for nitri fication-denitri fication. This was why the N2O emission rate of the maize field on 6 June 2015 increased rapidly after fertilization. On the contrary, irrigation increased the DON, NH4+and NO3–loss in the paddy field via leaching and runoff (Zhang et al. 2012). Third, plough measures in the maize field created favourable conditions for microbial biochemical processes, such as organic matter decomposition, ammoni fication and nitri fication. These processes supply enough substrates that prolonged N2O production. Additionally, another N2O emission peak of the maize field occurred in September 2015, which was likely associated with crop roots that reduced their nitrogen uptake during the terminal growth stage and generated more available nitrogen that could be utilized for N2O production(Schimel and Bennett 2004).
4.2. Factors affecting N2O emissions during non-growing season
For the de novo production theory, an inadequate available nitrogen supply has long been considered to be the bottleneck that limits nitrogen biogeochemical processes in cold regions (Buckeridge et al. 2010). We found that in the two fields the N2O burst were synchronous with the available nitrogen flush during spring thawing. Deluca et al.(1992) and Herrmann and Witter (2002) also reported that the soil net nitrogen mineralization increased two to three times after frozen treatments. In the field, Edwards et al.(2006) and Nielsen et al. (2001) found that the soil NH4+content signi ficantly increased during spring thawing and was maintained at a high level for a longterm too. Freezethaw effects on available nitrogen may be due to: (1) physical forces during the processes of freezing or thawing that fragment soil aggregates, consequently releasing some easily decomposable organic matter (Chai et al. 2014); (2)the rupture of chemical bonds that frees ammonium that is packed in the lattice; and (3) microbial mortality and cell lysis that releases small molecular organic nitrogen (Yanai et al. 2011). Thus, soil thawing is a key ecological process that drives soil nitrogen release and consequently stimulates N2O emission during early spring.
Furthermore, the N2O emission peaks of both sites occurred in the 9th day after the surface layer began thawing, and the rates returned to the pre-levels after the 18th day. The rapidly decline in N2O fluxes were possibly related to the decreased available substrates. Consistent with our measurements, former researches con firmed that available soil nitrogen increased rapidly after one to four freeze-thaw cycles, but not changed or diminished after mult-repeated cycles (Schimel and Clein 1996; Herrmann and Witter 2002; Grogan et al. 2004; Yu et al. 2011). Past syntheses also have suggested that freeze-thaw cycles only in fluence approximately 11–16% of soil nitrogen pool that mostly is labile nitrogen (Herrmann and Witter 2002). In in situ study, we measured that the DON and DOC decreased dramatically after the nutrient flush. This probably attributed to two reasons, the one is that the low soil temperature (<10°C) during thawing period still limited organic matter decomposition, and the other might be the enhanced microbial immobilization after snow melt. The effects of microbial biomass on the soil available N/C pools in the non-growing season can be understood by the microbial metabolism strategy. Although some nutrients are concentrated in the water film around the soil particle in winter, the nutrient flow is blocked in the frozen soils. This will create much relatively N-poor microsites. Thus most microbes exhibited nitrogen-starvation when the soil was frozen in winter. Schimel and Chapin (1996) stated that microbes tend to retain absorbed amino acids and only rarely mineralize N in N limited enough sites (Schimel and Bennett 2004). The opposite dynamic changes between MBN and NH4+and DON during snow covered in both fields also support this theory. In addition, the nitrogen immobilization would further reinforce when the active nitrogen flush during spring thawing (Buckeridge et al. 2010; Zhang et al. 2011).The increased MBN during early spring thaw probably due to the nutrients luxury consumption and this is supported by the increase in DOC, DON and NH4+. But we do not know how much of the soil available nutrients were immobilized in the microbial biomass pool. Moreover, heterotrophic denitri fication has been established as the most predominant sources of N2O emissions from soil ecosystems. Since the available carbon is metabolic energy source for the heterotrophic organisms, thus a certain amount of carbon supply is indispensable for heterotrophic denitri fication. The burst of NH4+and DOC pools together suggested that the soil available nitrogen and carbon co-regulate the N2O emission during early spring. Therefore, the combined effects of the freeze-thaw disturbance, microbial immobilization and soil substrates availability dominated N2O fluxes during spring thawing.
Thus far, most laboratory studies have suggested that denitri fication is the major process of N2O production during freeze-thaw cycles (Mergel et al. 2001; Priemé and Christensen 2001; Müller et al. 2002; Ludwig et al. 2004;Öquist et al. 2004). However the results of the SEM analysis showed that NH4+contents directly explained 36% of the N2O variation during non-growing season, but NO3–contents had no signi ficant effect. This is most likely the NO3–was consumed but NH4+was accumulated during the thawing period (Fig. 3-B and C) because after freeze-thaw events the increased nitri fication could decrease NO3–availability,and a loss occurs if denitri fication increases as a NO3–sink(Papen and Butterbach-Bahl 1999; Nielsen et al. 2001;Edwards et al. 2006). The NO3–pulse in the maize field and trough in the paddy field during thawing period also support this. Because the dry maize field tend to accumulate NO3–via nitri fication, however, the nitrate in waterlogged paddy field is more likely consumed via denitri fication. A study suggested that in winter ammonia oxidizing archaea and ammonia oxidizing bacteria have high tolerance to low temperature (Wang et al. 2012); thus, these two types of microorganisms may contribute to N2O production via nitri fiation-related pathways. What’s more, freeze-thaw cycles can form much of “aerobic”, “anaerobic”, and/or intermediate state microzones (Teepe et al. 2001). These microzones created advantages for both of nitri fication and denitri fication. Tatti et al. (2014) further veri fied that the abundance of nitri fiers and denitri fiers increased in March (later winter) and April (spring thawing). All of these studies implied that nitri fication probably had high potential to promote N2O production during soil freeze-thaw cycle.Besides, during spring thawing, the difference trends of the NH4+and NO3–contents of the two fields suggested that, soil nitrogen cycle were perhaps driven by different N-transform process in paddy and maize fields. In the future, the field study of N2O emissions in the different ecosystems ought to quantify the pathways of regulating N2O production,especially during spring thawing.
Apart from the metabolism substrates limitation, soil water level has been known as a major factor that regulates N2O emissions. We demonstrated that N2O fluxes during the non-growing season have a positive exponential correlation with soil moisture, and it explained 32% of the variation in N2O fluxes. Particularly, the time of the N2O flux peaks of the both fields were exactly the period of the highest soil moisture during both of 2015 and 2016 spring thawing period. Teepe et al. (2004) determined that during soil thawing the N2O emissions increased with an increase in water- filled pore space (WFPS) from 42 to 64%. Wu et al. (2014) observed that the largest N2O emissions were in 50% WFPS, whereas only small or negligible N2O emissions occurred when there was a low water content in the soil. Moreover, Li et al. (2012) speculated that low soil water content (<30%) is one reason for insigni ficant N2O emissions during spring thawing. Field data as well as model simulations also showed that lower water content and anaerobiosis resulted in decreased N2O emissions during spring thawing from steppe in Inner Mongolia (Holst et al.2008; Wolf et al. 2012). In line with this, the spring emission peaks were short at our sites, probably due to the short snow melting and quick soil water evaporation.
Soil temperature has a clear effect on freeze-thaw cycleinduced N2O emission in laboratory experiments (Koponen and Martikainen 2004; Teepe et al. 2004; Koponen et al.2006; Goldberg et al. 2008). However, we did not find any signi ficant associations between N2O fluxes and air temperature, soil temperature or diurnal temperature difference during the non-growing season. This might relate to the differences of microorganisms adaptability to the freeze-thaw environments and temperature change pattern of in situ vs. laboratory. In the field, the soil microorganisms adapt to the slow-changing soil temperature (Schimel et al.2007). And the surface layer temperature usually maintained 0 to –10°C during the winter and spring, which is owing to the snowpacks heat-insulation function and the high thermal capacity of the soil water (after snow melt). Moreover, N2O fluxes in early or mid-winter can be observed in some winter but not in other winter (Chantigny et al. 2017) and we did not observe large N2O emissions when soil began freezing in early winter. Thus, the results of simulation test cannot fully explain the effect of temperature on N2O emissions in situ. Although soil temperature had no direct effect on N2O fluxes during non-growing season as the result of this study,it could enhance N2O emissions via increasing NH4+contents and MBN indirectly. Under the background of global climate change, the effects of soil temperature, which associated with snow cover and freeze-thaw regime, on the soil nitrogen cycle in situ should be a hot issue in the future research.
5. Conclusion
Our results con firmed that the N2O emissions during the non-growing season should not be neglected, and there really existed a signi ficant seasonal variability in the N2O fluxes between paddy and maize fields in Northeast China.Additionally, the soil available substrates flush and high soil moisture were simultaneously with vigorous N2O emission during the spring thawing. The large available nitrogen and carbon provided heterotrophic microbes with adequate newly substrates and the snow melt created much favourable microzone for nitri fication-denitri fication. Besides, the dynamics of nitrogen immobilization in winter and microbial biomass recovery in spring were also important biotic factors that driving soil nitrogen transformation during nongrowing season. Under global climate change, the effects of freeze-thaw events and snow cover variation on soil nitrogen biogeochemical processes are worthy of the further study, and precise measurements of N2O emissions during spring thawing are essential to assess the N2O-N budget and greenhouse effect in seasonally frozen ecosystems.
Acknowledgements
This study was supported by the National Science and Technology Major Project of China (2014ZX07201-009).The authors thank Prof. Liang Weili (Hebei Agricultural University, China), Dr. Qiao Chunlian (Institute of Botany,Chinese Academy of Sciences), Dr. Du Yangong (Northwest Institute of Plateau Biology, Chinese Academy of Sciences),Dr. Wang Guangshuai (Farmland Irrigation Research Institute, Chinese Academy of Agricultural Sciences), Dr.Ge Shidong (Peking University, China) and Dr. Ren Fei(Qinghai University, China) for helpful suggestions on earlier versions of this manuscript.
Bracho R, Natali S, Pegoraro E, Crummer K G, Schädel C,Celis G, Hale L, Wu L, Yin H, Tiedje J M, Konstantinidis K T, Luo Y, Zhou J, Schuur E A G. 2016. Temperature sensitivity of organic matter decomposition of permafrostregion soils during laboratory incubations. Soil Biology &Biochemistry,97, 1–14.
Brooks P D, Schmidt S K, Williams M W. 1997. Winter production of CO2and N2O from Alpine tundra: Environmental controls and relationship to inter-system C and N fluxes. Oecologia,110, 403–413.
Buckeridge K M, Cen Y P, Layzell D B, Grogan P. 2010. Soil biogeochemistry during the early spring in low arctic mesic tundra and the impacts of deepened snow and enhanced nitrogen availability. Biogeochemistry,99, 127–141.
Chai Y J, Zeng X B, E S Z, Bai L Y, Su S M, Huang T. 2014.Effects of freeze-thaw on aggregate stability and the organic carbon and nitrogen enrichment ratios in aggregate fractions. Soil Use & Management,30, 507–516.
Chantigny M H, Rochette P, Angers D A, Goyer C, Brin L D, Bertrand N. 2017. Non-growing season N2O and CO2emissions - Temporal dynamics and in fluence of soil texture and fall-applied manure. Canadian Journal of Soil Science,97, 452–464.
Clein J S, Schimel J P. 1995. Microbial activity of tundra and taiga soils at sub-zero temperatures. Soil Biology &Biochemistry,27, 1231–1234.
CRGCST (Cooperative Research Group on Chinese Soil Taxanomy). 2001. Chinese Soil Taxonomy. Science Press,Beijing and New York.
Deluca T H, Keeney D R, Mccarty G W. 1992. Effect of freezethaw events on mineralization of soil nitrogen. Biology &Fertility of Soils,14, 116–120.
Dörsch P, Palojärvi A, Mommertz S. 2004. Overwinter greenhouse gas fluxes in two contrasting agricultural habitats. Nutrient Cycling in Agroecosystems,70, 117–133.
Edwards K A, Mcculloch J, Kershaw G P, Jefferies R L. 2006.Soil microbial and nutrient dynamics in a wet Arctic sedge meadow in late winter and early spring. Soil Biology &Biochemistry,38, 2843–2851.
Ehrlich R, Larousse A, Jacquet M A, Marin M, Reiss C. 1985.Chloroform fumigation and the release of soil nitrogen: A rapid direct extraction method to measure microbial biomass nitrogen in soil. Soil Biology & Biochemistry,17, 837–842.
Elberling B, Michelsen A, Schädel C, Schuur E A G, Christiansen H H, Berg L, Tamstorf M P, Sigsgaard C. 2013. Long-term CO2production following permafrost thaw. Nature Climate Change,3, 890–894.
Freppaz M, Williams B L, Edwards A C, Scalenghe R, Zanini E. 2007. Simulating soil freeze/thaw cycles typical of winter alpine conditions: Implications for N and P availability.Applied Soil Ecology,35, 247–255.
Gaëlle S, Christoph M, Jean-Pierre D, Martine R. 2011.Seasonal trends and temperature dependence of the snowfall/precipitation-day ratio in Switzerland. Geophysical Research Letters,38, 128–136.
Goldberg S D, Muhr J, Borken W, Gebauer G. 2008. Fluxes of climate-relevant trace gases between a Norway spruce forest soil and atmosphere during repeated freeze-thaw cycles in mesocosms. Journal of Plant Nutrition & Soil Science,171, 729–739.
Goodroad L L, Keeney D R. 1984. Nitrous oxide emissions from soils during thawing. Canadian Journal of Soil Science,64, 187–194.
Groffman P M, Hardy J P, Driscoll C T, Fahey T J. 2006. Snow depth, soil freezing, and fluxes of carbon dioxide, nitrous oxide and methane in a northern hardwood forest. Global Change Biology,12, 1748–1760.
Grogan P, Michelsen A, Ambus P, Jonasson S. 2004. Freezethaw regime effects on carbon and nitrogen dynamics in sub-arctic heath tundra mesocosms. Soil Biology &Biochemistry,36, 641–654.
Henry H A L. 2007. Soil freeze-thaw cycle experiments: Trends,methodological weaknesses and suggested improvements.Soil Biology & Biochemistry,39, 977–986.
Henry H A L. 2008. Climate change and soil freezing dynamics:Historical trends and projected changes. Climatic Change,87, 421–434.
Herrmann A, Witter E. 2002. Sources of C and N contributing to the flush in mineralization upon freeze-thaw cycles in soils.Soil Biology & Biochemistry,34, 1495–1505.
Holst J, Liu C, Yao Z, Brüggemann N, Zheng X, Giese M,Butterbach-Bahl K. 2008. Fluxes of nitrous oxide, methane and carbon dioxide during freezing-thawing cycles in an Inner Mongolian steppe. Plant & Soil,308, 105–117.
IPCC. 2013. Climate Change 2013: The Physical Science Basis.Contribution of Working Group I to the Fifth Assessment Report of the Intergovernmental Panel on Climate Change.Cambridge University Press, Cambridge, United Kingdom and New York, NY, USA. p. 1535.
Ju X. 2014. Direct pathway of nitrate produced from surplus nitrogen inputs to the hydrosphere. Proceedings of the National Academy of Sciences of the United States of America,111, E416.
Ju X. 2015. Improvement and validation of theoretical N rate (TNR) - Discussing the methods for N fertilizer recommendation. Acta Pedologica Sinica,52, 249–261.(in Chinese)
Kaiser E A, Heinemeyer O. 1996. Temporal changes in N2O losses from two arable soils. Plant & Soil,181, 57–63.
Kaiser E A, Kohrs K, Kücke M, Schnug E, Heinemeyer O,Munch J C. 1998. Nitrous oxide release from arable soil:Importance of N-fertilization, crops and temporal variation.Soil Biology & Biochemistry,30, 1553–1563.
Koponen H T, Duran C E, Maljanen M, Hytönen J, Martikainen P J. 2006. Temperature responses of NO and N2O emissions from boreal organic soil. Soil Biology & Biochemistry,38,1779–1787.
Koponen H T, Martikainen P J. 2004. Soil water content and freezing temperature affect freeze-thaw related N2O production in organic soil. Nutrient Cycling in Agroecosystems,69, 213–219.
Kumar N, Grogan P, Chu H, Christiansen C T, Walker V K.2013. The effect of freeze-thaw conditions on arctic soil bacterial communities. Biology,2, 356–377.
Li K, Gong Y, Song W, Lv J, Chang Y, Hu Y, Tian C, Christie P,Liu X. 2012. No signi ficant nitrous oxide emissions during spring thaw under grazing and nitrogen addition in an alpine grassland. Global Change Biology,18, 2546–2554.
Liptzin D, Williams M W, Helmig D, Filippa G, Chowanski K,Hueber J. 2009. Process-level controls on CO2fluxes from a seasonally snow-covered subalpine meadow soil, Niwot Ridge, Colorado. Biogeochemistry,95, 151–166.
Liu J, Ulén B, Bergkvist G, Aronsson H. 2014. Freezing-thawing effects on phosphorus leaching from catch crops. Nutrient Cycling in Agroecosystems,99, 17–30.
Ludwig B, Wolf I, Teepe R. 2004. Contribution of nitri fication and denitri fication to the emission of N2O in a freeze-thaw event in an agricultural soil. Journal of Plant Nutrition and Soil Science,167, 678–684.
Maljanen M, Kohonen A R, Virkajärvi P, Martikainen P J. 2007.Fluxes and production of N2O, CO2, and CH4in boreal agricultural soil during winter as affected by snow cover.Tellus (Series B: Chemical & Physical Meteorology),59,853–859.
Matzner E, Borken W. 2008. Do freeze-thaw events enhance C and N losses from soils of different ecosystems? A review.European Journal of Soil Science,59, 274–284.
Mergel A, Schmitz O, Mallmann T, Bothe H. 2001. Relative abundance of denitrifying and dinitrogen- fixing bacteria in layers of a forest soil. FEMS Microbiology Ecology,36,33–42.
Mosier A, Schimel D, Valentine D, Bronson K, Parton W. 1991.Methane and nitrous oxide fluxes in native, fertilized and cultivated grasslands. Nature,350, 330–332.
Müller C, Martin M, Stevens R J, Laughlin R J, Kammann C,Ottow J C G, Jäger H J. 2002. Processes leading to N2O emissions in grassland soil during freezing and thawing.Soil Biology & Biochemistry,34, 1325–1331.
Nielsen C B, Groffman P M, Hamburg S P, Driscoll C T, Fahey T J, Hardy J P. 2001. Freezing effects on carbon and nitrogen cycling in northern hardwood forest soils. Soil Science Society of America Journal,65, 1723–1730.
Nyborg M, Laidlaw J W, Solberg E D, Malhi S S. 1997.Denitri fication and nitrous oxide emissions from a black chernozemic soil during spring thaw in alberta. Canadian Journal of Soil Science,77, 153–160.
Öquist M G, Mats N, Fred S R, Asa K K, Tryggve P, Per W,Leif K. 2004. Nitrous oxide production in a forest soil at low temperatures-processes and environmental controls. FEMS Microbiology Ecology,49, 371–378.
Papen H, Butterbach-Bahl K. 1999. A 3-year continuous record of nitrogen trace gas fluxes from untreated and limed soil of a N-saturated spruce and beech forest ecosystem in Germany: 1. N2O emissions. Journal of Geophysical Research (Atmospheres),104, 18487–18503.
Priemé A, Christensen S. 2001. Natural perturbations, dryingwetting and freezing-thawing cycles, and the emission of nitrous oxide, carbon dioxide and methane from farmed organic soils. Soil Biology & Biochemistry,33, 2083–2091.
Regina K, Syvasalo E, Hannukkala A, Esala M. 2004. Fluxes of N2O from peat soils in Finland. European Journal of Soil Science,55, 591–599.
Risk N, Snider D, Wagner-Riddle C. 2013. Mechanisms leading to enhanced soil nitrous oxide fluxes induced by freeze-thaw cycles. Canadian Journal of Soil Science,93, 401–414.
Röver M, Heinemeyer O, Kaiser E A. 1998. Microbial induced nitrous oxide emissions from an arable soil during winter.Soil Biology & Biochemistry,30, 1859–1865.
Schimel J P, Balser T C, Matthew W. 2007. Microbial stressresponse physiology and its implications for ecosystem function. Ecology,88, 1386–1394.
Schimel J P, Bennett J. 2004. Nitrogen mineralization:Challenges of a changing paradigm. Ecology,85, 591–602.
Schimel J P, Chapin F S. 1996. Tundra plant uptake of amino acid and NH4+nitrogen in situ: Plants complete well for amino acid N. Ecology,77, 2142–2147.
Schimel J P, Clein J S. 1996. Microbial response to freeze-thaw cycles in tundra and taiga soils. Soil Biology & Biochemistry,28, 1061–1066.
Schuur E A G, Abbott B. 2011. Climate change: High risk of permafrost thaw. Nature,480, 32–33.
Schuur E A G, Mcguire A D, Schädel C, Grosse G, Harden J W, Hayes D J, Hugelius G, Koven C D, Kuhry P, Lawrence D M, Natali S M, Olefeldt D, Romanovsky V E, Schaefer K,Turetsky M R, Treat C C, Vonk J E. 2015. Climate change and the permafrost carbon feedback. Nature,520, 171–179.
Song C, Zhang J, Wang Y, Wang Y, Zhao Z. 2008. Emission of CO2, CH4, and N2O from freshwater marsh in northeast of China. Journal of Environmental Management,88,428–436.
Song W, Wang H, Wang G, Chen L, Jin Z, Zhuang Q, He J.2015. Methane emissions from an alpine wetland on the Tibetan Plateau: Neglected but vital contribution of the nongrowing season. Journal of Geophysical Research(Biogeosciences),120, 1450–1490.
Syväsalo E, Regina K, Pihlatie M. 2004. Emissions of nitrous oxide from boreal agricultural clay and loamy sand soils.Nutrient Cycling in Agroecosystems,69, 155–165.
Tatti E, Goyer C, Chantigny M, Wertz S, Zebarth B J, Burton D L, Filion M. 2014. In fluences of over winter conditions on denitri fication and nitrous oxide-producing microorganism abundance and structure in an agricultural soil amended with different nitrogen sources. Agriculture Ecosystems &Environment,183, 47–59.
Teepe R, Brumme R, Beese F. 2000. Nitrous oxide emissions from frozen soils under agricultural, fallow and forest land.Soil Biology & Biochemistry,32, 1807–1810.
Teepe R, Brumme R, Beese F. 2001. Nitrous oxide emissions from soil during freezing and thawing periods. Soil Biology& Biochemistry,33, 1269–1275.
Teepe R, Vor A, Beese F, Ludwig B. 2004. Emissions of N2O from soils during cycles of freezing and thawing and the effects of soil water, texture and duration of freezing.European Journal of Soil Science,55, 357–365.
Wagner-Riddle C, Hu Q C, van Bochove E, Jayasundara S.2008. Linking nitrous oxide flux during spring thaw to nitrate denitri fication in the soil pro file. Soil Science Society of America Journal,72, 908–916.
Wagner-Riddle C, Thurtell G W, Kidd G K, Beauchamp E G,Sweetman R. 1997. Estimates of nitrous oxide emissions from agricultural fields over 28 months. Canadian Journal of Soil Science,77, 135–144.
Wang A, Wu F Z, Yang W Q, Wu Z C, Wang X X, Tan B. 2012.Abundance and composition dynamics of soil ammoniaoxidizing archaea in an alpine fir forest on the eastern Tibetan Plateau of China. Canadian Journal of Microbiology,58, 572–580.
Wipf S, Sommerkorn M, Stutter M I, Wubs E R J, René V D W. 2015. Snow cover, freeze-thaw, and the retention of nutrients in an oceanic mountain ecosystem. Ecosphere,6, 1–16.
Wolf B, Kiese R, Chen W, Grote R, Zheng X, Butterbach-Bahl K. 2012. Modeling N2O emissions from steppe in Inner Mongolia, China, with consideration of spring thaw and grazing intensity. Plant & Soil,350, 297–310.
Wu J, Joergensen R G, Pommerening B, Chaussod R, Brookes P C. 1990. Measurement of soil microbial biomass C by fumigation-extraction - An automated procedure. Soil Biology & Biochemistry,22, 1167–1169.
Wu X, Brüggemann N, Butterbach-Bahl K, Fu B, Liu G. 2014.Snow cover and soil moisture controls of freeze-thawrelated soil gas fluxes from a typical semi-arid grassland soil: A laboratory experiment. Biology & Fertility of Soils,50, 295–306.
Xing B, Liu X, Liu J, Han X. 2005. Physical and chemical characteristics of a typical mollisol in China. Communications in Soil Science & Plant Analysis,35, 1829–1838.
Yanai Y, Toyota K, Okazaki M. 2011. Effects of successive soil freeze-thaw cycles on soil microbial biomass and organic matter decomposition potential of soils. Soil Science & Plant Nutrition,50, 821–829.
Yang Q, Xu M, Chi Y, Zheng Y, Shen R, Wang S. 2014.Effects of freeze damage on litter production, quality and decomposition in a loblolly pine forest in central China. Plant& Soil,374, 449–458.
Yu X, Zou Y, Ming J, Lu X, Wang G. 2011. Response of soil constituents to freeze-thaw cycles in wetland soil solution.Soil Biology & Biochemistry,43, 1308–1320.
Zhang Q, Yang Z, Zhang H, Yi J. 2012. Recovery ef ficiency and loss of15N-labelled urea in a rice-soil system in the upper reaches of the Yellow River basin. Agriculture Ecosystems& Environment,158, 118–126.
Zhang T, Barry R G, Armstrong R L. 2004. Application of satellite remote sensing techniques to frozen ground studies. Polar Geography,28, 163–196.
Zhang X, Bai W, Gilliam F S, Wang Q, Han X, Li L. 2011. Effects of in situ freezing on soil net nitrogen mineralization and net nitri fication in fertilized grassland of northern China. Grass& Forage Science,66, 391–401.
30 March, 2017 Accepted 18 July, 2017
CHEN Zhe, Mobile: +86-13099770565, E-mail: chenzhe 80122@163.com; Correspondence YANG Zheng-li, Tel: +86-10-82108989, E-mail: yangzhengli@caas.cn
© 2018 CAAS. Publishing services by Elsevier B.V. All rights reserved.
10.1016/S2095-3119(17)61738-6
Section editor ZHANG Wei-li
Managing editor SUN Lu-juan
 Journal of Integrative Agriculture2018年1期
- Journal of Integrative Agriculture的其它文章
- Climate change and agriculture: Impacts and adaptive responses in Iran
- Development of elite restoring lines by integrating blast resistance and low amylose content using MAS
- Evaluation of stability and yield potential of upland rice genotypes in North and Northeast Thailand
- ldenti fication of the resistance gene to powdery mildew in Chinese wheat landrace Baiyouyantiao
- New clues concerning pigment biosynthesis in green colored fiber provided by proteomics-based analysis
- Constitutive expression of feedback-insensitive cystathionine γ-synthase increases methionine levels in soybean leaves and seeds