
新型城市设计?香港极端城市布局的启示
2018-03-05 02:03作者AlainChiaradiaalainjfchkuhk
世界建筑导报 2018年1期
作者:Alain Chiaradia (alainjfc@hku.hk)
张灵珠 (zhanglz@hku.hk)
Authors: Alain Chiaradia (alainjfc@hku.hk)
Lingzhu Zhang (zhanglz@hku.hk)
Institution of the Authors: Department of Urban Planning and Design,Faculty of Architecture, The University of Hong Kong
新型拥挤
中国各主要城市正积极新建和扩张地铁系统,改善交通可持续性,减少快速机动化对环境和社会造成的负面影响。在中国,33个城市设有地铁线网,另有16个城市的地铁系统在建,还有不少城市的地铁线路正处于规划和提议修建阶段。随着越来越多的人选择地铁作为日常出行的工具,以往只存在地铁车厢内的拥挤问题,现已普遍存在于很多地铁站厅和连接车站的通道内。
这一新型的拥挤现象并非中国特有。该现象同样存在于纽约、伦敦、巴黎等多个城市。这是城市设计还未准备好应对的新型城市状况。大多数城市设计理论侧重于增加城市活力,以及增加行人活动。而有关相反现象—活力过旺—的城市设计文献和项目则少之又少。然而,鉴于拥挤已成为感性和客观存在的现象,我们认为城市设计可以在理解如何配置逐步多样化的城市拥挤方面发挥重要作用。
有组织或逐步的分散如何成为一种行之有效的城市设计策略?
这里所说的并非是人群管理—即重大事件举行时对人的运动和行为的管理,这个有专门的技术和文献。某项事件的举行对某时某地造成的拥挤相对有限,而场所的拥挤或多或少具有时空连续性。拥挤导致人开始避开人群密集和人流量过大的场所。设计渐进式活力是让活力在限定的水平范围内增长和扩张。设计渐进式活力需要理解某个地方什么时间以及为什么会受到过度的人流强度和活力的压力。
取经香港?
香港是一个极端配置的城市,是极端地形、气候、体制、发展历史和城市创新的独特混合。受陡峭地形和水域的影响,香港只有20%的土地坡度低于1:5。就是在这复杂的地形条件上,建成了一个超高密度城市,有着极其成功的以公交为导向的开发(TOD)体系,水域、绿墙般的山体、超高密度、轨道交通和道路基础设施形成了香港独特绚丽的城市景观。
香港是世界上拥有最复杂的TOD系统的城市之一。其公共交通系统屡获赞誉,公交通勤占总通勤的90%被反复提及,这几乎是其他城市无法企及的铂金版的可持续交
通标准。但香港仍是一拥挤的城市,地铁车厢内、地铁站和地铁站周边的建筑综合体内高度拥挤。有时,许多街道上甚至都会出现拥挤。香港又有哪些关于拥挤、城市形态和城市设计方面的经验可供我们借鉴呢?
这是否意味着香港能够成为我们学习的范例?了解超级拥挤是如何形成的,对我们设计缓解措施会起到怎样的帮助?人们常常会说“香港土地稀缺”,准确的说法应当是“香港平坦和适宜建筑的土地十分稀缺”。因此,香港模型较适用位于低山丘陵地区的城市,而由于多数大城市地势较为平坦,香港的空间解决方案可能并不适用。
这是否意味着香港能够成为我们学习的范例?了解超级拥挤是如何形成的,对我们设计缓解措施会起到怎样的帮助?人们常常会说“香港土地稀缺”,准确的说法应当是“香港平坦和适宜建设的土地十分稀缺”。因此,香港模型较适用于山地城市,而由于多数大城市地势较为平坦,香港的空间解决方案可能并不适用。
尽管如此,我们可通过从不同方面分析香港如何应对空间局限性,深入了解拥挤现象及其与城市形态的关系,和如何管理拥挤,从中获得启示。在本文中,我们主要概述香港极端布局的特点,如果我们了解极端布局与拥挤的关系,我们或许能够知道如何设计“多样化”或“渐进式”的拥挤,从而可能得出一种转移式的缓解城市拥挤的方法。本文下面部分通过对香港拥挤状况和城市布局关系的反思和分析探讨了城市拥挤在不同尺度层面的一些经验教训。有关分析中使用的工具和方法的讨论亦列于下文。
启发1:紧凑并非造成拥挤的前提条件
为弄清紧凑是否是造成拥挤的前提条件,我们在深入观察局部前,首先观察香港的整体城市形态,包括地铁和公交线路网、绿色空间的构成、分布和布局,希望弄清上述因素与拥挤的关系。
在城市形态的讨论中,针对紧凑和蔓延的问题尤其突出,犹如完全对立的两个方面。在探讨这个问题的时候,不妨让我们先问个问题,“香港是紧凑型城市吗?”如果从地域范围来看,答案是否定的。香港是个垂直发展的城市,人均占用土地极少;香港虽然是极高密度的城市,但这并不意味着它就是紧凑型的城市。当然,香港也并非典型的蔓延型城市。虽然对城市蔓延并无明确定义,但它通常至少具备三个特点:低密度、分散式的非连续性分布和依赖私家车出行。


紧凑型指密集、紧凑,与分散和非连续性截然相反。我们会直观地将圆形或方形视作紧凑型。如果我们希望通过量化指标评估,我们可以用景观研究的形状指数。圆形的紧凑指数为1,方形的紧凑指数为1.27(图01-形状指数)。仔细观察香港的城市形态,不难发现由地铁线路和严谨设计的公路基础设施连接起来的带状发展态势。香港的形状指数为83,远达不到紧凑型城市形态的标准(图02)。除九龙的极少数地区外,香港的城市形态不具备紧凑型城市的特点。从整体来看,香港的城市形态是多条独立条带状发展形成的组合,这些条带由陡峭的山体或山体与河流分隔而成。香港的密度剖面图,即从城市中心向外的(居住+就业)密度横截面与大多数城市不同,大多数城市的市中心更为稠密,由中心向外或多或少呈逐渐递减趋势。对于香港而言,其密度分布呈骤升骤降的趋势,密度为“零”处是水域或城市公园。香港的城市密度呈现高度的峰值化特点,但波峰的数量却大大减少了。
香港的例子表明,从“城市化连续性”的意义上说,整体城市形态的紧凑并非造成拥挤的前提条件。实际上,紧凑型城市布局可能会缓解拥挤。
启发2:大型城市公园式的布局可能是造成拥挤的推动因素
如果香港不属于紧凑型城市,那么地铁和公路连接的高密度条带区之间的区域又被作何使用?这些区域包括丘陵林地、灌木丛和草地,约占香港地域面积的65%。因而,香港可谓是一个处在山地公园之中的高密度城市。在多数其他城市,这些区域将是平坦的土地,大多用作城市建设区,其间点缀着绿地和公园。香港却与之相反。不少城市自诩拥有大片公园/绿地,但未提及这些绿地大多分布在建成区外围。从城市密度最高的部分来看,这些绿地的可达性或可视性并不好:它们与香港不同,香港有着城市建成区嵌套于陡峭的大型公园之间的独特布局。
郊野公园的面积通常较大。这意味着每位香港居民都靠近一处大型公园。这毫无疑问是个优势。因此,公园的组成、分布和布局可能是造成拥挤的一项推动因素。如果我们将视点拉高,观察珠三角地区的卫星视图,香港和中山市的山地是珠江入海口标志性的面积巨大的两块绿地。郊野公园不仅是香港的宝贵资源,也是整个珠三角地区的宝贵资源。
启示3:地铁线网的形态造成了拥挤
将TOD定义为围绕高品质轨道系统创建紧凑、宜步、行人为主、功能混合的社区,本身会造成超高密度峰值。现在让我们将目光移至港铁线网系统的整体布局,其形态与拥挤有关吗?
让我们从一件趣闻开始说起。据一份有趣的报告指出,港铁在设计时计划每平方米车厢容纳6位乘客,但最近乘客不愿意搭乘拥挤的地铁,而愿意等候下一趟地铁。由此导致运营中的地铁每平方米车厢仅乘坐了4位乘客。有人指出,这可能是因为乘客需要多余的空间使用移动通讯设备。移动设备同样改变了人们对交通出行的认识—出行途中的时间不再是静寂的时间,而是富有成效的时间、应该是舒适的。这其实将简单的效率问题复杂化,即出行速度越快,出行者的感受越佳。当你沉浸于移动设备之中,你会发现自己的目的地到的太快了……而你最终将和你的移动设备结伴,并根据旅程的长短做好计划安排。

有多种方式可以减轻地铁车厢内的拥挤,例如增加车厢数,增加人流密集站点的发车频率,优化乘客位置分布等等。然而,车厢内拥挤虽得到缓解,但站厅内拥挤将会加剧。调价是减轻拥挤的另一种方式,但这与可持续交通使用的宗旨相违背。鼓励错峰出行是另一项策略。部分地铁线路在非高峰时段提供免费或高折扣票价。伦敦市已尝试多项奖励措施,如注明在哪些站点之间步行快过搭乘地铁,鼓励市民选择步行方式,以期减少地铁拥挤现象。
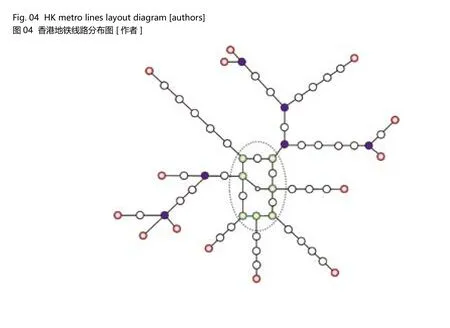
尽管这些措施可提升地铁系统的效率,但并未改变地铁线路的布局,只能算是隔靴搔痒。网络科学表明,地铁线网布局的整体结构对线网各部分的使用量分布有着重大影响,进而会影响车厢和站厅内的拥挤情况。将香港与其他大多数城市的地铁线路布局图进行比较,不难发现香港的地铁线网形态十分独特。对于大部分城市的地铁系统(图03)而言,网络的中间是一个相对较大的环形结构,将多个站点围绕其中形成一个突出的核心。网络的支线从这一环形结构向外辐射,延伸至城市的边缘地区。支线长短不一,可分为短支和长支。对于港铁(图04)而言,支线是最突出的组成部分,线路距离长,延伸范围远。港铁线网中的核心换乘站点并不多。相反,只有少数站点可称作“核心站点”,包括:中环-香港站、金钟站和尖沙咀-九龙站。然而,几乎所有的支线均以平行的方式穿过旺角—旺角东—奥运区,在它们最终汇合到那几个“核心站点”之前未发生任何交汇,以致该区成为高度拥堵和人群过度密集的垂直发展区。我们现在介绍第一个工具sDNA[3],以便了解地铁线网形态和拥挤之间的关系:模拟地铁线网客流量。
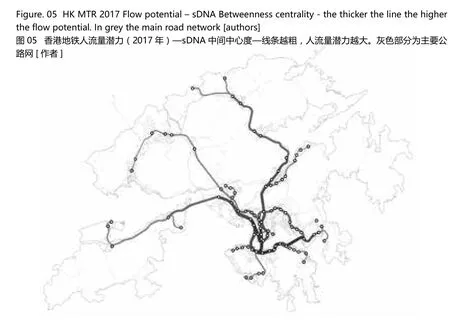
图05是网络学模拟出的人流量潜力—线条越粗,表明客流量越大。网络学的实证研究[5]已表明这些模拟与实际客流量密切相关,表明地铁线网布局对客流量乃至车厢内和站厅内拥挤的影响。图05显示了巨量的地铁客流在中环、九龙和港岛东部的分布情况。从直观上看,如果多条很长的轴向线路在同一个地区汇集,那么在汇集地区很可能形成拥挤。
香港地铁的布局决定了支线之间的换乘必须经过网络系统的中心区,这无疑增加了出行距离,并且为中心区带来了不必要的客流量—环线和环状放射线的网络布局将会缩减经过中心区的多余行程,增加外围线路可达性的同时缩短总体出行时间。
例如,新加坡规划的地铁延伸线,将采用主要环线搭配多个远距离环线的结构,网络中不存在孤立的尽端线路。尽管新加坡的地形不同于香港,但新加坡对于地铁网络布局的某些认识也许值得香港仔细研读。巴黎的“大巴黎快线”项目目前也正在考虑转变地铁网络的布局。
在香港,由于当前地铁系统充足的乘坐量和成熟性,鲜有人提出大胆的城市规划、交通规划和城市设计方面的构想及其可能为香港带来的变化。或许深港两地地铁系统的对接,会带来新的转变;但由于未来对接的可能性较小,会带来何种程度的转变尚未可知。
“通过线网形态管理拥挤”作为战略性的城市设计
回到地面,蜂拥于街道之中的绿色和红色小巴以及大型双层巴士在香港的城市出行中发挥着重要的作用。图06与图05相似,模拟港铁、电车、轮渡和公交的客流量。观察该图,不难发现地铁和公交线网的布局是如何引发人流集聚的。
尽管聚集有利于促进社会互动,形成城市优势。正如我们此前所说,就香港而言,问题在于何种密度分布和布局会使聚集的缺点例如拥挤显现。解决拥挤问题需要新的方法并进行相关研究。仅就上述讨论而言,相关研究需要回答的问题包括:“地铁和公交系统是否过于集中?”以及“地铁和公交提供的可达性是否过于集中?”
从通过设立城市副中心,消除城市聚集产生的负面外部效应(拥堵、污染、拥挤和地价过高),改善经济表现,将香港打造成多中心城市的角度来看,多数新市镇未能实现合理的的职住平衡,令香港规划界人士时常叹息。建立新的城市副中心是一项解决之策,与之相关的另一项策略是城市副中心之间的相互连接,使之在功能上自成一体,独立于主中心之外。这对香港作为服务型、知识型的经济体或分散式、清洁型的制造业经济体而言尤为重要。
何种地铁线网布局有助于成功创建多中心城市?
TOD城市设计项目应当了解公交网络流量中至关重要的轨迹分布和拥堵的风险。广泛和持续的地铁线路扩展应提前做好规划。线路扩展不一定会改变各站点的可达性水平、客流量和发展潜力。尽管如此,对于正计划通过修建新的地铁系统带来重大转变的城市而言,上述前瞻性的发现对其城市设计具有重要的启示。从城市设计旨在理解多尺度的空间分布、空间组成和空间布局所导致的结果来说,这是一种新型的城市设计。
理解公交可达性与就业区位的关系
分析工作地点的位置与公交可达性的关系,是着手解决该问题的一种方式。尽管并无有关香港工作地点位置分布的详细数据—仅有区级数据且无更详细空间层面的的替代数据可供使用—然而可用的信息显示,港岛、九龙、东九龙部分地区、葵芳和荃湾的“地铁覆盖区域”的工作地点占比达75%以上。鉴于该区公交可达性分布和建筑物分布情况,这很可能会加剧维多利亚港周边狭小区域的过度集聚状况。电信大数据证实了这一情况[7]。
工作地点过度集中并非香港独有。伦敦、巴黎、纽约也面临同样的问题。公交网络布局和就业区位之间的互动效应推动了两者极度失衡的分布状态,可能是造成香港和其他城市面临这一问题的原因所在。香港的地铁系统,尽管规模中等,但却相对成熟;除非日后进行改变性的建设,否则目前计划到2026年前完成的扩展项目(图07)不会引发经过现有站点的流量轨迹发生大的变化。图08显示了环形线路对重新分布可达性和流量所起的作用。借助网络科学的设计工具如sDNA完成的草图规划,可以对改造项目进行模拟,考察并开始思考如何更好地平衡地铁网络的可达性。
思考公交可达性与空间不公正的关系
由于地铁线网布局是为了公共利益,在考虑设计地铁网络的形态时,同样需要质问公交的可达性分布是否公正。由于40%的人口不居住在地铁覆盖区,而地铁覆盖区目前和将来都是增量最大的地区,因此我们需要思考如何才能公正地分配香港交通的可达性?即便我们同意地铁线路建设通常以自上而下的方式完成,但这属于城市政治经济的一个重要方面,不应当仅靠港铁公司一己之力。
总结及对城市设计师的建议
在非高峰时段,避开系统性拥挤区(图05、06突出显示部分),乘坐香港地铁亦是一段愉悦的体验。放眼世界,不论是在中国,还是伦敦、纽约、巴黎等大都市,都不可避免的存在地铁系统拥挤的问题。这种拥挤不仅仅发生在地铁车厢和地铁站厅里,同样发生于街道、公共空间和用作公共场所的室内空间 — 例如与地铁站相伴的众多商业空间 —“地铁+物业”模式中的物业,抛开拥挤问题不谈,这种模式是港铁大获成功的重要因素。
地理,“地铁+物业”的盛行模式和复杂气候状况的组合,形成了香港似乎深不可测的复杂的空间分布、组成和布局形态。香港气候具有三大鲜明特点:湿热、台风季节多强风和降雨、冬季气候温和。在这三大气候特点、狭窄的地形、上世纪人车分流的交通设计理念的影响下,形成了多层次复杂交错的地下、地面和空中步行系统。行人可从湾仔全程通过地下通道步行至中环,其间无需GPS的帮助,因为GPS无法确定你的位置。若在午餐时间和人流高峰时段选择步行方式出行,则丝毫感受不到步行应有的畅通性和空间舒适性。
这些是城市设计未能提前作出有效应对的新状况。多数城市设计理论主要关注增加城市活力,同时兼顾增加行人活动。而有关活力过旺的城市设计理论文献和项目则少之又少。如何使有组织或渐进式的密度分散成为一种行之有效的城市设计策略?
新的状况使得城市更新的兴趣转向并行结构城市和立体城市[2、6、9]。但,这是否就是解决问题的答案所在呢?或者,城市应该采用巴塞罗那那样的超大街区布局[1],通过预留更多的步行空间进行疏散?鉴于九龙和旺角有着与巴塞罗那相似的网格布局,它们是否应该使用象巴塞罗那那样的超大网格结构?
暂且不提怎样采取有效的干预和设计措施,城市设计师怎样才能准确理解设计的复杂性?无疑可以先从绘图着手。正如《悬浮城市》[6]一书所述,这些空间外形虽复杂但美观,而美观的外形会干扰城市设计师的设计决策,使其难以决定是作出改进、保持中立、小幅改动或与现状大幅偏离?虽然交通规划师持有精确的地铁线路图、公路网图、公交线路图、自行车路线图和先进的建模技术,但在解决这一问题上,他们并不占优势,他们手中并无步行网络图,并且对如何针对复杂的人行路径建模并无良策。因此,香港大学已安排专门小组负责绘制香港室外(图09&10)和室内(图11)所有的人行通道。室内和室外包括地下、地面或空中。步行路线图完成后,将成为可被计算机读取的线性参考系统,当中标注线路的各项属性特点。绘制步行路线图旨在通过使用网络科学的分析技术根据不同标准(图12)模拟人流情况,了解香港的宜步性,人流拥挤发生的位置及采取干预措施的结果如何。该项目名为“宜步香港”,荣获Walk21香港城市科技奖。宜步性是一个多维度指标,涉及重要的有形和无形维度。在香港,该指标会随具体的天气状况,行人的个体情况、居住和工作生活轨迹、出行目的和动机而变化,同时受出行便利性和对促成出行而言属重要的其他无形因素所影响。这对实现积极老龄化而言同样重要。
《悬浮城市》一书涉及的复杂性和精彩描述并不能让我们找到摆脱拥挤问题的潜在方法。有不少方式主张仅通过增加人行空间,减少感受到的人流量和实际拥挤情况。上文提到的巴塞罗那的超大网格结构便是其中一种。其他的潜在设计包括增加人行通道的密度,协调地面、地下或空中人行通道的关系。在将拥挤赶至他处之前,理解和预判这些“如果。。。就。。。”之类的设计干预措施如何被察觉、使用和有效缓解现有拥挤,是其中一个主要问题。这将是我们日后的工作。

The new crowdedness
Major cities in China are building and expanding metro systems as a strategy to improve sustainable mobility and reduce the negative environmental and social consequences of fast-paced motorization. In China, 33 cities have a metro network,and metro systems are currently under construction in 16 additional cities with many more under planning and being proposed. As the number of passengers choosing the metro for daily transportation increases, crowdedness, previously a problem on metro trains, are now common in many metro stations and in the approach to the stations.
This relatively new crowdedness phenomenon is not unique to China; it is experienced in New York, London, Paris and many other cities. These are new urban conditions that urban design is not very well prepared to deal with. Most of urban design theory is predicated on increasing vitality, associated with increasing pedestrian activity. Not much is to be found in the urban design literature and projects about the opposite phenomenon: too much vitality. Yet, since crowding is both perceptual and objective, urban design can play an important role in understanding how to con fi gure progressive and diversi fi ed level of urban buzz.
How can organised or progressive dispersion be a meaningful urban design strategy?
By this, we do not mean crowd management–the management of people movement and behaviour during major events, which has its own specialised techniques and literature. Events may induce limited crowdedness in place and time while place crowding is more or less continuous. Crowding is what causes people to start to avoid an area because it is perceived as having too much people intensity and vitality. Designing for progressive vitality is to allow vitality to grow and expand and still offer a range of vitality levels. Designing for progressive vitality entail understanding when an area is stressed by over intensity and vitality and why.
Learning from Hong Kong?
Hong Kong is a city of extreme con fi gurations, which are a unique mix of extreme geography, climate, institutions, development history, and urban innovation.Combining steep geography and water, only 20% of Hong Kong’s territory has a slope of less than 1 to 5. On this has been built a hyper-dense city with an extremely successful Transit Oriented Development (TOD) system, making it an extraordinary and dazzling urban landscape between water, green ‘wall’ hills, hyper density, MTR and road infrastructure.
Hong Kong is one of the most comprehensive TOD cities in the world. It has always received “best of” accolades for its public transport. It is endlessly repeated that public transport accounts for 90% of commuting, a sort of unreachable platinum sustainable transport standard. Yet Hong Kong is a crowded city, with high level of crowdedness within its metro (MTR) carriages, MTR stations and in the complex surroundings of the stations. At certain times, this crowdedness can also be found in many streets. What can we learn from Hong Kong about crowdedness, urban form and urban design?
Does it mean that Hong Kong can be a model to learn from? How does an understanding of how hyper-crowdedness is generated help us design its mitigation?The oft-repeated phrase that “in Hong Kong land is scarce” needs to be quali fi ed:“in Hong Kong fl at and easily buildable land is very scarce”. So, for the Hong Kong model to make sense, one may fi rst have to build some hills, since most large cities are mostly fl at, and Hong Kong’s spatial solutions would make little sense.
Nevertheless, we can gain insight into the phenomenon of crowdedness, and its relationship to shape from analysing different aspects of how Hong Kong has responded to its spatial constraints, and draw insights into how to manage crowdedness. In this paper we aim to sketch out the characterisation of the extreme configurations of Hong Kong, proposing that if we understand the relationship between these extreme configurations and crowdedness we might be able to understand how to design “diversi fi ed” or “progressive level of” crowdedness. This might lead to an approach of city crowdedness mitigation that could be transferable.The rest of this paper discusses some lessons drawn from reflections on and analysis of the relationship between crowdedness and urban con fi guration in Hong Kong, at various scales. Tools and techniques for analysing this relationship are also discussed.
lnsight 1: Compactness is not a requirement for crowdedness
To explore the question of whether compactness is needed to generate crowdedness, we start by looking at Hong Kong’s overall urban form, including the MTR and bus network and green space composition, distribution and con fi guration before zooming in, asking how this may contribute to crowdedness.
In the urban form debate, the question of compact versus sprawl is prominent, as if these were direct opposites of each other. Let us explore this question by asking,“Is Hong Kong compact?” The answer, at the territory scale, is no. Hong Kong is a vertical city with low consumption of land per capita, it is an extremely dense city,yet it does not make it automatically compact. But neither is Hong Kong classically sprawling. Although there is no agreed de fi nition of sprawl, at least three features usually characterise it: low density, scattered, and discontinuous distribution, and association with car dependant transport.
Compactness means close and bounded as opposed to scattered and discontinuous. We intuitively perceive a circle or a square as compact. If we want to give it a quantitative characterisation we could use a shape index used in landscape studies. A circle would have a compactness of 1; the square will be 1.27 in terms of shape index (Fig. 01). Scrutinising the urban form of Hong Kong, one notices ribbon developments linked by the MTR and very engineered road infrastructure.The shape index of Hong Kong is 83, which is far from a compact urban form (Fig.02). Hong Kong’s urban form does not have much of a compact shape except for the very limited Kowloon area. Overall Hong Kong’s urban morphology is an assemblage of separated ribbons framed by steep hills, or between hills and water.Hong Kong density profile, its density transect (resident + work place) from the centre outward, is unlike most cities which are denser at their centre and have a more or less gentle decreasing slope outward. For Hong Kong, density goes from extremely high to “nothing” and then to very high again, then “nothing” whether it is water or country park. Hong Kong density is critically spiky, but the number of spikes is much reduced.


What Hong Kong shows us is that compactness of the overall urban shape in the sense of ‘urbanisation continuity’, is not a pre-requisite of crowdedness. In fact,compactness of shape may actually mitigate crowdedness.
lnsight 2: Large park con fi guration is a possible driver of crowdedness
If Hong Kong is not compact, what happens between all the high-density ribbon linked by the MTR and roads? In between are Hong Kong’s Hilly Woodland, shrub and grass land, which occupy almost 65% of the territory. This is a hyper-dense city in hilly park settings. In most cities, these areas will be fl at land and mostly builtup area interspersed with green spaces and parks. Hong Kong is the reverse. Most cities boasting a lot of park/green space do not mention that these green spaces are mostly at the periphery of the build-up area. These green spaces are not very accessible or visible from the densest part of the city: unlike Hong Kong which has a privileged con fi guration of steep large parks with built-up area nested between them.
The Country Parks are usually large. It means that anyone in Hong Kong is near a very large Park. This is certainly an advantage. So, the composition, distribution and con fi guration of parks are possibly a driver of crowdedness. If we zoom out to the Pearl River Delta (PRD) satellite view, Hong Kong and Zhongshan hills are the giant green areas that mark the Pearl River mouth. The Country Parks are not just precious and valuable to Hong Kong, but also precious to the whole PRD.
Insight 3: Metro network shape underlies crowdedness
The de fi nition of TOD as creation of compact, walkable, pedestrian-oriented, mixeduse communities centred around high quality train systems lends itself to hyper density spikiness. Let us now turn to examining the overall layout of the MTR system. Does the MTR network shape matter for crowdedness?
Let us start with an anecdote. There is an intriguing report that the MTR was designed for 6 people per square meter yet recently people are less willing to board a crowded train and wait to the next one–which lead to train operating at 4 people per square meter only. It has been suggested that this might be due to the space needed to use mobile device. Mobile devices have also changed the meaning of transport journey–it is no more a dead time, it is a productive time that should be comfortable. It complicates the simplistic eきciency story that the faster the transport journey is, the better it is. If you are in the middle of something on your mobile device, you may fi nd that your destination has arrived too soon… You also end up having activity with your mobile devices that are linked to the expected length of the journey.
There are many ways of reducing in-carriage crowding in metros such as making train longer by adding carriage, increasing service frequency on busy sections of the network, distributing better the passenger along the train, and so on. However,in-carriage crowding can be reduced but in-station crowdedness will increase.Pricing is another way to reduce crowding, yet it would be contrary to the objectives of sustainable transport usage. Smoothing the peak time, is yet another strategy.Some metros oあer free or heavily discounted pricing when travelling outside peak hours. London has resorted to various enticements for people to walk more in an attempt at reducing metro crowding by indicating the travel time between stations where walking between stations is faster than taking the metro.
While these measures can be seen as making the system more eきcient, they are‘tinkering at the margin’; they do not change the layout of the network. Network science shows that MTR network layout overall structure has a large impact on usage distribution over parts of the network and as such on crowdedness in-carriage and in-stations. The Hong Kong MTR network shape is unique if we compare a diagram of most metro system lines layout with HK MTR line layout diagram. For most metro systems (Fig. 03), a relatively large ring encircles a prominent core of stations. Branches radiate from the core and reach further areas of the urban system. The branches have diあerent size and can divide in short and longer spur.For Hong Kong (Fig. 04), the branches are the most prominent components. The branches are very long and extend far away. There is not really a signi fi cant number of interlinked cores of stations. Instead, there are only a very small number of core stations, to the extent that these form a ‘point’ comprising just three stations:Central-Hong Kong Station, Admiralty and Tsim Sha Tsui-Kowloon. However, almost all these branches pass through the Mong Kok–Mong Kok East–Olympic area,where they run parallel but do not meet before ultimately ending up in the ‘point’,making this as a very congested and over-crowded vertical extended area.
We now introduce the first tool, sDNA [3] for providing insight into the shapecrowdedness relationship: modelling network fl ows.
Fig. 05 is a network science simulation that shows fl ow potential–the thicker the line the higher the fl ow. Empirical network science studies [5] have shown that these simulations are well-related to actual fl ow, showing the impact of the metro layout on flow and consequently to in-carriage and in-station crowding. Fig. 05 shows how Central, Kowloon and the eastern part of Hong Kong Island are well-served by massive fl ow. Intuitively, this makes sense: if there are very long radials ending up in the same place it is likely to be crowded in the converging area.
The HK MTR layout obliges journey between branches to always go through the centre, making journeys longer and unnecessarily adding the number of passengers going through the centre–circle line and looped radial lines would remove these extraneous journeys through the centre and contribute in shifting accessibility outward but also reducing overall journey time for all.


The planned Singapore metro extensions, for example, will have a major circle line and many more long-range loops resulting in no dead-end line. While Singapore’s geography is different, still there is something they seem to know about metro system layout that Hong Kong may want to scrutinise. Paris with the Grand Paris Express project, is currently also making a transformational change to the metro layout.
In HK, it seems that very little daring conceptual urban planning, transport planning and urban design thought has been given to how this may change given the current critical mass and maturity of the MTR system. Perhaps the connection of Shenzhen metro system with Hong Kong MTR will change these relationships, although to what extent is unknown given that the future connectivity potential is rather minimal.
‘Managing crowdedness by network shape’ as strategic urban design
Coming back to the ground and returning to what plays an important role in moving Hong Kong, are the swarms of small green and red buses and large double decker zipping around all Hong Kong roads. Fig. 06 shows a similar simulation than Figure 05, this time for the HK metro, tramways, ferries and the buses. One can see how the MTR and the bus network con fi gurations induce very concentrated fl ows.
While the bene fi t of agglomeration is what makes the advantage of city, enabling high potential for interactions; as we have already argued, in the case of Hong Kong, the question needs to be reversed as to what configuration of density distribution and composition create agglomeration dis-bene fi t such as crowdedness.A new approach to crowdedness and accompanying research are needed.Following on from the discussion above, the accompanying research will need to answer questions such as, “Is the metro and bus system over centralised?” and “Are accessibility provided by metro and bus over centralised?”
In the perspective of creating a more polycentric Hong Kong, by creating subcentres that will improve economic performance by diminishing the negative externalities of agglomeration (congestion, pollution, crowdedness, and high land prices), planners in Hong Kong always lament of the failure at creating more balanced work place resident ratio in most of the new towns. One strategy is new sub-centres creation; another accompanying one is to inter-link these subcentres in such a way that they can function as a system that is much more independent of the major centre. This is more so in a service, knowledge economy or distributed clean manufacturing economy.
What sort of metro network con fi gurations would support the successful creation of a polycentric city?
Any TOD urban design project should understand the strategic trajectories of public transport network flow and crowdedness risks. Extensive and successive MTR extensions are planned well in advance. They may or may not alter much the accessibility ranking of each station, fl ow potential and thus their development potential. Nevertheless, such forward-looking fi ndings are important to inform urban design in cities that are undergoing massive transformation via new metro system.This is new urban design in the sense that urban design aims to understand the outcomes of multi-scale relation of spatial distribution, spatial composition, and spatial con fi gurations.
Understanding public transport accessibility’s relation to work place location
One way of beginning to address this question would be to analyse public transport accessibility in relation to work place location. While there are no detailed data of work place locations in Hong Kong - the information is at district level and there is no easy alternative to use as proxy at more detailed spatial level - the information available indicates that the “metro area” which comprises Hong Kong Island,Kowloon, part of Kowloon East, Kwai Fong and Tsuen Wan have more than 75% of work places. Given the distribution of the public transport accessibility and the built distribution in that area, it is likely that this is further over-concentrated in a very small area around Victoria harbour. Big data phone traces con fi rm it [7].
Over-concentration of workplace is not unique to Hong Kong. London, Paris, and New York have a similar pattern. In Hong Kong as elsewhere this might be due to the very unbalanced distribution that is fuelled by the interaction of the public transport network configuration and work place location. The Hong Kong metro system, despite its middle size, has become a very mature system, and unless transformational project occurs, the future extension currently projected by 2026 (Fig.07) will not alter much the trajectory of the existing metro station for good or bad. In Fig. 08, one can see the eあect of how looped lines start to re-distribute accessibility and flow. Sketch-planning via network science design tools such as sDNA allow insight by simulating such transformational projects and start thinking how MTR accessibility could be better balanced.
Considering public transport accessibility’s relationship to spatial inequity
In considering the design of the metro network shape, the equitability of distribution of public transport accessibility is also to be questioned, given that the metro layout is meant to be a public good. Given that 40% of the population do not live in the metro area, and this is the area that has and will have the largest growth, how equitable is the distribution of accessibility in Hong Kong? This is an important aspect of urban political economy that can’t just be left to the MTRC even if we agree that metro line building is usually a top down process.
Conclusions and recommendations for urban designers

Experiencing the Hong Kong MTR is extraordinary as long that one stays within the system and avoids peak time. The systematic crowding areas are highlighted in Fig. 05 and 06. Metro crowding is also found in many metro systems in the world whether in China or in large metropolis like London, New York, Paris, etc. Not only crowding is occurring in metro carriages and stations; but also in streets, public spaces and indoor spaces that work as public spaces–for example the many commercial spaces that are associated with MTR stations–the properties that are part of the “rail+property” model and beyond that makes the success of the MTR.
The combination of geography, and the proliferation of MTR “rail+property” formula and Hong Kong climate complex regimes lead to a spatial distribution, composition and configuration complexity that seems unfathomable. The Hong Kong climate has three distinctive regimes, very hot and humid, windy and rainy, typhoon season and agreeably temperate weather in winter. Designing for these three regimes in a tight geography combined with late 20th century traffic ideology of pedestrian segregation has resulted in the multi-level complex entanglement of below, at grade and above ground pedestrian realms. You might walk from Wan Chai to Central,where GPS might not be of help as GPS does not even know where you might be,without setting foot on the ground. Lunch time and certainly peak time walking might verge on nothing near a de fi nition of walkability as moving in an unimpeded manner with much space.
These are new urban conditions that urban design is not very well prepared to deal with. Most of urban design is predicated on increasing vitality, associated with pedestrian activities–not much is to be found in the urban design theory literature and projects about the issue of too much vitality. How organised or progressive density-dispersion can be a meaningful urban design strategy?
These new urban conditions have generated a renewal interest for the parallel cities and the multi-level cities [2, 6, 9]. Yet is it the answer? Or should it be the super blocks like in Barcelona [1], to give much more space to pedestrian–dispersion by allocating more space to pedestrian? Should the Barcelona super-grid be implemented in Kowloon and Mong-Kok given their grid like Barcelona layout?
How does an urban designer start to comprehend such a complexity let alone intervene and design meaningfully? Mapping is certainly a start. As the book Cities without Ground [6] demonstrates so well, these spaces are tantalising yet in their appearance of capturing complexity, the beautiful drawing deceive as to what any intervention might do? Improve, be neutral, marginal change or major departure from the current situation. Transport planners are not better placed while they have very accurate map of the metro network, the road network, the bus network, the cycling network and rather sophisticated modelling techniques, they do not have a map of the pedestrian network and are rather puzzled on how to model the complexity of the pedestrian journey. Therefore a team at HKU [11] has started to do the mapping for all the pedestrian paths of Hong Kong outdoor (Fig. 09 & 10) and indoor (Fig.11). Indoor and outdoor might be below ground, at grade or above ground. Once this map is completed, it becomes a machine readable linear referencing system to which qualities of the journey can be attached. The aim is to use network science and simulate pedestrian fl ow according to various criteria (Fig. 12) to understand how walkable is Hong Kong, where are the crowding areas and what if interventions might change them. The project is called WalkableHK. WalkableHK received the Walk21 Hong Kong CityTech Awards. Walkability is multi-dimensional with important tangible and intangible dimensions. In Hong Kong, it changes according to climate regime of the day and time, individual profile, residential and work life trajectories, purposes and motivations, mixing both convenience and more intangible characteristics that are nevertheless important to incentivise walking. This is certainly also important for active aging.
The complexity involved and beautiful depictions in Cities without Ground do not allow us to assert potential way out of crowdedness. There are many ways to reduce pedestrian perceived and actual crowdedness by simply increasing space for pedestrian. Barcelona’s super-grid mentioned above is such an example.Other potential design exists such as increasing the density of pedestrian ways,coordinate parallel at grade, below or above ground pedestrian ways. One of the key issues is to understand and anticipate how these “what if” design interventions are perceived and lived and how they successfully reduce the existing crowdedness without displacing it. This is our future work.


[1] Barcelona superblock http://ajuntament.barcelona.cat/ecologiaurbana/en/what-we-do-and-why/quality-public-space/superblocks
[2] Blauvelt, A., Yoos, J. & James, V., 2016. Parallel Cities: The Multilevel Metropolis. Minneapolis: Walker Art Center.
[3] Chiaradia, A., Cooper, C., Webster, C. (2010) sDNA, spatial Design Network Analysis, Cardiff University, Hong Kong University
[4] Curtis, C. and Scheurer, J., 2016. Planning for public transport accessibility: an international sourcebook. London: Routledge.
[5] Derrible, S. and Kennedy, C., 2011. Applications of graph theory and network science to transit network design. Transport reviews, 31(4), pp.495-519.
[6] Frampton, A., Wong, C. and Solomon, J., 2012. Cities without ground: a Hong Kong guidebook. Oro editions.
[7] Grauwin, S., Sobolevsky, S., Moritz, S., Gódor, I. and Ratti, C., 2015. Towards a comparative science of cities: Using mobile traffic records in New York, London, and Hong Kong. In Computational approaches for urban environments (pp. 363-387). Springer International Publishing.
[8] Kanga C, Mab X., Tongc T, Liu Y. 2012, Intra-urban human mobility patterns: An urban morphology perspective, Physica A 391 (2012) 1702—1717
[9] Mangin, D., Girodo, M., Eds, (2016) Mangroves urbaines: du métro à la ville (Paris, Montréal,Singapour), Paris: La Découverte, collection Dominique Carré.
[10] Roth, C., Kang, S.M., Batty, M. and Barthelemy, M., 2012. A long-time limit for world subway networks. Journal of The Royal Society Interface.
[11] WalkableHK, (2016) Guibo, S., Zhang, L., Sarkar, C., Zhang, X., Webster, C., Chiaradia, AJF., The University of Hong Kong, Faculty of Architecture
[12] Zhang, L., Chiaradia, A. and Zhuang, Y., 2015. A Configurational Accessibility Study of Road and Metro Network in Shanghai, China. In Recent Developments in Chinese Urban Planning (pp. 219-245).Springer International Publishing.
猜你喜欢
艺术启蒙(2018年7期)2018-08-23
商周刊(2018年13期)2018-07-11
军事文摘(2017年24期)2018-01-19
海峡姐妹(2017年7期)2017-07-31
能源(2017年5期)2017-07-06
Coco薇(2017年5期)2017-06-05
中国科技信息(2016年15期)2016-11-04
中国卫生(2015年2期)2015-11-12
Coco薇(2015年1期)2015-08-13
创业家(2015年1期)2015-02-27
