
Dynamics of forest biomass carbon stocks from 1949 to 2008 in Henan Province,east-central China
2018-03-19 05:08YanfangWangLingLiuZhoupingShangguan
Journal of Forestry Research 2018年2期
Yanfang Wang•Ling Liu•Zhouping Shangguan
Introduction
Forest ecosystems store the greatest amounts of carbon in terrestrial ecosystems and are important in global C cycling and climate change(Dixon et al.1994;Pan et al.2011).Forest ecosystem carbon storage has been reported at global,national and regional scales(Durán et al.2015;Holdaway et al.2014;Kohl et al.2015;Pan et al.2011;Poorter et al.2015).China as the largest developing country in the world has the largest area of plantation forests(Streets et al.2001).After the new social system was established in 1949,rapidly increasing population and economic development have resulted in increased forest exploitation and environmental degradation across the country,especially 1949–1963 and 1976–1980.In order to reduce environmental degradation,China’s government launched a series of national key forest programs beginning in the late 1980s,including: ‘Natural Forest Protection Program’, ‘Deserti fi cation and Dust Storms Control Program in the vicinity of Beijing and Tianjin Municipalities’,‘Forest Shelterbelt Development Program in key environmentally fragile regions’, ‘Wildlife Conservation and Nature Reserves Development Program’and ‘Fast-growing and High-yield Timber Plantations Program’,in the late 1990s,Grain for Green Program has played an important role in the restoration of vegetation.(Sylvie et al.2009).These programs increased forest area and the amounts of carbon stored in China’s forest ecosystems.
China’s forest vegetation carbon storage,carbon density and spatial distribution have been quanti fi ed using various methods at regional and national scales(Fang et al.2001;Piao et al.2005;Ren et al.2011,2013,2014).Differences in the regional distribution of forests, fi eld data collection methods,and analytical methods have resulted in varying estimates of forest vegetation carbon storage in China.For example,Wang et al.(2001)estimated forest vegetation carbon storage based on the 38 dominant tree species in China at 3724 Tg.In contrast,Fang et al.(1998)estimated China’s forest ecosystem carbon storage at 4300 Tg while Dixon et al.(1994)estimated 17,000 Tg.Forest carbon sequestration is closely related to forest area,forest age structure and forest species(McKenney et al.2004).Many studies showed that carbon density varies by forest vegetation type and by forest age class(Guan et al.2015;Fang et al.1998;Ren et al.2013;Wang et al.2015).To account for regional variation in carbon storage estimates caused by forest type and research methods,it is necessary to estimate China’s forest carbon storage using a regional approach.
In China,Ren et al.(2011)used forest inventory data to determine that total forest vegetation carbon storage increased in Fujian Province from 136.5 Tg in 1978 to 229.3 Tg in 2008.Guan et al.(2015)estimated carbon storage increased from 83.1 Tg in 1979 to 100.7 Tg in 2006 in Gansu Province,depending on the relevant forest inventory data and empirical factors.These estimations of forest carbon stocks covered short time spans.
Henan Province,in east-central China,supports 359.1×10⁴ha of forest land that covers 21.5% of the province.Forest inventory data for Henan Province cover the years 1949–2008 yet the dynamics of forest biomass carbon stocks during this time period have not been reported.In this study we analyzed these forest inventory data(FID; fi eld data collected by Henan Province Forestry Bureau)to estimate carbon storage by forest vegetation from 1949 to 2008.Our objectives were to:(1)estimate carbon storage and density by forest type,age class,forest category,and forest origin;and(2)to describe forest carbon storage dynamics in Henan Province over this 60-year period.
Materials and methods
Study area
Henan Province is located in east-central China at 31°23′to 36°22′N and 110°21′to 116°39′E,in the middle and lower reaches of the Yellow River.The total land area is 1670×104ha,including 720×104ha of farmland and 740×104ha of hilly area.Henan Province is a transitional zone between subtropical and warm temperate regions of China,with a humid and semi-humid monsoon climate.Annual rainfall ranges from 500 to 900 mm and annual average temperature is 12–16 °C.Based on the Soil Taxonomy of China(Henan Province Soil Survey Of fi ce 2004),Henan soil types are mainly brown,cinnamon,yellow–brown,yellow-cinnamon, fl uvo-aquic,lime-concretion black,and saline-alkali soils.Southern warm temperate deciduous broad-leaved forests and northern subtropical evergreen broad-leaved forests are the main vegetation types in the region.Henan supports 197 plant families represented by 1191 genera and 4473 species,accounting for 12.2% of China’s fl ora.
Data source
Henan’s forest resource inventory database spans nine periods: 1949, 1950–1963, 1973–1976, 1977–1980,1984–1988,1989–1993,1994–1998,1999–2003 and 2004–2008.Inventory data were recorded using a systematic sampling method implemented by Henan Province Forestry Department.Mapped forest areas were overlaid with a 4×4 km grid and square plots covering 28.28×28.28 m were systematically sampled within each grid cell.Sampling methods were adjusted depending on the type of forest cover.The forest resource survey data of 1949 and 1963 were estimated by Henan Province forestry department in 1990 by using the predict equation(Li 1999).There are over 5399 permanent sample plots spread across Henan Province that have been systematically sampled for forest resource inventory from 1980 to 2008.
China’s forest resource inventory de fi ned fi ve distinct forest groups or categories:forest stands,economic forests,bamboo forests,open forests and shrub forests.For each of these forest groups,the forest inventory documented the areas and timber volumes for dominant tree species for forest stands by fi ve age classes(young,middle-aged,premature,mature and post-mature),four forest categories(timber,shelter,fuelwood,special use forest)and two sources of forest origin(plantations and natural forests).For the nine listed forest inventory periods,only total forest area was calculated for economic,bamboo,open,and shrub forests.
In 1994,the de fi nition of forest stands in China’s forest resource inventory was changed from>30%canopy coverage to>20%canopy coverage.In order to make our results comparable among different periods,Guo et al.(2013)modi fi ed the equations of the two criteria for the forest area and biomass C stocks at the provincial level for achieving more accurate conversion between 20 and 30%canopy coverage.In this study,we used their equations as follows to produce better estimates(Guo et al.2013).
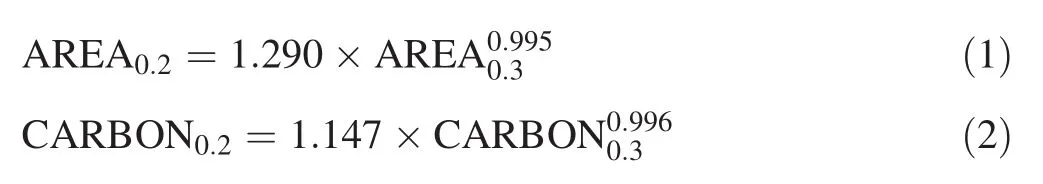
AREA and CARBON are the forest stand area(104ha)and biomass C stock(Tg)in a province,respectively;subscripts 0.3 and 0.2 represent the criterion of>30 and 20%canopy coverage,respectively.
We calculated carbon storage of forest vegetation by multiplying the amount of forest biomass by the carbon coef fi cient.We estimated forest biomass carbon stocks for each inventory period by using the continuous BEF method for forest stands,and the mean biomass density method for economic forests,bamboo forests,open forests and shrub forests.The coef fi cient of carbon of dominant tree species of the forest stands was obtained by the formula:

whereC1represents the cellulose content,C2is the hemicellulose content,C3is the lignin content.Cellulose,hemicellulose and lignin content for various species were obtained from the literature(Jiang and Peng 2001;Wang and Ding 1985)(Table 1).We used a ratio of 0.5 to convert biomass to carbon stock for bamboo forests,economic forests,open forests and shrub.
Estimating the biomass of forest stands
The biomass of trees was calculated using the continuous BEF method(Fang et al.2001)with a regression equation as follows:

whereBis the biomass per hectare(Mg ha-1),Vis the volume per hectare(m3ha-1),andaandbare parameters converting from volume to biomass for given tree species.
Henan Province forest resources inventory data included 12 dominant tree species.Where the biomass ofLarix,Cunninghamia lanceolata,poplar,andPaulowniain Henan Province have been quanti fi ed(Feng et al.1992;Wang 1999;Zeng 2005;Zhao 1989;Zhao et al.1999),we used the estimated parameters derived from these studies.Fang et al.(2001)derived formulae for converting volume to biomass for 21 dominant forest types in China.Five of the derived formulae were suited for Henan Province forests and were used in this study(Table 1).The parameters for three additional forest species groups including mixed conifer forest,mixed conifer and broadleaved forest and mixed broadleaved forest were taken from Zeng(2005),and these were suited for Henan Province.
Estimating the biomass of economic forests and bamboo forests
We estimated biomass carbon stocks by multiplying the mean biomass density by the area of economic forests in each inventory period.For mean biomass density we use the value of 23.7 Mg ha-1(Fang et al.1996).
Henan’s forest inventory documented the areas of moso bamboo and other bamboo forests.We estimated bamboo forest biomass carbon stocks by using the mean biomassdensity for each bamboo type multiplied by the area.We used the estimates of Guo et al.(2013)for the mean biomass density of moso bamboo and other bamboo forests(81.9 and 53.1 Mg ha-1,respectively).

Table 1 Parameters used to calculate biomass of forest stands and carbon fraction for different dominant tree species
Estimating the biomass of open forests and shrub forests
The Qinling Mountains–Huaihe River form the geographical boundary between south and north China.The distribution area of open forests and shrub forests in China are divided into three regions,viz.south Qinling Mountains–Huaihe River Line,northeast of Qinling Mountains–Huaihe River Line,and northwest China.In these three districts the mean biomass densities are 19.76,13.14 and 13.9 Mg ha-1(Fang et al.1996).Henan Province is located northeast of the Qinling Mountains–Huaihe River Line so we adopted a mean biomass density of 13.14 Mg ha-1to estimate the open forest and shrub-forest biomass density.The total biomass of open forests and shrub-forest was calculated by multiplying the average biomass density by the total area(calculated by Forestry Department of Henan Province).
Results
Change in forest area,forest biomass carbon storage and carbon sink
The total forest area increased from 231.9×10⁴ha in 1949 to 404.5 × 10⁴ha in 2008.During the periods 1950–1963 and 1977–1980 total forest area decreased(Fig.1).Beginning in 1980,forested area increased steadily.Notably,the area of afforestation increased signi fi cantly from 339.2× 10⁴to 404.5× 10⁴ha in 1999–2008.From 1949 to 2008,total vegetation carbon storage increased by 132%from 34.6 to 80.3 Tg,while forest vegetation carbon density increased by 30%from 14.9 to 19.9 Mg ha-1(Fig.1).The forest vegetation biomass carbon sinks varied greatly by time period:the carbon sinks in 1950–1963 and 1977–1980 were negative,implying forest vegetation had been damaged in these two periods.The forest biomass carbon sink increased from -2.782 Tg a-1in 1977–1980 to 4.120 Tg a-1in 2004–2008.
During the period 1949–2008,carbon storage and carbon density dynamics varied by forest type(Table 2).Accounting for 53–72% of total forested area,forest stands stored 72–86% of total biomass carbon storage and net accumulated carbon of 39.7 Tg over the 60-year period,at an average carbon accumulation rate of 0.674 Tg a-1.This accounted for 87% of total biomass carbon sink during 1949–2008.The area-weighted mean of biomass carbon density also increased from 18.6 Mg ha-1in 1949 to 24.4 Mg ha-1in 2008.Maximum forest stand carbon sink was estimated for 2004–2008 at 4.576 Tg a-1.These results con fi rm that carbon stored in forest stands had the most in fl uence on total forest vegetation carbon storage.Over the past six decades,the increase of carbon storage in economic forests,bamboo forests,open forests and shrubforests was mainly due to the increase in forested area and tree growth.The sum of carbon storage of economic forests,bamboo forests,open forests and shrub-forests accounted for 14–28% of total forest vegetation carbon storage in different inventory periods.
Biomass carbon storage and density of forest stands by age class
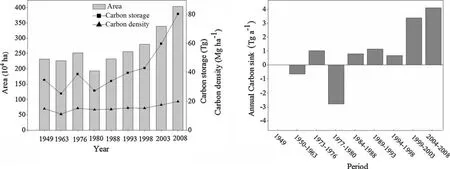
Fig.1 The change of area and carbon stocks in Henan Province’s forests during 1949–2008

b forests d shru forests an Open sink on Carb g a-1)(T Carbon storage g)(T Area(104ha)0.067-0.203-0.347 0.174 0.042 0.328.031-0.012-0.001-0 4.5 5.5 2.8 1.4 2.8 3.0 4.7 4.5 4.4 68.7 83.1 42.9 21.8 43.0 46.2 71.2 68.9 67.9 sink on Carb g a-1)(T 0.006 0.053 51-0.1 01-0.0 0.031 0.044-0.008 0.022 0.010 forests oo Bamb Carbon storage g)(T a)Area(104h 0.02 0.11 0.80 0.19 0.19 0.34 0.56 0.52 0.63 0.1 0.4 3.0 0.7 0.7 1.3 1.9 1.8 2.1 08 20 to 1949 from Henan Province pes in ty anges for different forest ch stocks d carbon an e area ble 2 Th Ta forests ic Econom stands Forest Period sink on Carb g a-1)(T on Carb storage g)(T a)Area 04h(1 sink Carbon g a-1)(T density on Carbg ha-1)(M Carbonestorag g)(T a)Area(104h 14-0.0 0.498 99-0.7 0.026 0.239 0.341 0.320-0.466 0.092 0.6 0.4 6.9 3.7 3.9 5.1 6.8 8.4 6.1 5.1 3.41.1 58 31.1 32.8 42.9 57.3 70.8 51.1.7162 644 2-00.67-1.485 0.58 0.82–0.0 3.098 4.576 0.674 18.6 13.9 19.0 15.9 17.2 18.7 20.6 23.4 24.4.4 29 1298.4.1 22 26 31 30 46 69.2.9.0.8.3.2 158.0 139.3 148.4 139.2 156.0 165.4 149.8 197.7 283.4 3 96 6 97 0 98 838388 1949 1950–1 1973–1 1977–1 1984–198 1989–199 94–199 19 99–200 19 04–200 20 49–200 19
Forest carbon is closely related to forest age composition(Liu et al.2000).In the early forest resource inventory data,forest stands only were grouped into three forest age classes(young,middle-aged,mature).After the inventory period of 1984–1988,forest stands were grouped into fi ve age classes(young,middle-aged,premature,mature and post-mature).To enable comparison of all inventory data,we included premature,mature,and post-mature forest into a single age class we named old–aged forest.The temporal change of area,carbon storage,and carbon density among three age classes of forest stands are shown in Fig.2.Carbon storage was mainly distributed in the young and middle-aged forests,whose area accounted for 87–97% of the province’s total forest area in different periods.Carbon storage in various periods accounted for 70–88% of total forest stand carbon storage.Old-aged forest area accounted for 3–13% of the total forest stand area and carbon storage accounted for 12–30% of total forest stand carbon(Fig.2).Carbon densities ranked by age class in descending order as:old-aged>middle-aged>young(Fig.2).
Biomass carbon storage and density of forest stands in planted and natural forests
We analyzed data by forest origin(natural versus planted)for the inventory periods after 1963(previous records made no distinction).Temporal changes in forest area,carbon storage,and carbon density under planted and natural forests are shown in Fig.3.
From 1976 to 2008,the area,carbon storage and carbon density of natural forest changed little.Natural forest area increased from 95.9×10⁴to 118.7×10⁴ha,accounting for 42–73% of the total forest stand area.Carbon storage was between 18.3 and 31.3 Tg accounting for 45–85% of the total forest stands carbon storage,meanwhile,the carbon density ranged from 18.0 to 26.3 Mg ha-1.Compared to natural forests,planted forests increased in area,carbon storage and carbon density remarkably.The area of planted forest increased from 38.1×10⁴to 160.8×10⁴ha,accounting for 27–58% of the total forest stand area.From 1998 to 2008 the area of planted forest increased from 53.9×10⁴to 160.8×10⁴ha.From 1976 to 2008,carbon storage of planted forest increased from 3.9 Tg to 37.9 Tg,accounting for 15–55% of the total forest stand carbon storage.Increased carbon storage was 33.7 Tg,or 82% of the total forest stand carbon storage increment(41.0 Tg),and average annual sequestration of 1.1 Tg of carbon.The carbon density of planted forest increased from 8.9 Mg ha-1in 1976 to 23.6 Mg ha-1in 2008.
(1)BaS在溶解过程中会首先电离出S2-和Ba2+,然后S-发生可逆水解反应生成OH-,当溶液中[OH-]和[Ba2+]达到饱和时BaS不再继续溶出;BaS的溶出量很大程度上受限于Ba(OH)2的溶解度,增加浸取温度、液固比可一定程度提高BaS的溶出量。
Biomass carbon storage and density of different forest types in forest stands
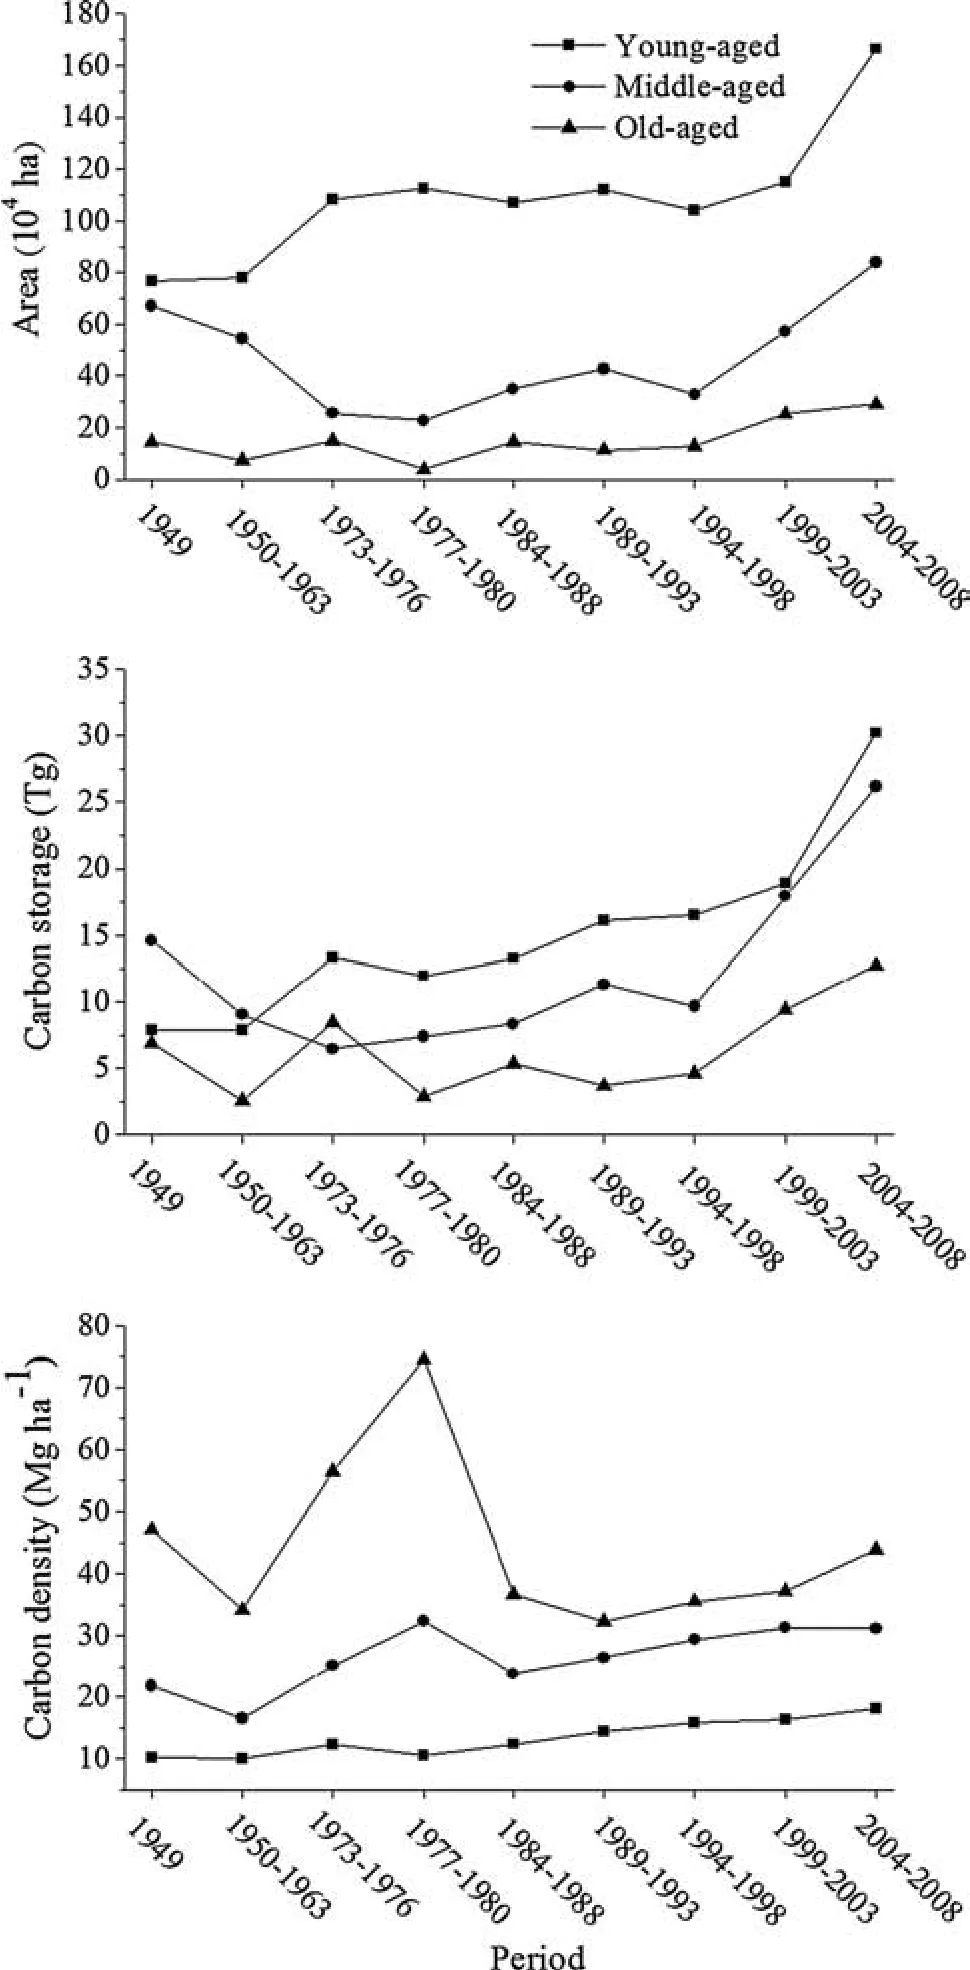
Fig.2 Area,carbon storage and carbon density of Henan Province’s forest stands among different age classes during 1949–2008
We categorized forest stands as coniferous and broadleaved forests.Coniferous forest area accounted for 8.4,43.1,19.3,19.5,19.5,24.2,24.5,17.8 and 12.1%,respectively,of Henan Province’s total area of forest stands in the nine inventories from 1949 to 2008.Carbon storage estimates for the nine periods were 2.3,9.1,4.6,4.1,5.1,7.2,7.5,4.9 and 5.7 Tg,accounting for 7.7,46.9,16.4,18.6,18.8,23.4,24.3,10.5 and 8.2%,respectively,of total forest stand carbon storage in the corresponding inventory periods(Fig.4).

Fig.3 Area,carbon storage and carbon density of Henan Province’s forest stands in natural forest and planted forest during 1949–2008

Fig.4 Area,carbon storage and carbon density of Henan Province’s forest stands in conifer forest and broad-leaved forest during 1949–2008
Broad-leaved forests area accounted for 92,57,81,80,81,76,76,82 and 88% of the Henan Province’s total area of the forest stands in the nine periods from 1949 to 2008.And carbon storage amounts in the nine periods were 27.0,10.3,23.6,18.1,21.8,23.8,23.3,41.4 and 63.5 Tg,accounting for 92,53,84,81,81,77,76,90 and 92%,respectively,of the total forest stands carbon storage in the corresponding time.Forest biomass carbon was accumulated mainly in broad-leaved forests.During 1949–2008,the mean carbon density of broad-leaved forests was between 16.1 and 25.5 Mg ha-1and conifer forests ranged from 13.8 to 20.4 Mg ha-1(Fig.4).The broad-leaved forests had high carbon storage mainly attributed to the large broad-leaved forest area and high biomass density.Broad-leaved forest was the main contributor to forest carbon sequestration in Henan Province.
Biomass carbon storage and density of forest stands
by forest category
Based on the goals of forest management,Henan’s forest stands can be divided into four forest categories:timber,shelter,fuelwood,and special use.But the forest stands were not divided into these four categories between 1949 and 1976.From 1949 to 1998 the area of timber forest was greater than other forest categories,accounting for 96%,95%,91%,64%,61%,64%,67% of the total forest stand area(Table 3).The area of shelter forest surpassed that of timber forest in 2003 and 2008,reaching 48% of total area in both years.Reforestation and afforestation programsfocus on conservation of water and soil,causing the increasing area of shelter forest.The dynamic of carbon storage in different forest categories was consistent with the changing area of different forest categories.Carbon densities varied by forest category during the period 1949 to 2008:The carbon density of fuelwood forest was the lowest of all forest categories.In 2008,the carbon densities ranked by category as specialuse forest>shelter forest>timber forest>fuelwood forest.
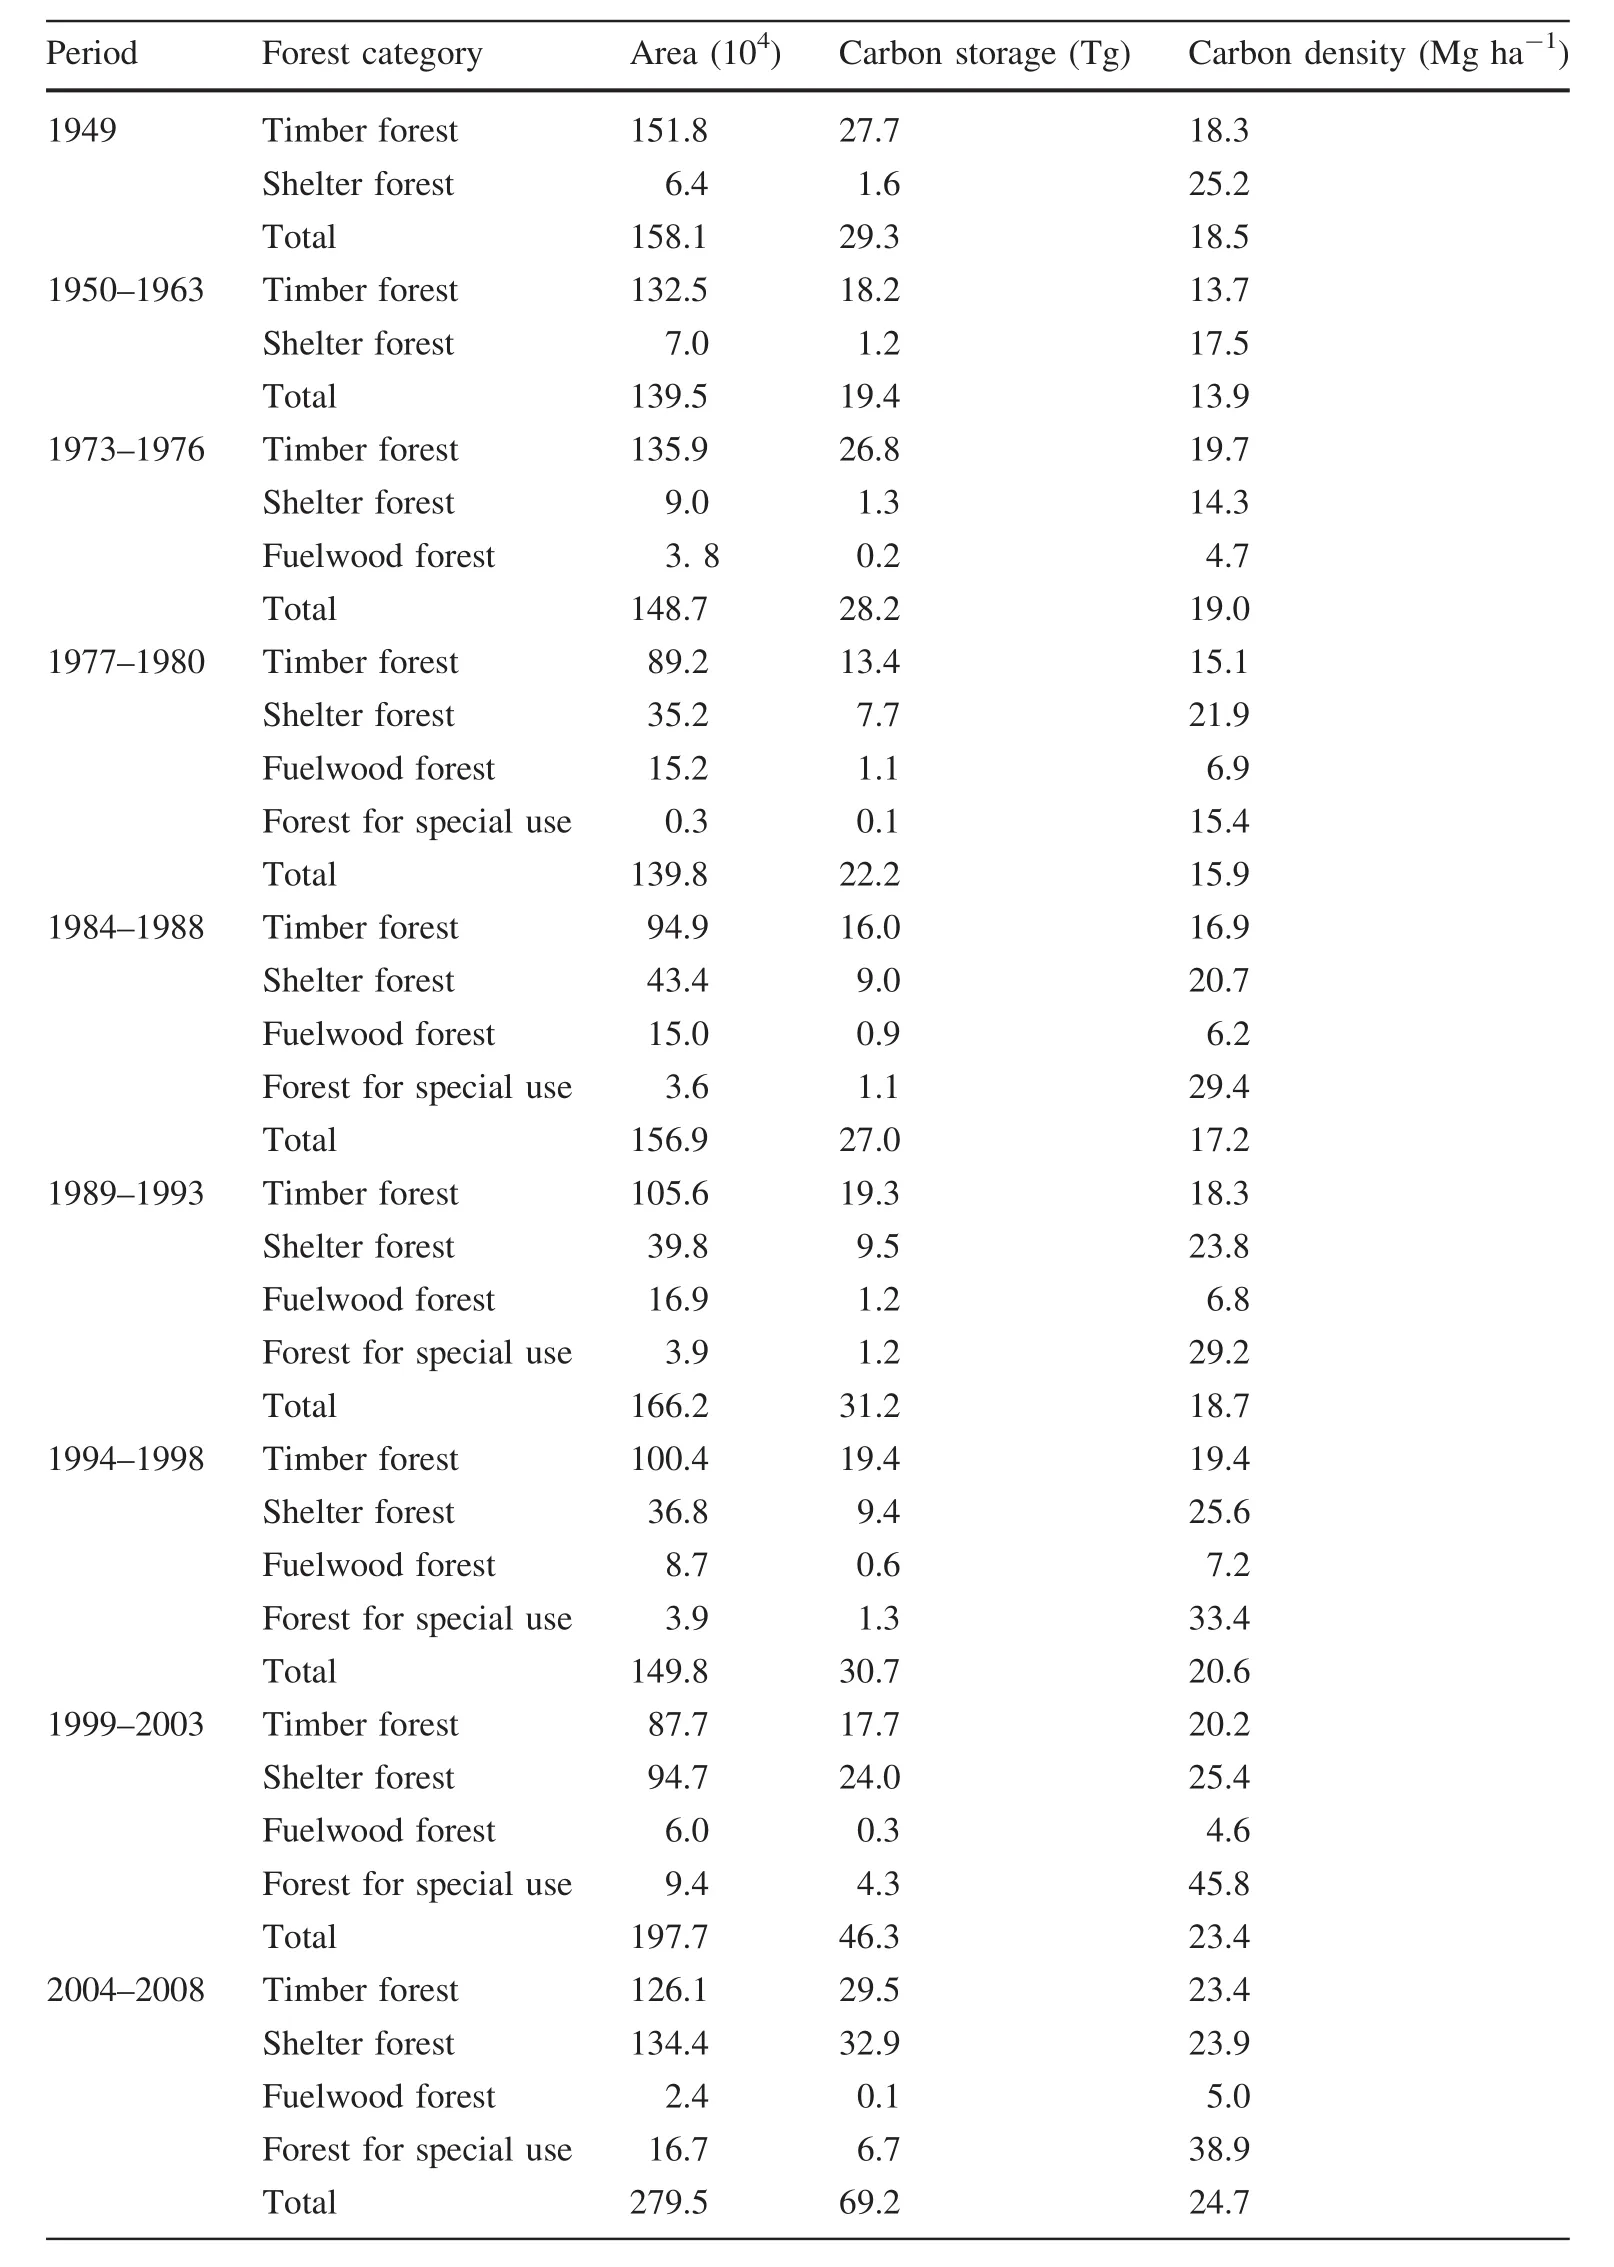
Table 3 Area,carbon storage and carbon density of different forest categories for nine periods from 1949 to 2008 in Henan Province,China
Discussion
During the period of 1949 to 2008,the forest carbon storage dynamics showed a trend of increasing.However,the forest carbon storage in 1950–1963 and 1977–1980 decreased,because of the government economic policy and lack of the regulatory measures for forests.From 1998 to 2008,the forest area and carbon storage increased drastically,this was signi fi cantly due to the Grain for Green Program was carried out in Henan Province.These results have demonstrated that reforestation and afforestation programs are important measures to increase the forest carbon sequestration.These results are consistent with previous studies(Ren et al.2013;Zhang et al.2009).
Broad-leaved forests stored more carbon than did coniferous forests in nine inventories from 1949 to 2008,due mainly to the greater area of broad-leaved forest and its higher carbon density.From 1998 to 2008,forest carbon storage increased sharply in plantations.This was because:(1)Many trees were planted during this period by the Grain for Green Program;and(2)good management practices were applied to the planted forests.The result of carbon density in natural forest is higher than in planted forest is consistent with the study from Guo et al.(2013),mainly because species diversity and productivity are greater in the former(Deng and Shangguan 2013).
Analyses is data sets covering 60 years are often subject to various sources of error.First,the most important errors may come from forest inventory data and the model parameters(regression coef fi cients a,b)converting forest volume to biomass.Forest inventory data used in our study speci fi ed the precision requirement in sampling design:the forest area and volume precision were required to be>90%in Henan Province.In addition,the R square values of the equations used to convert timber volume to biomass were above 0.9 for most dominant tree species(Table 1).Therefore,the data and method used in this study have relatively high precision.Ren et al.(2013)analyzed the error in estimates of forest carbon storage in Guangdong Province,southern China.In their study,the forest area and volume only contributed a small error to forest C storage estimate.Larger errors were mainly caused by model parameters(regression coef fi cients a,b),which accounted for 97,97,and 96% of the total error in 1992,1997,and 2002,respectively.To improve the accuracy of model predictions,it is necessary to develop conversion parameters that are adjusted to fi t regional forest conditions.
For the economic forests,bamboo,open forests and shrub,the major error can be generated from the use of mean biomass density.In this study,we used a mean biomass density estimate that is a universal value abstracted from the literature.This might have introduced error due to the in fl uences of climate,site conditions,or management practices.To remove this source of error,it is necessary to develop regionally accurate estimates of mean biomass density for representative forest vegetation types.
Deng L,Shangguan ZP(2013)Carbon storage dynamics through forest restoration from 1999 to 2009 in China:a case study in Shaanxi province.J Food Agric Environ 1:1363–1369
Dixon RK,Brown S,Houghton RA,Solomon AM,Trexler MC,Wisniewski J(1994)Carbon pools and fl ux of global forest ecosystems.Science 263:185–190
Durán SM,Sánchez-Azofeifa G,Rios RS,Gianoli E(2015)The relative importance of climate,stand variables and liana abundance for carbon storage in tropical forests.Global Ecol Biogeogr 24:939–949
Fang JY,Liu GH,Xu SL(1996)Biomass and net production of forest vegetation in China.Acta Ecol Sin 16:497–508(in Chinese)
Fang JY,Wang GG,Liu GH,Xu SL(1998)Forest biomass of China:an estimate based on the biomass volume relationship.Ecol Appl 8:1084–1091
Fang JY,Chen AP,Peng CH,Zhao SQ,Ci L(2001)Changes in forest biomass carbon storage in China between 1949 and 1998.Science 292:2320–2322
Feng ZW,Wang XK,Wu G,Liu GH(1992)Structure and function of agroforestry systems.Science and Technology of China Press,Beijing,pp 120–125(in Chinese)
Guan JH,Zhou HS,Deng L,Zhang JG,Du S(2015)Forest biomass carbon storage from multiple inventories over the past 30 years in Gansu Province,China:implications from the age structure of major forest types.J For Res 26:887–896
Guo ZD,Hu HF,Li P,Li NY,Fang JY(2013)Spatio-temporal changes in biomass carbon sinks in China’s forests from 1977 to 2008.Sci China Life Sci 56:661–671
Henan Province Soil Survey Of fi ce(2004)Henan soil.China Agriculture Press,Beijing,pp 56–70(in Chinese)
Holdaway RJ,McNeill SJ,Mason NWH,Carswell FE(2014)Propagating uncertainty in plot-based estimates of forest carbon stock and carbon stock change.Ecosystem 17:627–640
Jiang ZH,Peng ZH(2001)Wood properties of the global important tree species.Science Press,Beijing,pp 12–80(in Chinese)
Kohl M,Lasco R,Cifuentes M,Jonsson O,Korhonen KT,Mundhenk P,Navar JD,Stinson G(2015)Changes in forest production,biomass and carbon:results from the 2015 UN FAO Global Forest Resource Assessment.For Ecol Manag 352:21–34
Li RT (1999)Agricultural sustainable development in Henan Province.Elephant Press,Zhengzhou,pp 146–163(in Chinese)
Li HK,Lei YC(2010)Estimation and evaluation of forest biomass carbon storage in China.Chinese Forestry Press,Beijing,p 42(in Chinese)
Li YL,Liang H,Zhang BS(2011)Factor decomposition and correlation analysis on the carbon emissions in Henan Province.J Henan Agric Univ 5:605–608(in Chinese)
Li SD,Hu SP,Tang XM(2012)China Ecological Status Report 2012 Dynamic Change of Forest Carbon Stocks.Science Press,Beijing,p 235(in Chinese)
Liu GH,Fu BJ,Fang JY(2000)Carbon dynamics of Chinese forests and its contribution to global carbon balance.Acta Ecol Sin 20:733–740(in Chinese)
McKenney DW,Yemshanov D,Fox G,Ramlal E(2004)Cost estimates for carbon sequestration from fast growing poplar plantations in Canada.For Policy Econ 6:345–358
Pan YD,Birdsey RA,Fang JY,Houghton R,Kauppi PE,Kurz WA,Phillips OL,Shvidenko A,Lewis SL,Canadell JG,Ciais P,Jackson RB,Pacala SW,McGuire AD,Piao SL,Rautiainen A,Sitch S,Hayes D(2011)A large and persistent carbon sink in the world’s forests.Science 333:988–993
Piao SL,Fang JY,Zhu B,Tan K(2005)Forest biomass carbon stocks in China over the past 2 decades:estimation based on integrated inventory and satellite data.J Geophys Res Biogeosci 110:G01006
Poorter L,Sande MTVD,Thompson J,Arets EJMM,Alarcón A,á lvarez-Sánchez J,Ascarrunz N,Balvanera P(2015)Diversity enhances carbon storage in tropical forests.Global Ecol Biogeogr 24:1314–1328
Ren Y,Wei XH,Zhang L,Cui SH,Chen F,Xiong YZ,Xie PP(2011)Potential for forest vegetation carbon storage in Fujian Province,China, determined from forest inventories. Plant Soil 345:125–140
Ren H,Chen H,Li LJ,Li PH,Hou CM,Wan HF,Zhang QM,Zhang PX(2013)Spatial and temporal patterns of carbon storage from 1992 to 2002 in forest ecosystems in Guangdong,southern China.Plant Soil 363:123–138
Ren H,Li L,Liu Q,Wang X,Li Y,Hui DF,Jian SG,Wang J,Yang H,Lu HF,Zhou GY,Tang XL,Zhang QM,Wang D,Yuan LL,Chen XB(2014)Spatial and temporal patterns of carbon storage in forest ecosystems on Hainan Island southern China.PLoS ONE 9(9):e108163
Streets DG,Jiang KJ,Hu XL,Sinton JE,Zhang XQ,Xu DY,Jacobson MZ,Hansen JE(2001)Climate change—Recent reductionsin China’sgreenhouse gasemissions.Science 294:1835–1837
Sylvie D,Hou YZ,Yang WY(2009)Forest management policies and resource balance in China:an assessment of the current situation.J Environ Dev 18:17–41
Wang QJ(1999)Henan Cunninghamia lanceolata.The Yellow River Water Conservancy Press,Zhengzhou,pp 10–398(in Chinese)
Wang PQ,Ding ZS(1985)Wood Chemistry.Chinese Forestry Press,Beijing,pp 54–86(in Chinese)
Wang XK,Feng ZW,Ouyang ZY(2001)Vegetation carbon storage and density of forest ecosystems in China.Chin J Appl Ecol 12:13–16(in Chinese)
Wang YF,Liu L,Li ZC,Shanguan ZP(2015)Carbon storage and carbon density of forest vegetation in Luoyang,the Loess hilly area of Western Henan Province.Acta Pratacult Sin 24:1–11(in Chinese)
Zeng WS(2005)Research on forest biomass and productivity in Yunnan.Cent South For Invent Plan 24(1–3):13(in Chinese)
Zhang XP,Wang MB,Liang XM(2009)Quantitative classi fi cation and carbon density of the forest vegetation in Lüliang mountains of China.Plant Ecol 201:1–9
Zhao TS(1989)Study on the nutrient cycling of a compound ecosystem of agroforestry I.Study on the biomass of polar in the farmland shelterbelt forest.Rural Ecol Environ 2:1–5(in Chinese)
Zhao TS,Guang ZY,Zhao YM,Liu GW(1999)Study on biomass and productivity ofLarix kaempferiplantation.J Henan Agri Univ 33:350–353(in Chinese)
猜你喜欢
中国资源综合利用(2022年4期)2022-05-09
中学生数理化(高中版.高考理化)(2020年10期)2020-10-27
矿冶工程(2020年1期)2020-03-25
科学与财富(2017年28期)2017-10-14
中学教学参考·理科版(2016年3期)2017-05-19
试题与研究·中考化学(2016年4期)2017-03-28
中学化学(2016年10期)2017-01-07
中国学术期刊文摘(2016年8期)2016-02-13
中学化学(2015年10期)2015-12-14
中学化学(2015年5期)2015-07-13
 Journal of Forestry Research2018年2期
- Journal of Forestry Research的其它文章
- Effect of species composition on ecosystem services in European boreal forest
- Analysis of SSR loci and development of SSR primers in Eucalyptus
- Optimal and synchronized germination of Robinia pseudoacacia,Acacia dealbata and other woody Fabaceae using a handheld rotary tool:concomitant reduction of physical and physiological seed dormancy
- Genetic effects of historical anthropogenic disturbance on a longlived endangered tropical tree Vatica mangachapoi
- Genetic variation in relation to adaptability of three mangrove species from the Indian Sundarbans assessed with RAPD and ISSR markers
- Cloning and characterization of geranylgeranyl diphosphate synthetase from Pinus massoniana and its correlation with resin productivity