
Application of site-speci fic biomass models to quantify spatial distribution of stocks and historical emissions from deforestation in a tropical forest ecosystem
2018-03-27 12:10CedricGoussanouSabinGuendehouAchilleAssogbadjoBriceSinsin
Journal of Forestry Research 2018年1期
Cedric A.Goussanou·Sabin Guendehou,2·Achille E.Assogbadjo·Brice Sinsin
Introduction
The concentration of greenhouse gases(GHG)continues to increase in the atmosphere as a result of human activities(IPCC 2013;Houghton 2012).Because of the negative impact this change in chemical composition of the atmosphere has on climate change,mitigation actions are especially needed(IPCC 2006,2013;UNFCCC 2009;UNEP 2014)to re-duce global warming.Carbon sequestration by forest ecosystems has been identi fied as one promising solution(UNFCCC 2011;Wani 2014).The international community has given the opportunity to developing countries to contribute to the global efforts to combat climate change through the implementation of REDD+activities,including reducing emissions from deforestation and from forest degradation,conserving forest carbon stocks,sustainably managing forests and enhancing forest carbon stocks(UNFCCC 2009,2011).One of the requirements to undertake these activities is to develop a forest reference emission level and/or forest reference level.Currently,according to the information reported to the secretariat of the United Nations Framework Convention on Climate Change(UNFCCC 2016),only few countries in Africa are engaged in the REDD+process.One of the dif ficulties identi fied was related to the lack of data and tools such as allome-tric equations as well as to the technical capacity to develop and apply such tools.
The knowledge of the distribution of carbon stocks accordingtolandusesandofthemitigationpotentialofforests is essential for ef ficient forest management.It contributes to the assessment of forest carbon stocks at a global scale.
Forest timber exploitation and establishment of cropland are among the main drivers of deforestation in Africa(FAO 2010;Vinya et al.2011;Ratnasingam et al.2014).As a result,in many areas,forests are no longer uniform ecosystems but include in different vegetation types such as natural forest,degraded forest and fallows.These last two types of vegetation offer the possibility to implement reforestation and forest management activities to reestablish the forest.The topic of assessments of forest carbon stocks has been addressed by several studies(Mohanraj et al.2011;Alvarez et al.2012;Tang et al.2012)but those conducted in Africa used default data and expert judgments(Ekoungoulou et al.2014;Liu et al.2014).To improve the assessment of carbon stocks and mitigation potential of African forests,the use of country-speci fic data and tools such as allometric equations is needed(Guendehou et al.2012;Goussanou et al.2016).
Hirataetal.(2008),Guoetal.(2010),Djomoetal.(2011),Liu et al.(2012,2014),Galeana-Pizaña et al.(2014)and Rudiyanto et al.(2015)have studied the distribution of carbon stocks in tropical regions using remote sensing,modelling and geographical information systems(GIS).But other studies(Wulder et al.2008;Du et al.2014;Vicharnakorn et al.2014;Chen et al.2015)reported that these approaches need also ground truth data for validation.
Forest distribution maps are available in Benin but these maps do not show the distribution of carbon stocks.These dis-tribution maps would be useful to develop a baseline in order to assess the performance of the implementation of mitiga-tion actions such as reducing emissions from deforestation and forest degradation,sustainably managing forests, con-serving and enhancing carbon stocks(UNFCCC 2011).
The objective of this study was to develop a carbon map for the Lama forest,a semi-deciduous forest in southern Be-nin using site-speci fic allometric equations and data.The study also intended to give examples of how the reference and the distribution of carbon stocks could be addressed at a sub-national level as a transition to national carbon mapping.Factors affecting variation of carbon stocks are also discussed.
Materials and methods
Study area
The study area was the Lama forest reserve,a semideciduous forest ecosystem located in southern Benin(Nagel et al.2004)between 6°55′and 7°00′Latitude North and 2°04′and 2°12′Longitude East.The map of the location of the study area was presented in Goussanou et al.(2016).The forest covers an area of 16,250 ha including 4777 ha of natural forest entirely protected,referred to as the ‘Noyau Central’.The climate is tropical moist(IPCC 2006).Monthly average temperatures vary from 25 to 29°C and the mean annual rainfall is 1200 mm.Monthly rainfalls exceed 100 mm except for January,February and March which are the warmest months.Two rainy seasons occur between mid-March and mid-July and between mid-September and mid-November.
The soil in the area is hydromorphic clayey vertisol(40–60%of clay)characterized by poor drainage and a pH range of 5–5.5 in the 0–30 cm horizon(Küppers et al.1998).The vegetation types include an undisturbed forest,a degraded forest and fallow(Bonou et al.2009).Land classi fication is based on the extent of historical deforestation activities that have affected the natural forest.Between 1946 and 1987,9000 ha of natural forest was converted to cropland(Emerich et al.1999).The undisturbed forest refers to the part of the study area that has remained intact while degraded forest and fallow refer to areas that were subject to less perturbations and severe disturbances respectively.Since the interruption of agricultural activities between 1986 and 1987,protection measures,including some afforestation activities through enrichment,have taken place in areas previously disturbed.Applying the default transition period of 20 years(IPCC 2006),degraded forest and fallow,which were in transition from cropland to forest land,have been classi fied forest since 2009 but under categories degraded and fallow.In 1986,the areas reported by von Bothmer etal.(1986)were 3784 ha forundisturbed forest,5827 ha for degraded forest,5800 ha for fallow land and 840 ha forplantation forest.The undisturbed and degraded forests are dominated by species such as Afzelia africana(Sm.),Ceiba pentandra(L.)Gaertner,Diospyros mespiliformis(Hochst.Ex A.DC.),Dialium guineense(Wild),Mimusops andongensis Hiern.(Sapotaceae),Celtis brownii(Rendle.),Holarrhena floribunda(G.Don)Durand et Schinz,Malachanta alnifolia(Bak)Pierre,Drypetes floribunda (Müll.Arg.)Hutch and Cynometra megalophylla Harms.The fallows are characterized by open canopy forests containing dominant species such as Anogeissus leiocarpa(DC.)Guill.&Perr.Lonchocarpus sericeus(Poir.)Kunth,Albizia zygia(DC.)J.F.Macbr.and Ficus sur(cv.Forssk.).The dominance of the tree species was determined on the importance value index(Goussanou et al.2016).The plantation is composed of species such as Tectona grandis and Gmelina arborea.
Sampling design and data collection
The sampling design followed the approach described by Guendehou et al.(2012)and Goussanou et al.(2016).Data on tree dimensions(ground diameter,dbh,diameter along the stem and height)and wood samples were collected between October 2013 and February 2014,in 45 plots of 50 m×50 m distributed across all vegetation types.The 45 plots were distributed proportional to the area of each vegetation type and this resulted in 20,10,and 15 plots established in the undisturbed forest,degraded forest and fallow respectively.The data collected and additional data from Guendehou et al.(2012)were used to develop species-speci fic and generic biomass models(Goussanou et al.2016).The collected samples were used to determine wood densities in the laboratory.
Computation of biomass and carbon stocks
Data from diameter at breast height(dbh)and stem height measurements were used as inputs to the twenty-three species-speci fic biomass models and generic model developed by previous studies(Guendehou et al.2012;Goussanou et al.2016)to estimate stem biomass.The stocks were calculated at plot level by applying the speci fic models to species for which models were developed and by using the generic model for non-dominant species for which enough data was not available to develop speci fic models.Stem biomass stock for each plot was derived following Eq.1 and for each vegetation type using Eq.2.The stem biomass stocks were multiplied by the available biomass expansion factor(BEF)and the root-to-shoot ratio(IPCC 2006;Mokany et al.2006)to derive the total aboveand below-ground biomass(Eq.3).Total biomass per ha for each vegetation type was the ratio of total biomass to the total area of the vegetation type.Biomass for all vegetation types was then summed to derive the biomass of the whole stand.
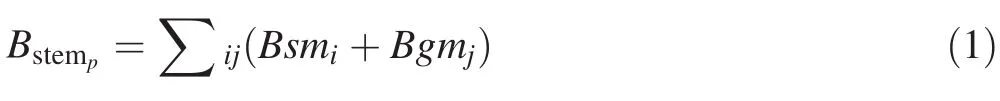
where Bstemp=biomass stock in plot p,Bsmi=biomass stock derived from speci fic model applied to dominant species i(kg),Bgmj=biomass stock derived from generic model applied to non-dominant species j(kg).
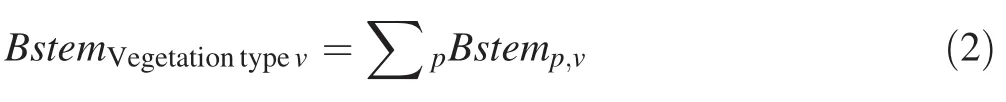
where Bstemvegetationtypev=total stem biomass of vegetation type v,Bstemp,v=stem biomass stock in plot p belonging to vegetation v

where,TBvegetationtypev=total above and below ground biomass stock of vegetation type v(kg),BEF=biomass expansion factor,3.4(IPCC 2006),R=root-to-shoot ratio,0.24(IPCC 2006).
The biomass was converted to carbon stock using the average carbon content(48.7±0.8%dry matter)derived from Guendehou et al.(2012).
Data analysis
The structure of the forest with respect to the distribution of tree density and basal area,according to diameter classes within and across vegetation types,was assessed by graphical observations using the statistical computing software R(R Development Core Team 2012)(Fig.1).
The variation of biomass stock within and between vegetation types was analyzed and correlated with parameters including tree density,basal area and stem height.Density refers to the average number of trees per plot and basal area is the sum of the cross-sectional area at 1.3 m above the ground level of all trees in a plot(Bonou et al.2009).In order to perform this analysis,all data(stem density,basal area and biomass)were distributed in five diameter classes: ≤15,15–30,30–45,45–50,>50 cm.Individuals for which the dbh was≤15,were considered small trees according to the National Of fice of Wood.
ArcGIS 10 was used to map the distribution of carbon stocks according to vegetation type using the map of the Lama forest developed by Bonou et al.(2009).From vector format of vegetation map,we added attribute fields ‘type of vegetation’, ‘area’and ‘carbon’.The attribute ‘type of vegetation’referred to undisturbed forest,degraded forest and fallow.The attribute ‘area’was the measure of each unit of vegetation type.The attribute ‘carbon’was obtained as a multiplication of the attribute ‘area’of the‘type of vegetation’by the mean value of the carbon stock associated with the vegetation type concerned.These vegetation layers with all attributes were stored in the GIS for visualization.The vegetation layer was display based on the attribute ‘carbon’.The carbon stocks were distributed in nine classes:<10,10–15,15–20,20–25,25–30,30–35,35–40,40–45,>45 t C/0.25 ha(Fig.2).The ranges were derived based on the carbon estimated at the plot level(Table 2).
Results
Forest structure

Fig.1 Distribution of tree density(a)basal area(b)and total biomass(c)according to diameter classes across vegetation types

Fig.2 Map of carbon stocks in Lama Forest Reserve
There were no signi ficant differences with respect to species richness across vegetation types.Thirty-eight,37 and 36 species were identi fied in undisturbed forest,degraded forest and fallow respectively(Table 1).Low values of Shannon diversity index indicated less diverse species communities across vegetation types while Pielou evenness values revealed that species were somewhat evenly distributed in the vegetation types.Large differences were not observed with respect to Shannon diversity and species evenness(Table 1).
In each vegetation type,the lowest tree density was found in higher diameter classes,suggesting that more individuals were detected in lower diameter classes.There was a relatively good representation of trees for diameter classes less than 30 cm.The density is higher in undisturbed forest (542 stem ha-1) than in fallow(349 stem ha-1)and in degraded forest(340 stem ha-1)(Table 1,Fig.1).Nearly 50%of trees measured in alldiameter classes were located in the undisturbed forest.Large variations of density and basal area among vegetation type were observed.
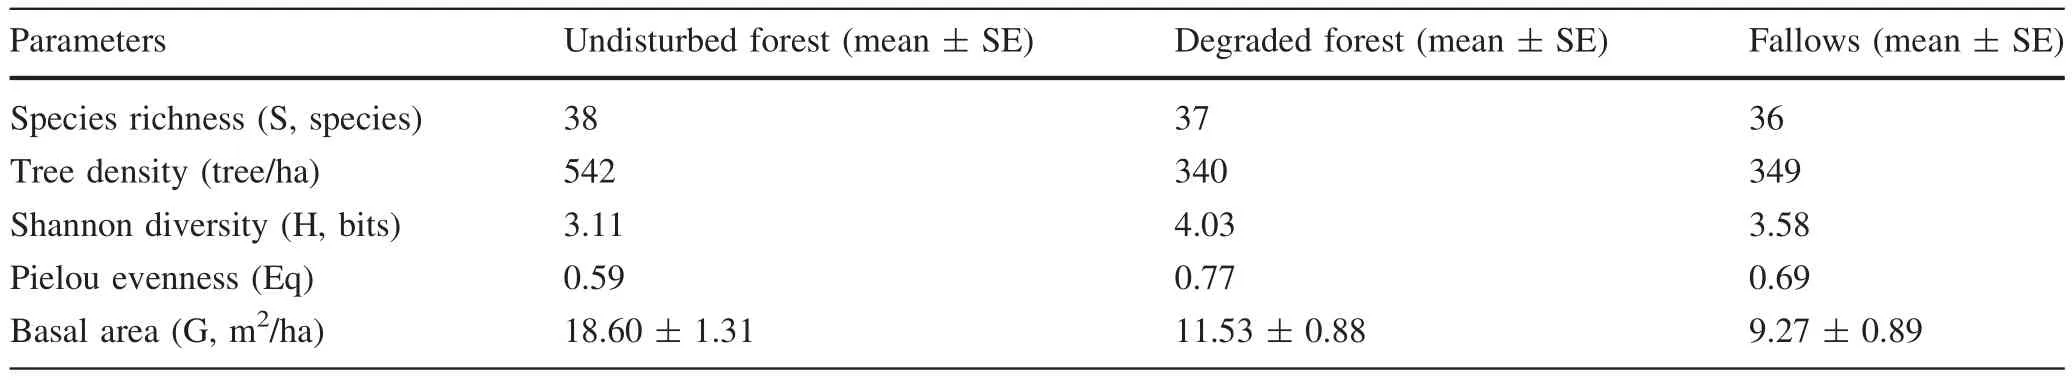
Table 1 Vegetation type characteristics
Basal area varied signi ficantly between vegetation types ranging from 9.27 m2ha-1(fallow)to 18.60 m2ha-1(undisturbed forest)(Table 1).In fallow and degraded forest,diameter classes between 15 and 30 cm contained higher values of basal area which decreased in high diameter classes(Fig.1).In undisturbed forest the increase in basal area from lower to higher diameter classes was observed.
In summary,tree density and basal area were the parameters which affected the most the distribution of biomass and carbon stocks in the forest(Table 1).
Biomass and carbon stocks
In general,in all vegetation types the lowest biomass was found in lower diameter classes.In undisturbed forest,the distribution of biomass according to dbh classes showed an increasing trend,suggesting that the higher diameter classes,the higher the biomass and that large proportions of biomass were located in larger trees(Fig.1).Across all dbh classes,more than 50%of the total biomass in the forest was found in the undisturbed forest(Fig.1).Carbon stock in all plots in the undisturbed forest was higher in comparison to that in the degraded forest and fallow(Tables 2,3).Carbon stock in the degraded forest was higher in the middle diameter classes and decreased slightly for higher diameter classes.With regard to the fallow area,the carbon stock was almost constant for dbh>10 cm.Diameter classes between 15 and 50 cm contributed the most to biomass storage.
The plot that contained the highest biomass(257.74 t dm)was in the undisturbed forest and the one with the lowest(17.57 t dm)was in the fallow(Table 2).The observed order of magnitude of the average total biomass per plot was:undisturbed forest>degraded forest>fallow(Table 2).
In each vegetation type,there was large variation of biomass stock across plots(Table 2).The estimated coefficient of variation(CV)was 27%for undisturbed forest,32%for degraded forest and 48%for fallow.The biomass per ha in the undisturbed forest was 2.7 times and 3.4 times higher than stocks estimated in the degraded forest and fallow respectively(Tables 2,3).
Emissions from historical deforestation
Deforestation activities that took place in the Lama forest between 1946 and 1987 converted 9000 ha of natural forest into cropland(Emerich et al.1999).Assuming that all the biomass was entirely removed during the conversion and considering the carbon stock per ha in Table 3,the emissions from historical deforestation amounted to 260 563.17 t CO2/year.Enough data was not available to quantify the emissions from other carbon pools including dead organic matter and soil.
Discussion
Forest structure
The low values of tree density observed in the degraded forest and fallow could be interpreted as the result of historical anthropogenic activities,including harvesting and agriculture that modi fied the structure of the forest.Emerich et al.(1999)reported that nearly 9000 ha of natural forest were converted into cropland.Harvesting was also reported by Lokonon(2008).The predominance of trees in lower diameter classes,i.e.younger trees(Fig.1a)is very interesting for the survival of the forest.This could be explained as a positive effect of the protection measures implemented over several years which enable the regeneration of the forest.The higher potential of regeneration in the undisturbed forest was in line with(Jayakumar and Nair 2013;Kimaro and Lulandala 2013),suggesting that disturbed forests take time to regenerate in the absence of management.Mean values of tree density obtained in this study were 155,330 and 188%higher than the values reported by Emrich et al.(1999),Bonou et al.(2009),and Vitoule(2012)respectively.This may be explained by the diameter size(dbh≥5 cm)considered in our study,whereas dbh≥10 cm was considered for the other studies.Data collected in this study has revealed that species richness and diversity have been reestablished following protective measures,including afforestation activities,indicating a homogenous repartition of species in the Lama forest.The basal area in this study was higher than those previously found by Bonou et al.(2009)and Vitoule(2012)due to probable differences in sampling,in particular in this study trees in lower diameter classes.The combined effect of high tree density observed in lower diameter classes and presence of large trees in undisturbed forest explains the high basal area detected in undisturbed forest.
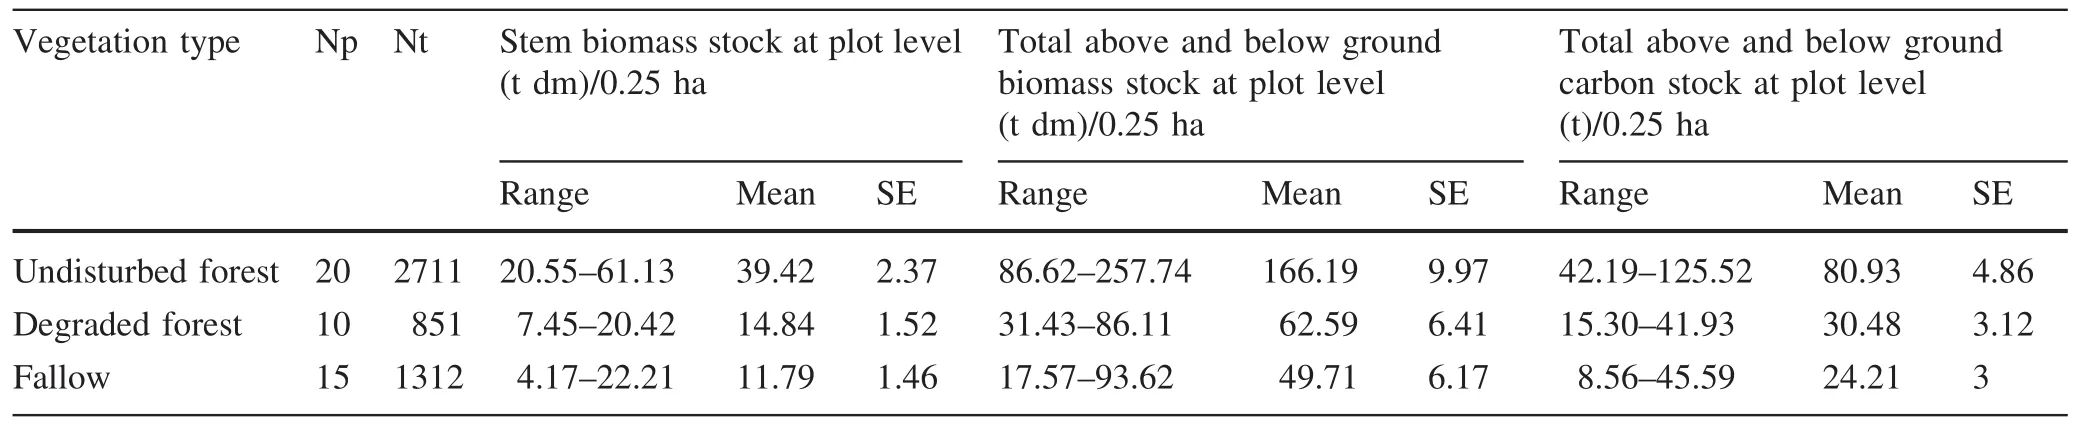
Table 2 Distribution of stem biomass(t dm)and total above and below ground biomass(t dm)across plots
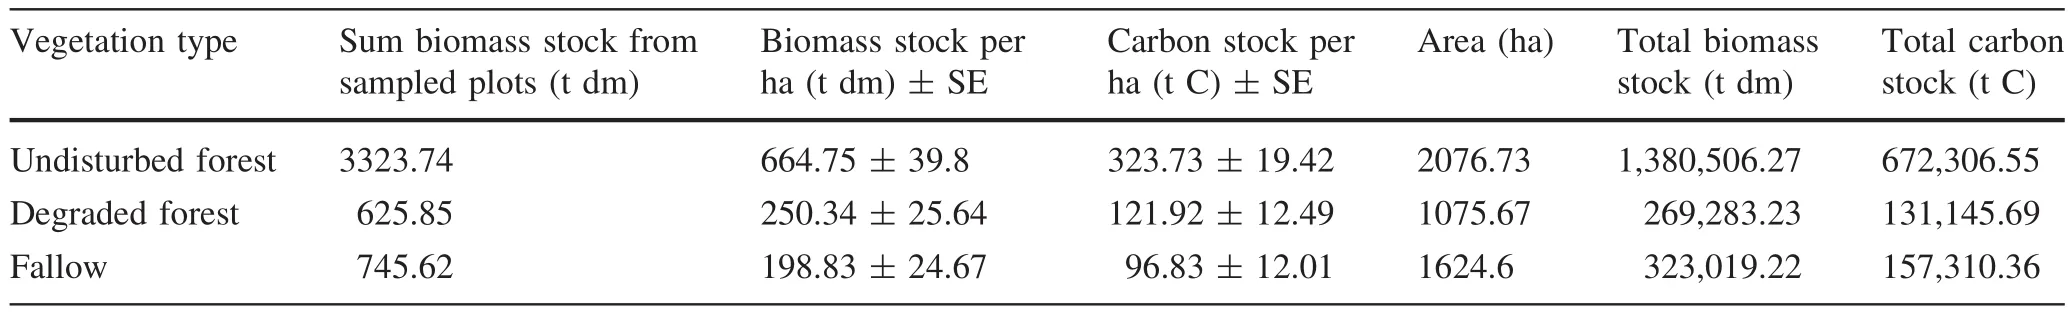
Table 3 Distribution of total biomass and carbon stock across vegetation types
Biomass and carbon stocks
The biomass of the three forest types(undisturbed forest,degraded forest and fallow)fall within the range(50–749 t dm ha-1)reported in other studies conducted in tropical forests(Clark et al.2001,Cummings et al.2002;Sierra et al.2007;Lewis et al.2009;Djuikouo et al.2010;Djomo et al.2011;Lewis et al.2013).The above-ground biomass reported by IPCC(2006)for tropical moist deciduous forest in Africa was 260 t dm ha-1(IPCC range 160–430).The above-ground biomass for undisturbed forest(536.10 t dm ha-1)from Table 3 using the root-to-shoot ratio(0.24)of IPCC(2006)was 33%higher than the upper limit of the IPCC range.The above-ground biomass for degraded forest and fallow(201.89 and 160.35)were within the IPCC range.The higher biomass in the undisturbed forest may be attributed to the fact that this forest is semi-deciduous while IPCC values were applicable to deciduous forests.Lower biomass stocks found in the degraded forest and fallow were apparently a direct consequence of historic deforestation and degradation activities implemented between 1946 and 1987 affecting tree density.Variation of biomass due to historical disturbances has been demonstrated by others(Chazdon 2003;Mani and Parthasarathy 2009;Omeja et al.2012;Lindner and Sattler 2012;Hernández-Stefanoni et al.2014;Lin et al.2015;Osazuwa-Peters et al.2015)who reported higher biomass in preserved areas than on former clear-cut sites in tropical regions The higher biomass in undisturbed forest could be explained by higher tree density and also the presence of trees with high potential of carbon storage,including Afzelia africana,Cassipourea congoensis,Ceiba pentandra,Dialium guineense,Diospyros abyssinica and Diospyros mespiliformis,already reported by Guendehou et al.(2012)and Goussanou et al.(2016).The proportion of higher biomass found in higher diameter classes con firmed that large trees contribute signi ficantly to carbon storage and should not be excluded from sampling for forest carbon estimation.This finding was consistent with results from Alves et al.(2010)and Lindner(2010).
Emissions from historical deforestation
Countries such as Brazil,Colombia and Guyana have submitted emissions associated with deforestation in the context of REDD+and have gone through the technical assessment process of the UNFCCC secretariat(UNFCCC 2016).The emissions associated with deforestation reported in this study(260,563.17 t CO2/year)were lower than those reported by Brazil(907,959,466 tCO2/year),Colombia (51,599,618.7 t CO2/year) and Guyana(46,301,251 t CO2/year).The differences may be explained by national circumstances such as the area deforested,the period of the historical deforestation and the forest types.Under REDD+few countries in Africa have started the preparation of the forest reference emission levels and published data are not at the moment available to make a comparison with our study.
Conclusions
This study is an example of the application of biomass models to derive forest carbon stocks,their spatial distribution and historical emissions associated with deforestation.From the distribution of biomass according to diameter classes,the study con firmed that trees in higher diameter classes should not be ignored when developing a sampling approach to estimate carbon stocks in forest ecosystems.The approach applied in this study could be used as a basis for establishing forest reference emission levels(FREL)or forest reference levels(FRL)in the context of REDD+.In order to quantify emissions from deforestation and to develop a national FREL/FRL,historical data on changes in forest area as well as biomass models for other ecosystems would be required.National FREL/FRL also requires the inclusion of other REDD+activities(reducing emissions from forest degradation,conservation of forest carbon stocks,sustainable management of forests,and enhancement of forest carbon stocks)and carbon pools including dead organic matter and soil.
AcknowledgementsWe thank the Permanent Interstates Committee for Drought Control in the Sahel(CILSS)and the Regional Centre AGRHYMET for the technical assistance provided during the implementation phase of the project.
Alvarez E,Duque A,Saldarriaga J,Cabrera K,de las Salas G,del Valle I,Lema A,Moreno F,Orrego S,Rodríguez L(2012)Tree above-ground biomass allometries for carbon stocks estimation in the natural forests of Colombia.For Ecol Manag 267:297–308
Alves LF,Vieira SA,Scaranello MA,Camargo PB,Santos FAM,Joly CA,Martinelli LA(2010)Forest structure and live aboveground biomass variation along an elevational gradient of tropical Atlantic moist forest(Brazil).For Ecol Manag 260:679–691
Bonou W,GlèlèKakai R,Assogbadjo AE,Fonton HN,Sinsin B(2009)Characterisation of Afzelia africana(Sm.)habitat in the Lama forest reserve of Benin.For Ecol Manag 258:1084–1092
Chazdon RL(2003)Tropical forest recovery:legacies of human impact and natural disturbances.Perspect Plant Ecol Evol Syst 6:51–71
Chen YQ,Liu ZF,Rao XQ,Wang XL,Liang CF,Lin YB,Zhou LX,Cai XA,Fu SL(2015)Carbon storage and allocation pattern in plant biomass among different forest plantation stands in Guangdong,China.Forests 6:794–808
Clark DA,Brown S,Kicklighter DW,Chambers JQ,Thomlinson JR,Ni J,Holland EA(2001)Net primary production in tropical forests:an evaluation and synthesis of existing field data.Ecol Appl 11:371–384
Cummings DL,Kauffman JB,Perry DA,Hughes RF(2002)Aboveground biomass and structure of rainforests in the southwestern Brazilian Amazon.For Ecol Manag 163:293–307
Djomo AN,Knohl A,Gravenhorst G(2011)Estimations of total ecosystem carbon pools distribution and carbon biomass current annual increment of a moist tropical forest.For Ecol Manag 261(8):1448–1459
Djuikouo MNK,Doucet JL,Nguembou CK,Lewis SL,SonkéB(2010)Diversity and aboveground biomass in three tropical forest types in the Dja Biosphere Reserve,Cameroon.Afr J Ecol 48:1053–1063
Du L,Zhou T,Zou ZH,Zhao X,Huang KC,Wu H(2014)Mapping forest biomass using remote sensing and national forest inventory in China.Forests 5:1267–1283.doi:10.3390/f5061267
Ekoungoulou R,Liu XD,Ifo SA,Loumeto JJ,Folega F(2014)Carbon stock estimation in secondary forest and gallery forest of Congo using allometric equations.Int J Sci Technol Res 3:465–474
Emrich A,Mühlenberg M,Steinhauer-Burkart B,Sturm H(1999)Evaluation écologique intégrée de la forêt naturelle de la Lama en République du Bénin.Rapport de synthèse.[Integrated ecological assessment of the natural Lama forest in Benin Republic.Synthesisreport.].ONAB-Kfw-GTZ.Cotonou,Bénin,74 pages+annexes
FAO(2010)Global forest resources assessment 2010.Food and Agriculture Organization of the United Nations,Rome
Galeana-Pizaña JM,López-Caloca A,López-Quiroza P,Silván-Cárdenas JL,Couturier S(2014)Modeling the spatial distribution of above-ground carbon in Mexican coniferous forests using remote sensing and a geostatistical approach.Int J Appl Earth Obs Geoinf 30:179–189
Goussanou CA,Guendehou S,Assogbadjo AE,Kaire M,Sinsin B,Cuni-Sanchez A(2016)Speci fic and generic stem biomass and volume models of tree species in a West African tropical semideciduous forest.Silva Fenn.doi:10.14214/sf.1474
Guendehou GHS,Lehtonen A,Moudachirou M,MäkipääR,Sinsin B(2012)Stem biomass and volume models of selected tropical tree species in West Africa.South For 74(2):77–88
Guo ZD,Fang JY,Pan YD,Birdsey R(2010)Inventory-based estimates of forest biomass carbon stocks in China:a comparison of three methods.For Ecol Manag 259:1225–1231
Hernández-Stefanoni JL,Dupuy JM,Johnson KD,Birdsey R,Tun-Dzul F,Peduzzi A,Caamal-Sosa JP,Sánchez-Santos G,López-Merlín D(2014)Improving species diversity and biomass estimates of tropical dry forests using airborne LiDAR.Remote Sens 6:4741–4763
Hirata R,Saigusa N,Yamamoto S,Ohtani Y,Ide R,Asanuma J,Gamo M,Hirano T,Kondo H,Kosugi Y,Li SG,Nakai Y,Takagi K,Tani M,Wang HM(2008)Spatial distribution of carbon balance in forest ecosystems across East Asia.Agric For Meteorol 148:761–775
Houghton RA(2012)Carbon emissions and the drivers of deforestation and forest degradation in the tropics.Curr Opin Environ Sustain 4(6):597–603
IPCC(Intergovernmental Panel on Climate Change)(2006)2006 IPCC guidelines for national greenhouse gas inventories,prepared by the National Greenhouse Gas Inventories programme.In:Eggleston HS,Buendia L,Miwa K,Ngara,Tanabe K(eds)IGES,Japan
IPCC(Intergovernmental Panel on Climate Change)(2013)Climate Change 2013:The physical science basis.Fifth assessment report(AR5)
Jayakumar R,Nair KKN(2013)Species diversity and tree regeneration patterns in tropical forests of the Western Ghats,India.International Scholarly Research Notices Ecology.doi:10.1155/2013/890862
Kimaro J,Lulandala L(2013)Human in fluences on tree diversity and composition of a coastal forest ecosystem:the case of Ngumburuni forest reserve,Ru fiji,Tanzania.Int J For Res.doi:10.1155/2013/305874
Küppers K,Sturm HJ,Emrich A,Horst MA(1998)Evaluation é cologique intégrée de la forêt naturelle de la Lama en République du Bénin.Rapport sur la flore et la sylviculture.Elaborépour le compte du projet«Promotion de l’économie forestière et du bois»[Integrated ecological assessment of the natural Lama forest in Benin Republic.Report on flora and sylviculture elaborated for the Project « Promotion de l’économie forestière et du bois»]PN 95.66.647.Of fice National du Bois(ONAB),KfW and GTZ
Lewis SL,Lopez-Gonzalez G,SonkéB,Affum-Baffoe K,Baker TR,Ojo LO,Phillips OL,Reitsma JM,White L,Comiskey JA,Djuikouo M-NK,Ewango CEN,Feldpausch TR,Hamilton AC,Gloor M,Hart T,Hladik A,Lloyd J,Lovett JC,Makana J-R,Malhi Y,Mbago FM,Ndangalasi HJ,Peacock J,Peh KSH,Sheil D,Sunderland T,Swaine MD,Taplin J,Taylor D,Thomas SC,Votere R,Wöll H(2009)Increasing carbon storage in intact African tropical forests.Nature 457:1003–1007
Lewis SL,Sonke B,Sunderland T,Begne SK,Lopez-Gonzalez G,van der Heijden GMF,Phillips OL,Affum-Baffoe K,Banin L,Bastin JF,Beeckman H,Boeckx P,Bogaert J,De Canniere C,Chezeau E,Clark CJ,Collins M,Djagbletey G,Droissart V,Doucet JL,Feldpausch TR,Foli E,Gillet JF,Hamilton AC,de Haulleville T,Hladik A,Harris DJ,Hart TB,Hufkens K,Huygens D,Jeanmart P,Jeffrey K,Kamdem MN,Kearsley E,Leal ME,Llloyd J,Lovett J,Makana JR,Malhi Y,Marshall AR,Ojo L,Peh KSH,Pickavance G,Poulsen J,Reitsma JM,Sheil D,Simo M,Steppe K,Taedoumg HE,Talbot J,Taplin J,Taylor D,Thomas SC,Toirambe B,Verbeec H,Votere R,WhiteLJT,WilcockS,WoellH,ZemaghoL (2013)Above ground biomass and structure of 260 African tropical forests.Philos Trans R Soc Lond B Biol Sci 368(1625):20120295
Lin DM,Lai JS,Yang B,Song P,Li N,Ren HB,Ma KP(2015)Forest biomass recovery after different anthropogenic disturbances:relative importance of changes in stand structure and wood density.Eur J For Res 134(5):769–780
Lindner A (2010)Biomass storage and stand structure in a conservation unit in the Atlantic Rainforest—the role of big trees.Ecol Eng 36:1769–1773
Lindner A,Sattler D(2012)Biomass estimations in forests of different disturbance history in the Atlantic Forest of Rio de Janeiro,Brazil.New For 43:287–301
Liu SN,Zhou T,Wei LY,Shu Y(2012)The spatial distribution of forest carbon sinks and sources in China.Chin Sci Bull 57(14):1699–1707
Liu X,Ekoungoulou R,Loumeto JJ,Ifo SA,Bocko YE,Koula FE(2014)Evaluation of carbon stocks in above-and below-ground biomass in Central Africa:case study of Lesio-louna tropical rainforest of Congo.Biogeosci Discuss 11:10703–10735
Lokonon B(2008)Structure and ethnobotany of Dialium guineense(Willd.),Diospyros mespiliformis(Hochst.Ex A.Rich.)and Mimusops andongensis(Hiern.)populations in the Lama forest reserve(South-Benin).Agricultural engineer thesis dissertation,University of Abomey-Calavi
Mani S,Parthasarathy N(2009)Tree population and above-ground biomass changes in two disturbed tropical dry evergreen forests of peninsular India.Trop Ecol 50(2):249–258
Mohanraj R,Saravanan J,Dhanakumar S(2011)Carbon stock in Kolli forests,Eastern Ghats(India)with emphasis on aboveground biomass,litter,woody debris and soils.Forests 4:61–65
Mokany K,Raison JR,Prokushkin AS(2006)Critical analysis of root:shoot ratios in terrestrial biomes.Glob Change Biol 12:84–96
Nagel P,Sinsin B,Peveling R(2004)Conservation of biodiversity in a relic forest in Benin:an overview.Reg Basil 45:125–137
Omeja PA,Obua J,Rwetsiba A,Chapman CA(2012)Biomass accumulation in tropical lands with different disturbance histories:contrasts within one landscape and across regions.For Ecol Manag 269:293–300
Osazuwa-Peters OL,Chapman CA,Zanne AE(2015)Selective logging:does the imprint remain on tree structure and composition after 45 years?Conserv Physiol 3(1):cov012.doi:10.1093/conphys/cov012
R Development Core Team(2012)R:a language and environment for statistical computing.R Foundation for Statistical Computing,Vienna.ISBN 3-900051-07-0
Ratnasingam J,Ng’andwe P,Ioras F,Abrudan IV(2014)Forestry and forest products industries in Zambia and the role of REDD+initiatives.Int For Rev 16(4):474–484
Rudiyanto Setiawan BI,Arief C,Saptomo SK,Gunawan A,Kuswarman Sungkono,Indriyanto H(2015)Estimating distribution of carbon stock in tropical peatland using a combination of an empirical peat depth model and GIS.Procedia Env Sci 24:152–157
Sierra CA,Del Valle JI,Orrego SA,Moreno FH,Harmon ME,Zapata M,Colorado GJ,Herrera MA,Lara W,Restrepo DE,Berrouet LM,Loaiza LM,Benjumea JF(2007)Total carbon stocks in a tropical forest landscape of Porce region,Colombia.For Ecol Manag 243:299–309
Tang JW,Yin JX,Qi JF,Jepsen MR,LüXT(2012)Ecosystem carbon storage of tropical forests over limestone in Xishuangbanna,Sw China.J Trop Sci 24(3):399–407
UNEP(United Nations Environment Programme)(2014)Forests in a changing climate:a sourcebook for integrating REDD+into academic programmes.United Nations Environment Programme,Nairobi
UNFCCC (United Nations Framework Convention on Climate Change)(2009)Methodological guidance for activities relating to reducing emissions from deforestation and forest degradation and the role of conservation,sustainable management of forests and enhancement of forest carbon stocks in developing countries.In:Decision 4/CP.15,edited by:UNFCoC Change,Copenhagen,Denmark,UNFCCC
UNFCCC(United Nations Framework Convention on Climate Change)(2011)Synthesis and assessment report on the greenhouse gas inventories.United Nations Framework Conv Clim Chang(UNFCCC)201–248:2011
UNFCCC(United Nations Framework Convention on Climate Change)(2016)UNFCCC REDD+Web Platform.http://redd.unfccc.int/Accessed 18 May 2016
Vicharnakorn P,Shrestha RP,Nagai M,Salam AP,Kiratiprayoon S(2014)Carbon stock assessment using remote sensing and forest inventory datainSavannakhet,Lao PDR.RemoteSens 6:5452–5479
Vinya R,Syampungani S,Kasumu EC,Monde C,Kasubika R(2011)Preliminary study on the drivers of deforestation and potential for REDD+in Zambia.A consultancy report prepared for Forestry Department and FAO under the national UN-REDD+Programme Ministry of Lands and Natural Resources.Lusaka,Zambia
Vitoule E(2012)Structure of populations and ethnobotany of Drypetes floribunda(Müll.Arg.Hutch.)and Mimusops andongensis(Hiern.)in the Lama Forest Reserve.Master dissertation thesis,University of Abomey-Calavi
von Bothmer KH,Moumouni AM,Patinvoh P(1986)Plan Directeur de la Forêt Classée de la Lama.Projet de développement de l’économie forestière et production de bois[Master Plan for the classi fied forest Lama.Development project of forestry economy and wood production].Projet GTZ N°79.2038.2.01-200
Wani NR(2014)Carbon sequestration to mitigate climate change through forestry activities:an overview.N Y Sci J 7(3):20–24
Wulder MA,White JC,Fournier RA,Luther JE,Magnussen S(2008)Spatially explicit large area biomass estimation: three approaches using forest inventory and remotely sensed imagery in a GIS.Sensors 8:529–560
 Journal of Forestry Research2018年1期
- Journal of Forestry Research的其它文章
- Vascular bundle connection between seed stalk and seed coat of Caragana arborescens
- Mini-cutting technique for Khaya anthotheca:selection of suitable IBA concentration and nutrient solution for its vegetative propagation
- Reconstructing the size of individual trees using log data from cut-to-length harvesters in Pinus radiata plantations:a case study in NSW,Australia
- Phenotypic variation in Phoebe bournei populations preserved in the primary distribution area
- Effects of soil drought stress on photosynthetic gas exchange traits and chlorophyll fluorescence in Forsythia suspensa
- Flavonoid content and radical scavenging activity in fruits of Chinese dwarf cherry(Cerasus humilis)genotypes