
Influence of glucose concentration on blood opticalproperties in THz frequency range
2018-04-19 10:48GUSEVSviatoslavIgorevichDEMCHENKOPetrCHERKASOVAOlgaFEDOROVVyacheslavKHODZITSKYMikhail
中国光学 2018年2期
GUSEV Sviatoslav Igorevich, DEMCHENKO Petr S, CHERKASOVA Olga P, FEDOROV Vyacheslav I,3, KHODZITSKY Mikhail K*
(1.ITMO University,Saint-Petersburg 197101,Russia; 2.Institute of Laser Physics of SB RAS,Novosibirsk 630090,Russia; 3.Novosibirsk State Technical University,Novosibirsk 630073,Russia)
1 Introduction
Optical properties of whole blood are important parameters in biophysical investigations and medical diagnostics[1-2]. Variations in cellular and biochemical composition of whole blood markedly affect the values of different optical parameters like absorption, scattering, refractive index etc[1,3-6]. Such changes of optical properties can be valuable diagnostic signs as they reflect the dynamics of a particular pathological process. To apply this in diagnostics, it is necessary to investigate the influence of separate biochemical parameters on different optical characteristics of whole blood[7-8]. Among these parameters the blood glucose level is significantly important. It is a valuable predictor of diabetes mellitus[9].
At present, there is a trend to develop diagnostic method for blood glucose level estimation by THz time-domain spectroscopy(TDS)[10-11]. It was shown that the reflection from human skin varies according to the blood glucose level during a standard test for glucose tolerance. In addition, it was shown that the absorption coefficient and the refractive index of blood plasma of rats with severe experimental diabetes differ significantly from these parameters in normal rats and rats with mild diabetes[12]. The latter group of rats was characterized by significant deviations of biochemical parameters, such as glucose and corticosterone levels, from normal values[13-14].
As indicated above, the composition of blood can affect optical properties of blood plasma. It was shown that there is a inverse dependence between the THz absorption coefficients and the number of red blood cells[15-17]as well as between the sub-THz absorption coefficients and blood triglyceride concentration[15]. The development of non-invasive methods, requires studying the whole blood. Therefore, there is a need to investigate the effect of different glucose levels on the optical properties of whole blood.
There are some researches of glucose level sensing using optical coherence tomography(with sensor on the ear)[18], Raman spectroscopy(with sensor on the cornea)[19], time of flight[20-21]and others, but currently no one is available on market[22]. Moreover, each of them is bulky and expensive method. Glucose level sensing using THz TDS has promising prospects due to making THz technologies more cheap, effective, compact and stable, for example as in quasi-TDS technology[23].
It is still a lack of the data about the effect of human whole blood glucose levels on the refractive indices and absorption coefficients. This paper presents the results of transmission THz spectra measurements of whole blood of one person with diabetes mellitus during a short time period after insulin injection. These results will be useful for development of non-invasive method based on reflective signal measurement from nail bed.
2 Experimental setup
The optical properties of blood samples were studied in the frequency range of 0.1-1.0 THz using THz TDS in transmission mode[24-25]. The scheme of the setup is shown in the Fig.1.
Broadband pulsed THz radiation is generated by means of an InAs semiconductor in the magnetic field of 2.0 T by irradiating it with femtosecond pulses of an Yb∶KYW laser(wavelength of 1 040 nm, the pulse duration of 120 fs, the pulse repetition frequency of 75 MHz, the power of 1 W). THz radiation has the following output characteristics:the spectral range from 0.05 to 2.0 THz, the average power up to 30 W, the pulse duration of 2.7 ps. The main power is concentrated at the frequency range from 0.3 to 0.5 THz. THz radiation passes through a teflon filter(which cuts the wavelengths shorter than 50 μm). After that, the radiation passes through the sample fixed in a focal plane perpendicularly to the beam. THz pulse affects the anisotropy of the electrooptical CdTe crystal. As a result, the THz pulse induces birefringence of the probe beam in the crystal due to the electrooptical effect. The birefringence magnitude is directly proportional to the amplitude of terahertz radiation electric field in the time pointE(t). These data are required to calculateE(ω) using the Fourier transform.
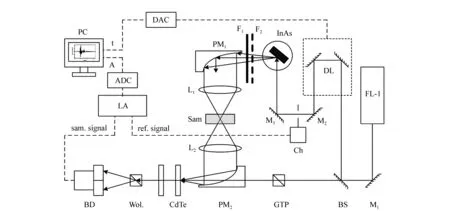
Fig.1 Schematic diagram of the setup(FL-1:femtosecond laser based on potassium-yttrium tungstate crystal activated with ytterbium(Yb∶KYW), generating femtosecond pulses; F1,2:a set of teflon filters for IR wavelength range cutting off, BS:beamsplitter, DL:optical delay line, M1,2,3:mirrors, Sam:investigated sample, Wol.:Wollaston prism, CdTe:electro optical cadmium-telluric crystal, BD:balanced detector, LA:lock-in amplifier, PC:personal computer, GTP:Glan-Taylor prism, PM1,2:parabolic mirrors, Ch:chopper, DAC:digital to analog converter, ADC:analog to digital converter
3 Sample preparation
In the experiment, 8 blood samples were used. Each sample had different glucose concentration. Investigated samples were obtained from the same person during short time period(about 2 hours). This fact helped us to provide the stable concentration of blood components(excluding glucose concentration) to avoid multiple dependences within the time of experiment. The study was performed in accordance with Good Clinical Practice(GCP) and with the 1964 Helsinki declaration and its later amendments.
The first step of sample preparation was increasing glucose level of the diabetic patient up to hyperglycemia level. It is quite a fast process so samples were obtained during the time of decreasing glucose level after insulin injection.
This experiment contained samples with the following glucose concentrations shown below in the Tab.1.

Tab.1 The list of the glucose concentrations ofsamples used in experiment
The glucose concentrations in the blood were measured twice per a sample using Abbott Freestyle Optium[26]glucometer. This electro-chemical glucometer model is widely used in clinical research[27].
The blood drops were located inside a special polymethyl methacrylate(PMMA) container(Fig.2, Fig.3).
In the middle, this container has a recess which is 75 μm in depth. This type of blood holder can keep stable thickness of a sample and protects biological fluid from drying. Moreover, PMMA is transparent for the THz radiation.
4 Data acquisition
For each sample, a time-amplitude transmission waveform was taken 100 times and averaged for each timepoint. In addition, transmission waveforms of air, bottom and top parts of container were measured. All the acquired waveforms were converted to their Fourier transformsE(ω), respectively. Then the THz electric field is:
E0(ω)e-iφ(ω),
(1)
wheref(t) is time-amplitude waveform,ωis angular frequency,E0(ω) is amplitude data,φ(ω) is phase data.
At the first step,TairandTref1waveforms were used for data calculation of the bottom part of container, andTairandTref2for the top part. At the second step,TairandTsamwere used for properties calculation of the container with blood. At the third step,Tref1,Tref2andTsamwere used to calculate the phase delay and amplitude decrease for the blood layer inside the container. As a result, the refractive indexncan be calculated for a sample inside the container. The real part of the refractive indexnrealis calculated as:
(2)
wherecis speed of light in vacuum,dis thickness of medium,fis frequency.
The absorption coefficientαis calculated using the amplitude data:
(3)
In addition, the penetration depthLis the reverse function to the absorption coefficientα:
(4)
The imaginary part of the refractive indexnimagrequires data about the absorption coefficientα:
(5)
Both parts of the permittivityεuse both parts of the refractive indexn:
(6)
εimag(f)=2nreal(f)nimag(f) .
(7)
All of these optical properties are available as results of Spectrina software[7].
5 Results and Discussion
Based on 8 biosamples, we have investigated the frequency dispersions ofnreal,α,εreal,εimagfromfin the THz range(as shown in Fig.4).
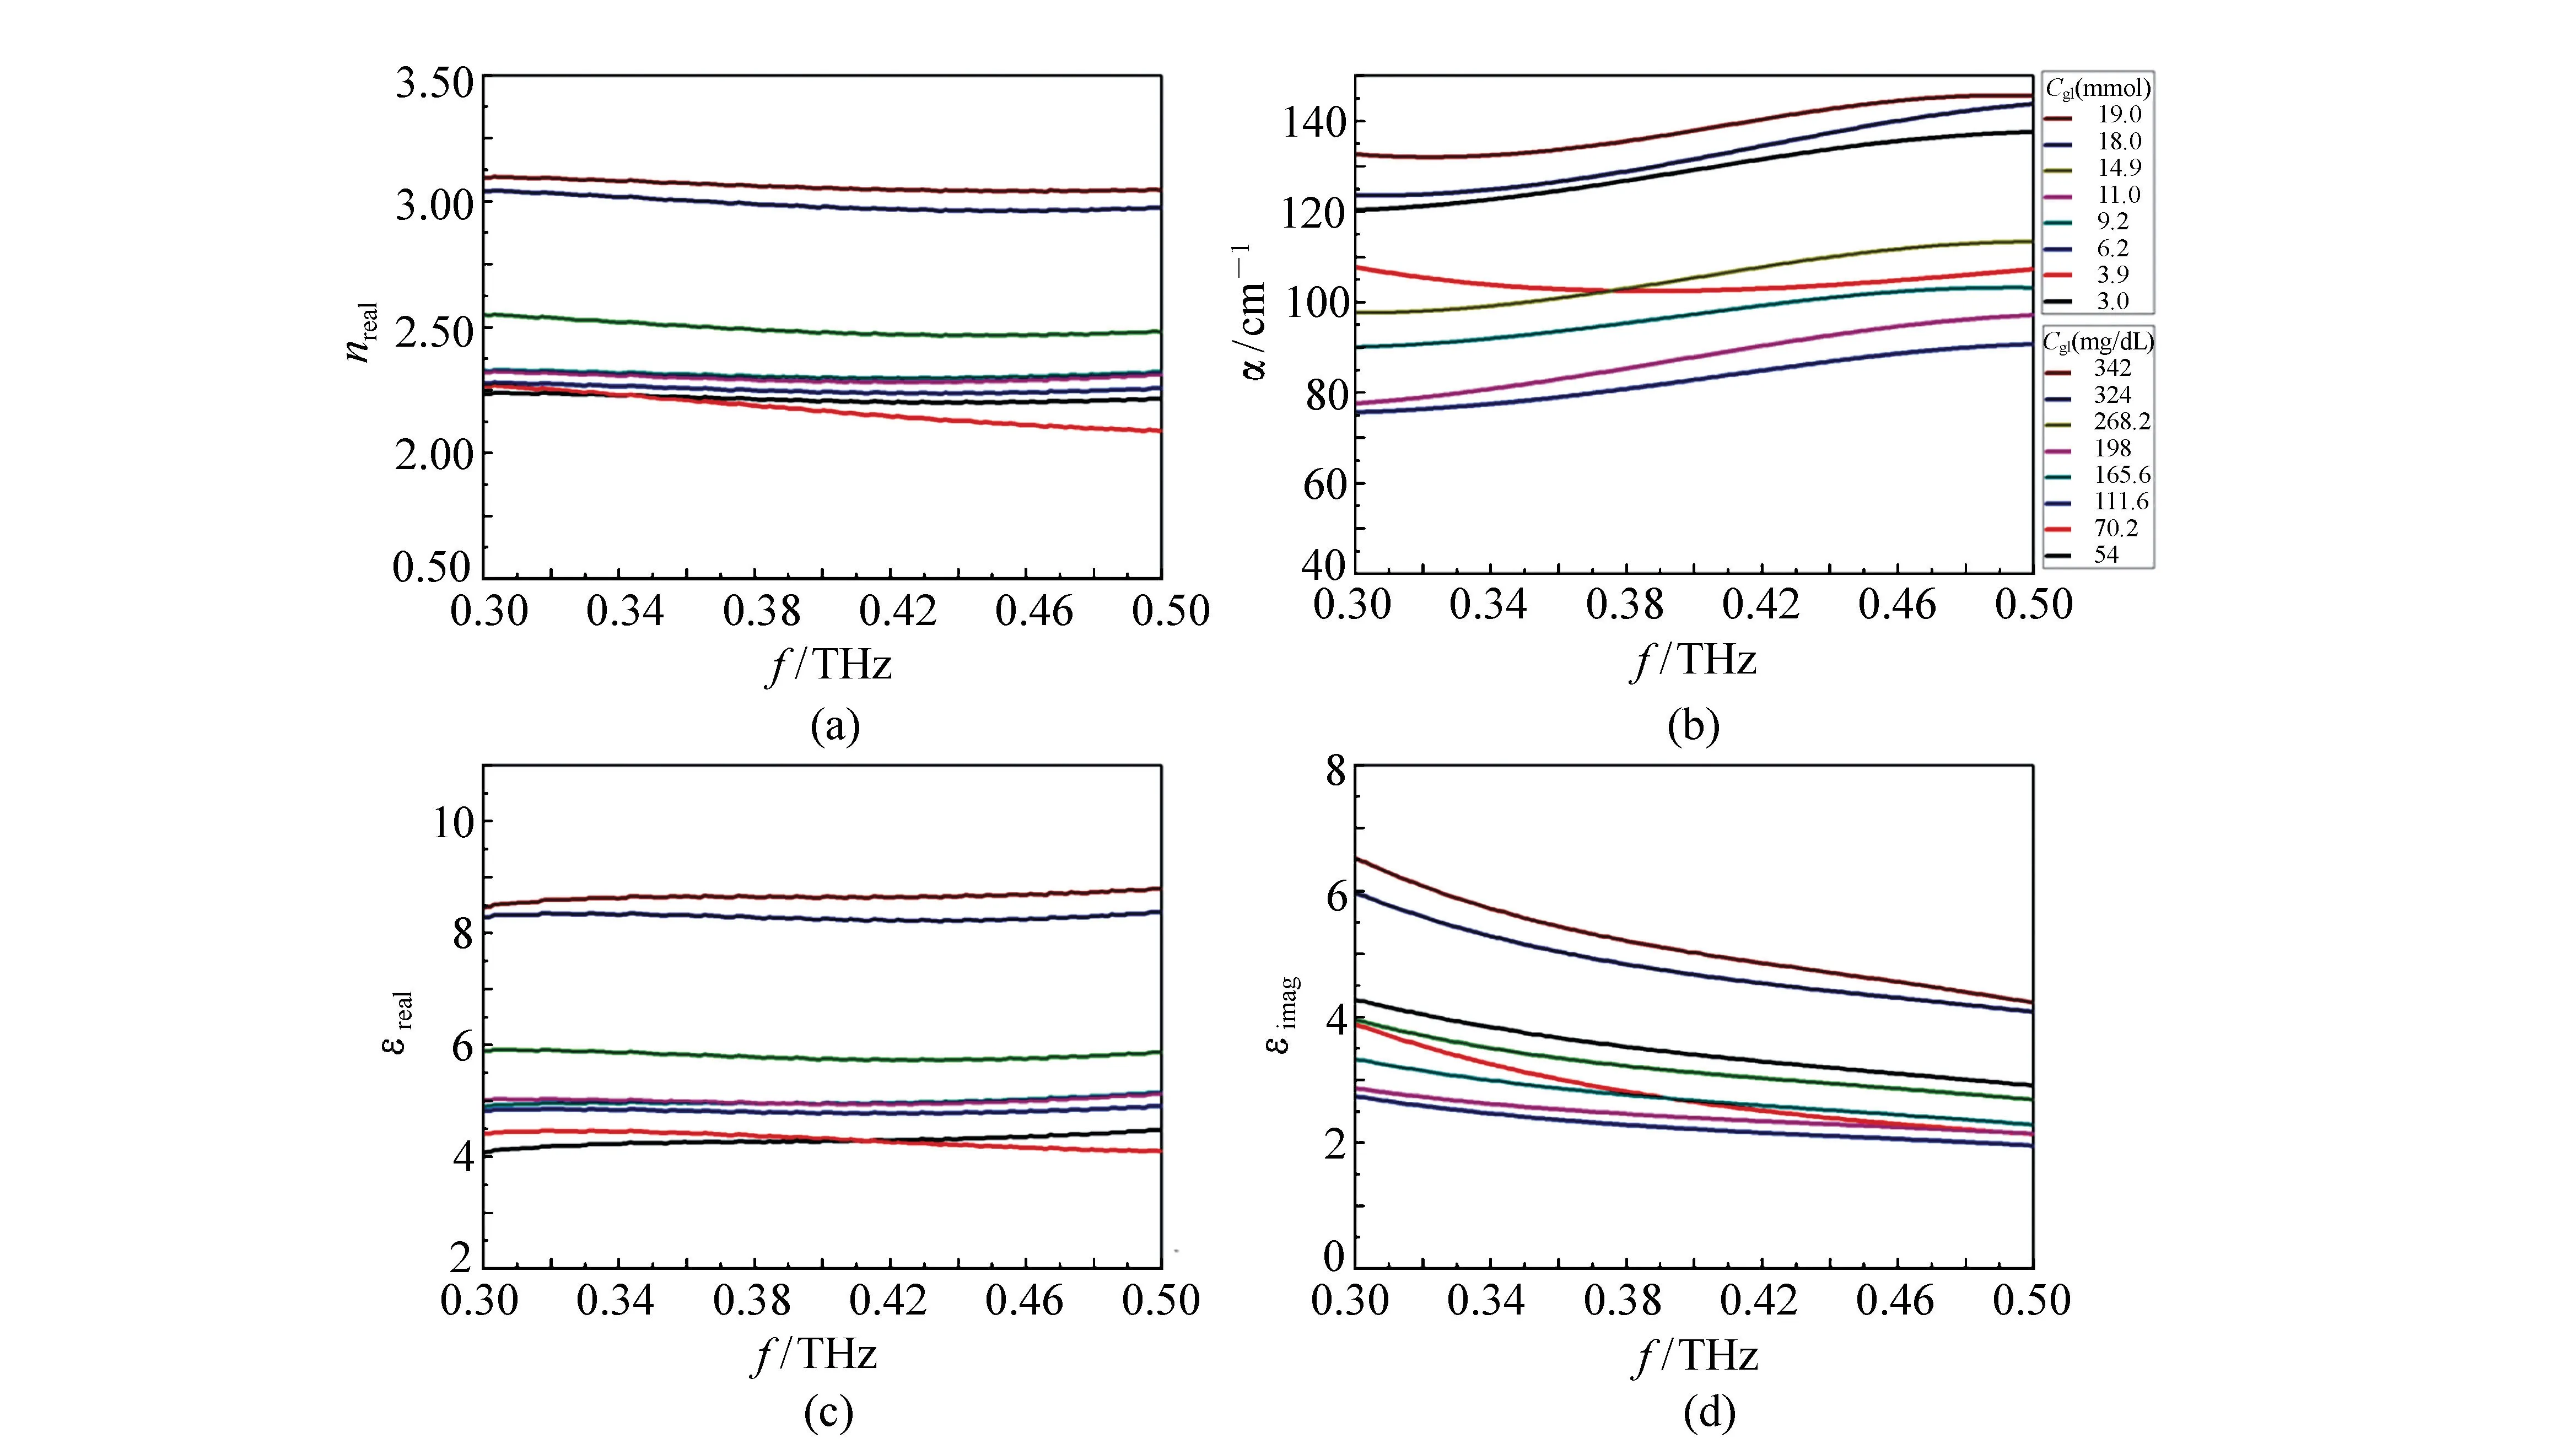
Fig.4 Dispersions of optical parameters of samples with different glucose concentration cglucose: (a)the real part of refractive index nreal(f); (b)the absorption coefficient α(f); (c)the real part of permittivity εreal(f); (d)the imaginary part of permittivity εimag(f)
After the data acquisition, the next step is to find dependencies between glucose concentrations and optical properties.
To determine the dependence of blood optical properties with glucose concentration we selected the stable experimental data at 0.3, 0.35 and 0.4 THz. Fig.5 shows the dependences of glucose concentration with real part of refractive index and with real part of permittivity.
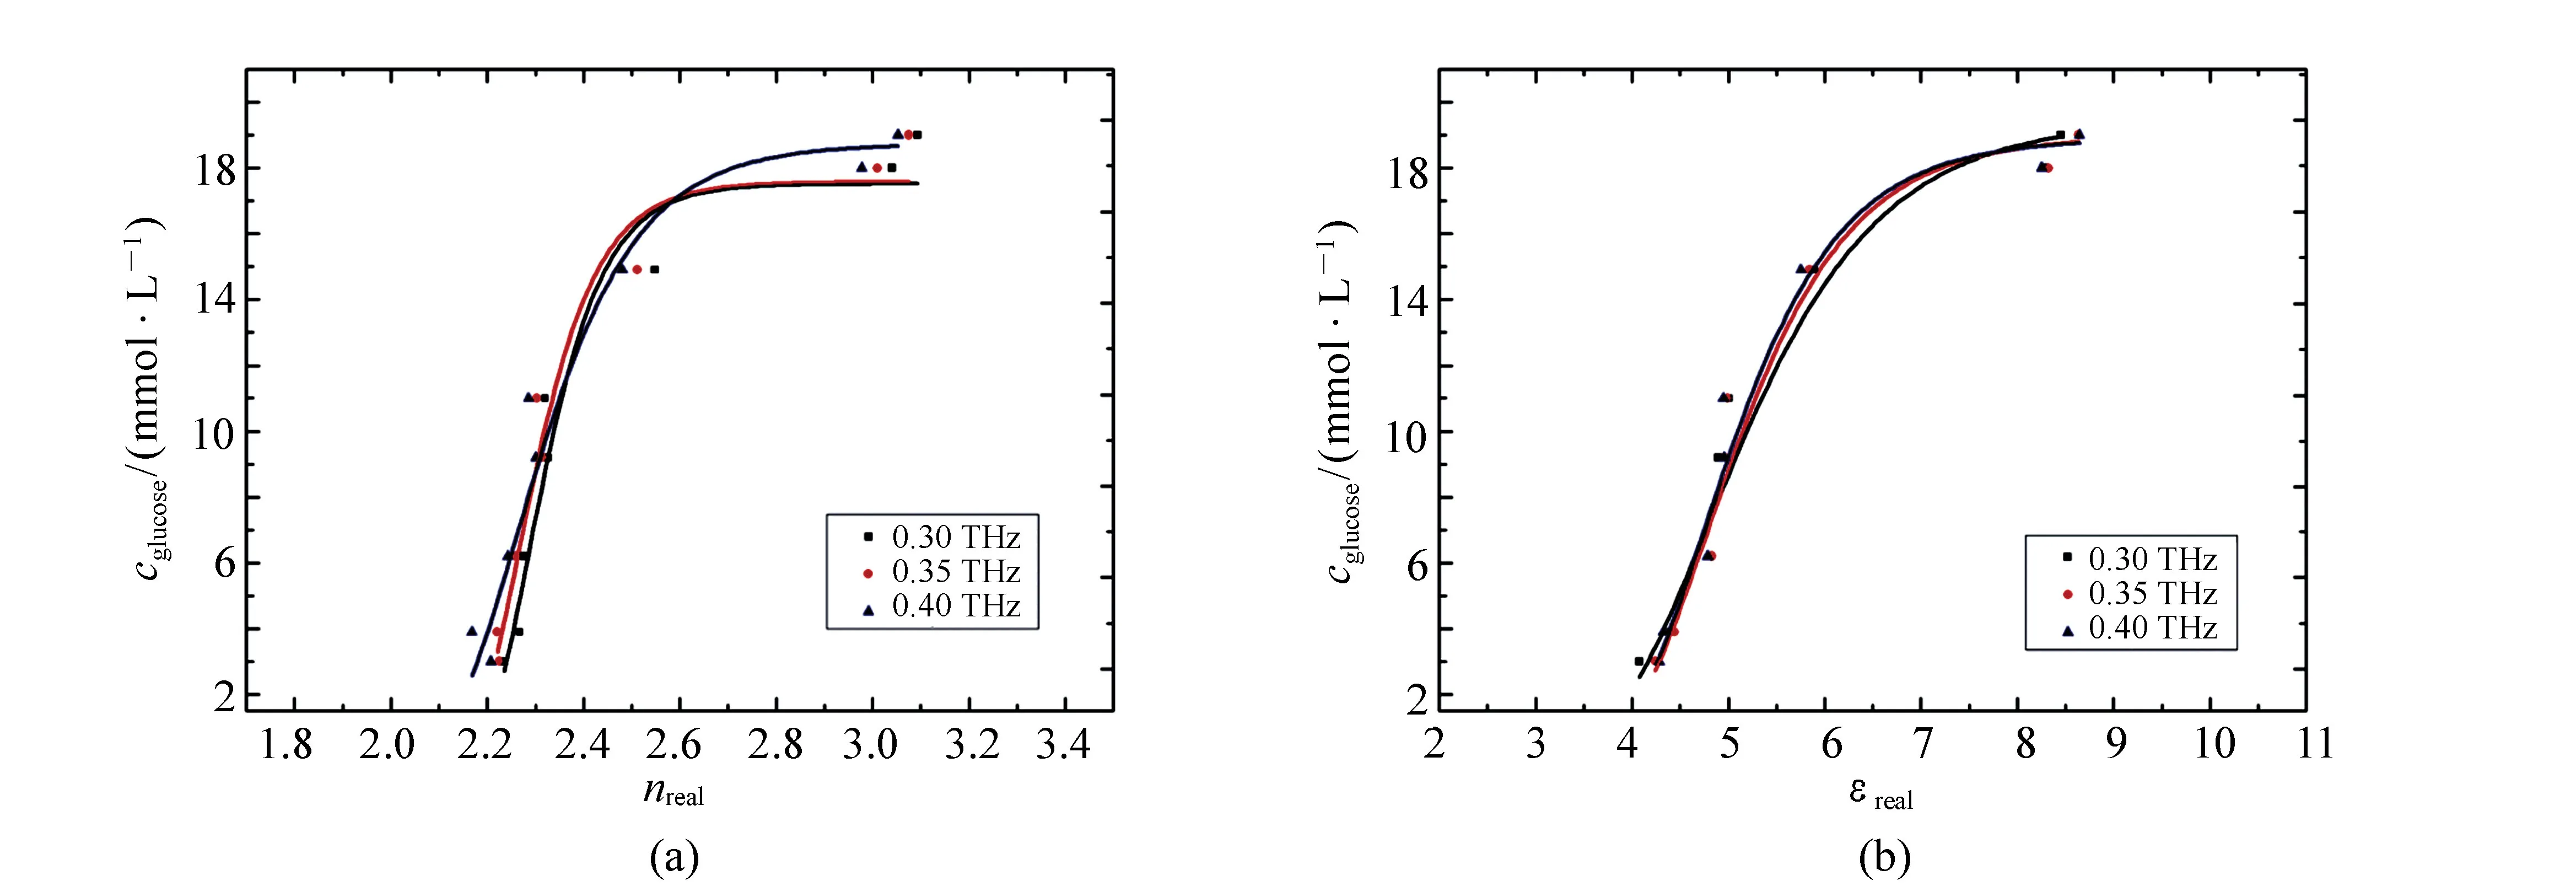
Fig.5 Dependencies of glucose concentration with (a) the real part of refractive index cglusose and (b)with the real part of permittivity cglucose(εreal) at different frequencies
The dependence is not linear with the blood glucose concentration above 16 mM/L. This may be due to the change in physical-chemical properties of blood components with high glucose concentration[28-29]. As known hyperglycemia caused by insulin deficiency is accompanied by a large loss of electrolytes, dehydration of tissues and osmolality increase of blood plasma.
By fitting the data with the Gompertz function, we found relationships on few frequencies.
Fromnat 0.30 THz:
cglucose(nreal)=17.517exp{-exp[-11.654(nreal-2.2883)]} ,
(8)
Fromnat 0.35 THz:
cglucose(nreal)=17.5698exp{-exp[-11.11506(nreal-2.26704)]} ,
(9)
Fromnat 0.40 THz:
cglucose(nreal)=18.716exp{-exp[-7.2434(nreal-2.2624)]} ,
(10)
Fromεat 0.30 THz:
cglucose(εreal)=19.426exp{-exp[-1.0065(εreal-4.7860)]} ,
(11)
Fromεat 0.35 THz:
cglucose(εreal)=18.9587exp{-exp[-1.2201(εreal-4.78379)]} ,
(12)
Fromεat 0.40 THz:
cglucose(εreal)=18.8836exp{-exp[-1.27206(εreal-4.74102)]} .
(13)
These dependencies indicates that quantitative blood glucose levels analysis is feasible by using TDS in THz frequency range. According to this, we can simulate glucose level analysis to make numerical modelling in reflective mode.
It should be noted that results cannot be suited into model of effective medium theory due to that model was developed for non-interacting components[30].
As a result, this work confirms the direction of dependence shown at our previous work[7], but this experiment used more accurate technique, that prevents blood drying and provides stable thickness of blood layer. In addition, we found mathematical functions to use these results in a numerical modelling process. Finally, this work contains wider range of dispersions: not only real part of refractive index, but also absorption coefficient, real and imaginary parts of permittivity.
These results will be used in numerical modelling purposes with software instruments like CST Studio, COMSOL Multiphysics and other. In addition, results of further experiments in reflective mode in the THz frequency range can be validated by these repeatable data.
At the other hand, the main task for now is increasing of specificity of signal for glucose molecules. We are going to do this by using effect of resonance at specific fingerprint frequencies.
6 Conclusion
The experiment contained 8 blood samples with different glucose concentrations. The frequency dispersions of optical properties of each biosample have been obtained. Based on the data, this paper indicates the dependences of glucose concentrationscglucosewith the real part of refractive indexnrealand real part of permittivityεreal. The dependences of this kind have been received for the first time in the THz frequency range. The results are helpful in the process of developing a spectroscopic method of blood glucose sensing.
During analysis of dependences it can be seen that model of inert substances mix is not applicable for this experiment. It can be explained due to permanent interaction of blood components.
Collected and calculated data will be useful for estimating quality of results of a non-invasive reflective spectroscopic glucose sensing technique. It will be possible by comparison of calibration curves of this experiment with following ones.
[1]NORTHAM L,BARANOSKI G. A novel first principles approach for the estimation of the sieve factor of blood samples[J].OpticsExpress,2010,18:7456-7469.
[2]REID C B,REESE G,GIBSON A P,etal.. Terahertz time-domain spectroscopy of human blood[J].IEEETransactionsonTerahertzScienceandTechnology,2013,3:363-367.
[3]TUCHIN V V.TissueOptics:LightScatteringMethodsandInstrumentsforMedicalDiagnosis[M]. CRC Press,2015.
[4]POPESCU D P,SOWA M G. In vitro assessment of optical properties of blood by applying the extended Huygens-Fresnel principle to time-domain optical coherence tomography signal at 1 300 nm[J].JournalofBiomedicalImaging,2008,7:591618.
[5]YIM D,BARANOSKI G V,KIMMEL B W,etal.. A cell-based light interaction model for human blood[J].WileyOnlineLibrary,2012,31:845-854.
[6]FITZGERALD A,BERRY E,ZINOV'EV N,etal.. Catalogue of human tissue optical properties at terahertz frequencies[J].JournalofBiologicalPhysics,2003,29:123-128.
[7]GUSEV S,BOROVKOVA M,STREPITOV M,etal.. Blood optical properties at various glucose level values in THz frequency range[J].EuropeanConferencesonBiomedicalOptics,2015:95372A.
[8]GUSEV S I,BALBEKIN N,SEDYKH E,etal.. Influence of creatinine and triglycerides concentrations on blood optical properties of diabetics in THz frequency range[J].JournalofPhysics:ConferenceSeries,2016,735:012088.
[9]CERIELLO A,COLAGIURI S. International diabetes federation guideline for management of postmeal glucose:a review of recommendations[J].DiabeticMedicine,2008,25: 1151-1156.
[10]CHERKASOVA O,NAZAROV M,SHKURINOV A. Noninvasive blood glucose monitoring in the terahertz frequency range[J].OpticalandQuantumElectronics,2016,48:1-12.
[11]CHERKASOVA O,NAZAROV M,BERLOVSKAYA E,etal.. Studying human and animal skin optical properties by terahertz time-domain spectroscopy[J].BulletinoftheRussianAcademyofSciences:Physics,2016,80:479-483.
[12]CHERKASOVA O,NAZAROV M,SMIRNOVA I,etal.. Application of time-domain THz spectroscopy for studying blood plasma of rats with experimental diabetes[J].PhysicsofWavePhenomena,2014,22:185-188.
[13]SELYATITSKAYA V,PALCHIKOVA N,KUZNETSOVA N,etal.. Adrenocortical system activity at highly and lowly resistant to alloxandiabetogenic action rats[J].FundamentalResearch,2011,3:142-147.
[14]SELYATITSKAYA V G,PALCHIKOVA N A,KUZNETSOVA N V. Adrenocortical system activity in alloxan-resistant and alloxan-susceptible wistar rats[J].JournalofDiabetesMellitus,2012,2:165.
[15]TSENG T F,YOU B,GAO H C,etal.. Pilot clinical study to investigate the human whole blood spectrum characteristics in the sub-THz region[J].OpticsExpress,2015,23:9440-9451.
[16]JEONG K,HUH Y M,KIM S H,etal.. Characterization of blood using terahertz waves[J].JournalofBiomedicalOptics,2013,18:107008-107008.
[17]ANGELUTS A,BALAKINA V,EVDOKIMOVM G,etal.. Characteristic responses of biological and nanoscale systems in the terahertz frequency range[J].QuantumElectronics,2014,44:614.
[18]LARIN K V,ELEDRISI M S,MOTAMEDI M,etal.. Noninvasive blood glucose monitoring with optical coherence tomography:a pilot study in human subjects[J].DiabetesCare,2002,25:2263-2267.
[19]TARR R V. Non-invasive blood glucose measurement system and method using stimulated raman spectroscopy:US,5243983[P].1993-09-14.
[20]THOMAS G H. Method and apparatus for non-invasive monitoring of blood glucose.US,5119819[P].1992-06-09
[21]POPOV A P,BYKOV A V,TOPPARI S,etal.. Glucose sensing in flowing blood and intralipid by laser pulse time-of-flight and optical coherence tomography techniques[J].IEEEJournalofSelectedTopicsinQuantumElectronics,2012,18:1335-1342.
[22]SMITH J.ThePursuitofNoninvasiveGlucose[M]. 5th Edition.[S.l.]:http://www.mendosa.com/noninvasive-glucose.pdf,2017.
[23]SCHELLER M,DÜRRSCHMIDT S F,STECHER M,etal.. Terahertz quasi-time-domain spectroscopy imaging[J].AppliedOptics,2011,50:1884.
[24]BESPALOV V G,GORODETSKIA,DENISYUK I Y,etal.. Methods of generating superbroad band terahertz pulses with femtosecond lasers[J].JournalofOpticalTechnology,2008,5:636-642.
[25]BESPALOV V G,GORODETSKY A A,GRACHEV Y V,etal.. Influence of THz broadband pulse radiation on some biotissues[J].ProceedingsofSPIE,2009,7547:754707.
[26]SHEFFIELD C A,KANE M P,BAKST G,etal.. Accuracy and precision of four value-added blood glucose meters:the Abbott Optium, the DDI Prodigy, the HDI True Track, and the HypoGuard Assure Pro[J].DiabetesTechnology&Therapeutics,2009,11:587-592.
[27]BIESTER T,DANNE T,BLSIG S,etal.. Pharmacokinetic and prandial pharmacodynamic properties of insulin degludec/insulin aspart in children, adolescents, and adults with type 1 diabetes[J].PediatricDiabetes,2016,17:642-649.
[28]BOGNER P,SIPOS K,LUDANY A,etal.. Steady-state volumes and metabolism-independent osmotic adaptation in mammalian erythrocytes[J].EuropeanBiophysicsJournal,2002,31:145-152.
[29]JAIN S K. Hyperglycemia can cause membrane lipid peroxidation and osmotic fragility in human red blood cells[J].JournalofBiologicalChemistry,1989,64:21340-21345.
[30]SON J-H.ProspectsinMedicalApplicationsofTerahertzWavesandConclusions[M].TerahertzBiomedicalScienceandTechnology,CRC Press,2014:347-350.
Authorbiographies:

GUSEV Sviatoslav Igorevich(1991—), PhD student, Department of Photonics and Optical Information Technology, ITMO University, Russia. His research interests are in terahertz time-domain spectroscopy, diabetes care, non-invasive glucose measuring, signal processing. E-mail:mail@gusev-spb.ru
KHODZITSKY Mikhail(1984—), Chief of Terahertz Biomedicine Laboratory, Associate professor, Department of Photonics and Optical Information Technology, ITMO University, Russia. His research interests are in terahertz photonics, metamaterials, biophotonics and terahertz spectroscopy. E-mail:khodzitskiy@yandex.ru
