
Response of ammonia-oxidizing betaproteobacteria to shortterm fertilization in a salt marsh in China*
2018-05-07 06:07MAYuexin马悦欣TAOWei陶韦LIUJiao刘姣LIUChangfa刘长发LIJin李晋LIUJichen刘继晨
关键词:长发
MA Yuexin (马悦欣) , TAO Wei (陶韦) , LIU Jiao (刘姣) LIU Changfa (刘长发) ,LI Jin (李晋) , LIU Jichen (刘继晨)
1 INTRODUCTION
Coastal salt marshes provide a number of services to ecosystems, including the interception of derived nitrogen (N) before it reaches nearshore oceans(Nelson and Zavaleta, 2012). Human alteration of the N cycle has accelerated the transfer of N through rivers to coastal areas (Vitousek et al., 1997). By intercepting the excess nutrients, salt marshes mitigate eutrophication in coastal areas (Valiela and Cole,2002; Vivanco et al., 2015).
One of the most important processes in the marine N cycle is nitrification, a two-step process that first oxidizes ammonia to nitrite via the intermediate hydroxylamine; then oxidizes the nitrite to nitrate.The first step, ammonia oxidation, is the rate-limiting step and is executed by autotrophic ammoniaoxidizing bacteria (AOB) and ammonia-oxidizing archaea. AOB are restricted to two monophyletic clusters within the beta- and gamma-proteobacteria(β-AOB and γ-AOB) (Head et al., 1993; Purkhold et al., 2000). β-AOB are thought to be more abundant than γ-AOB in marine sediments (Nold et al., 2000).Environmental factors clearly influence the nitrification, abundance and composition of ammoniaoxidizers in salt marshes. Dollhopf et al. (2005) found that high concentrations of Fe (III) and macrofauna burrowing activity influenced the abundance of β-AOB and nitrification in a Georgia salt marsh dominated bySpartinaalterniflora. In the Wequetequock-Pawcatuck tidal marsh of southeastern Connecticut, Moin et al. (2009) observed a significant salinity effect on β-AOB abundance at sites dominated by short or tallS.alternifloraorS.patens, but detected no γ-AOB 16S rRNA genes at these sites. Lage et al.(2010) and Peng et al. (2012) investigated the impact of fertilization on β-AOB. They identified the changes in β-AOB community after short-term (2 years) N addition in the saline Scarborough Marsh (which is dominated byS.patens), and after long-term (nearly 40 years) NPK application in the Great Sippewissett Marsh (which is dominated byS.alterniflora,S.patensorDistichlisspicata). The β-AOB abundance remained unaff ected in both marshes. Conversely, in grassland soil systems, the β-AOB abundance reportedly increases after N addition (Shen et al.,2011; Chen et al., 2014; Tian et al., 2014).
The Shuangtai estuary wetland, located north of Liaodong Bay (which forms part of the innermost gulf of the Bohai Sea in northeast China), was listed as a wetland of international importance in 2004. Bai et al. (2010, 2011) found that nitrification was largely affected by ammonia N and total phosphorus content,and that soluble salt, total N and organic matter greatly influenced the quantity of AOB in sediments of the Liaohe estuary wetland. Moreover, high salinity significantly reduced the number and diversity of AOB in a reed wetland of Liaohe estuary (Zhong et al., 2013). The ecosystem of the Shuangtai estuary wetland receives increasing nitrogen inputs from anthropogenic sources, such as wastewater and N fertilizer application (Yi, 2013). However, how the β-AOB respond to N enrichment in this ecosystem has not been reported. In the present study, we investigated whether different levels and forms of N addition alter the composition and abundance of β-AOB in Shuangtai estuary, and the potential nitrification rate in a saltmarsh of this estuary, at a site dominated bySuaedaheteroptera.
2 MATERIAL AND METHOD
2.1 Experimental design
The experiment was conducted in asaltmarsh located in Shuangtai estuary, China. The dominant plant in the study area (~4 800 m2) wasS.heteroptera.We selected six fertilization treatments and an unfertilized control. Each treatment was applied to three replicate plots. At each plot, a polyvinyl chloride(PVC) plastic pipe (inner diameter 15 cm; height 20 cm) was driven into the sediment, leaving 2–3 cm of pipe above the ground. Each pipe contained approximately 15 strains of seedlings. The plots were treated with (a) different amounts of a single N fertilizer (urea: 0.1 (A1), 0.2 (A2), 0.4 (A3), and 0.8 g/kg (A4)) and (b) different forms of N fertilizers (urea(B1=A2), (NH4)2SO4(B2), and NH4NO3(B3), each applied at 0.2 g/kg). Treatments were applied 1–4 times during the plant-growing season (on May 15,July 4, August 14 and September 26 of 2013).Untreated plots (A0=B0) were included as controls.Each N amendment was blended in 50 mL of water and injected into the appropriate pipes using a spinal needle. An equivalent volume of deionized water was injected into the control pipes.
2.2 Sediment sampling
Before the nitrogen application, sediment samples(10–15 cm) were collected from each PVC pipe on July 4, August 14, September 26, and November 22 of 2013, placed in sealed plastic bags, and labeled. All samples were kept on ice in the dark during transportation to the laboratory, then stored at -20°C until required for denaturing gradient gel electrophoresis(DGGE) and real-time quantitative PCR (qPCR) analysis.
2.3 β-AOB community analysis by DGGE
The community DNA was extracted from 0.6 g of the pooled samples from the three replicate plots using a fast genomic DNA isolation kit for soils (Shanghai Sangon Biological Engineering Technology and Services Company Limited, Shanghai, China)following the manufacturer’s instructions. The β-AOB 16S rRNA gene was detected by a nested PCR strategy.The first amplification was performed using βAMO primers (McCaig et al., 1994) in a 50-μL reaction mixture containing 5 μL of 10×PCR buff er, 3 μL of template, 200 μmol/L of dNTP, 1.5 mmol/L of MgCl2,0.4 μmol/L of each primer and 0.5 UTaqof polymerase.The PCR procedure was 5 min of initial denaturation at 94°C, 30 cycles of denaturation (30 s) at 94°C,annealing (30 s) at 55°C and primer extension (90 s) at 72°C, followed by a final extension at 72°C for 5 min.The secondary amplification was performed using CTO189f-GC and CTO654r primers (Kowalchuk et al., 1997) in 50 μL of a reaction mixture with the above-described composition. The procedure was 5 min of initial denaturation at 94°C, 20 cycles of denaturation (1 min) at 94°C, 1 min of initial annealing at 65°C (decreasing by 0.5°C per cycle to a touchdown temperature of 55°C), and extension (1 min) at 72°C;this was followed by 10 cycles of denaturation (1 min)at 94°C, annealing (1 min) at 55°C, extension (1 min)at 72°C, and a final extension at 72°C for 10 min. The amplification products were analyzed by electrophoresis in 1% (w/v) agarose gel containing GoldView.
The sequence-specific separation of the PCR products was performed by a Dcode™ Universal Mutation Detection System (Bio-Rad Laboratories Inc., Hercules, CA, USA). The PCR samples were applied onto 6% (w/v) polyacrylamide gels in a running buff er (1% tris-acetate-EDTA). The gels were prepared with a denaturing urea and formamide gradient of 45% to 55%, and a polyacrylamide and bis-acrylamide ratio of 37.5:1. Electrophoresis was run at 70 V and 60°C for 16 h. Subsequently, the gels were stained with Genfinder according to the manufacturer’s instructions and photographed under UV transillumination. The DGGE fingerprint patterns were analyzed by Quantity One Software (Bio-Rad Laboratories). The differences between the DGGE patterns and dendrograms were determined by presence-absence matrices constructed using the Dice coefficient and the unweighted pair-group method with arithmetic average algorithms. These analyses were performed in the NTSYS software package(version 2.10e, Exeter Software, Setauket, New York).
Bands selected from the DGGE gel were eluted and reamplified with the same primers but omitting the GC-clamp. The PCR products were sequenced by Shanghai Sangon Biological Engineering Technology and Services Company Limited (Shanghai, China).The sequences have been submitted to GenBank under NCBI accession numbers KT259283–KT259292, KT259294–KT259305, KT280472–KT280473 and KX819277–KX819292. They were aligned using the ClustalW program and compared with other AOB 16S rRNA gene sequences available in the NCBI database of GenBank (http://www.ncbi.nlm.nih.gov/BLAST). The neighbor-joining tree was constructed using MEGA 4 based on the Kimura-2-parameter distances and a bootstrap analysis of 1 000 re-samplings (Tamura et al., 2007).
2.4 Quantification of β-AOB amoA gene by qPCR
The genomic DNA was extracted from 0.3 g of sample using the fast genomic DNA isolation kit for soils (Shanghai Sangon Biological Engineering Technology and Services Company Limited,Shanghai, China) according to the instructions. qPCR was performed on a 7500 real-time PCR system(StepOne™, Applied Biosystems, Foster City, CA,USA) using Green-2-Go qPCR Mastermix. The β-AOBamoAgene was amplified using an amoA-1F and amoA-2R primer set (Rotthauwe et al., 1997).The qPCR mixture (20 μL) contained 10 μL of Green-2-Go qPCR Mastermix (2×), 0.25 μmol/L of each primer, and 2 μL template DNA. All reactions were performed in 8-strip thin-well PCR tubes with ultraclean cap strips. The qPCR thermocycling parameters were as follows: initial denaturation at 95°C for 10 min, followed by 40 cycles of denaturation at 95°C for 15 s and primer annealing at 60°C for 60 s. The copy number of the standard plasmids carrying theamoAgenes (constructed by cloning the sediment samples) ranged from 102to 106. The qPCRs of the standards and DNA from each sample were performed in triplicate. The specificity of the qPCR amplification was determined from the melting curve.In all experiments, possible contamination was detected by qPCR of negative controls containing no template DNA. Gene abundance was normalized per gram of wet sediment.
2.5 Potential nitrification rates
Potential nitrification rate experiments were set up within 2 h of transportation to the laboratory. Samples of ~10 g wet sediment were transferred to 250 mL flasks containing 100 mL of NH4Cl solution (25 mg N/L, salinity 5). All samples were incubated at 25°C with continuous shaking at 150 r/min. Nitrogen(nitrate-N+nitrite-N) in the subsamples was measured every 4 h from 0 to 24 h using an AutoAnalyzer 3(Bran Luebbe, Norderstedt, Germany). Potential nitrification rates were calculated from the exponential phase of the increase in N (nitrate-N+nitrite-N) per gram of wet sediment over time.
2.6 Statistical analyses
Multiple comparisons and Pearson’s correlations among the quantitative variables were performed using SPSS version 22.0. The quantitative differences between treatments were examined by Tukey’s test.The β-AOBamoAabundance data were logarithmtransformed prior to analyses to alleviate heteroscedasticity. If the normality criteria were not met, the data were analyzed by nonparametric tests.
3 RESULT
3.1 Responses of β-AOB community to fertilization
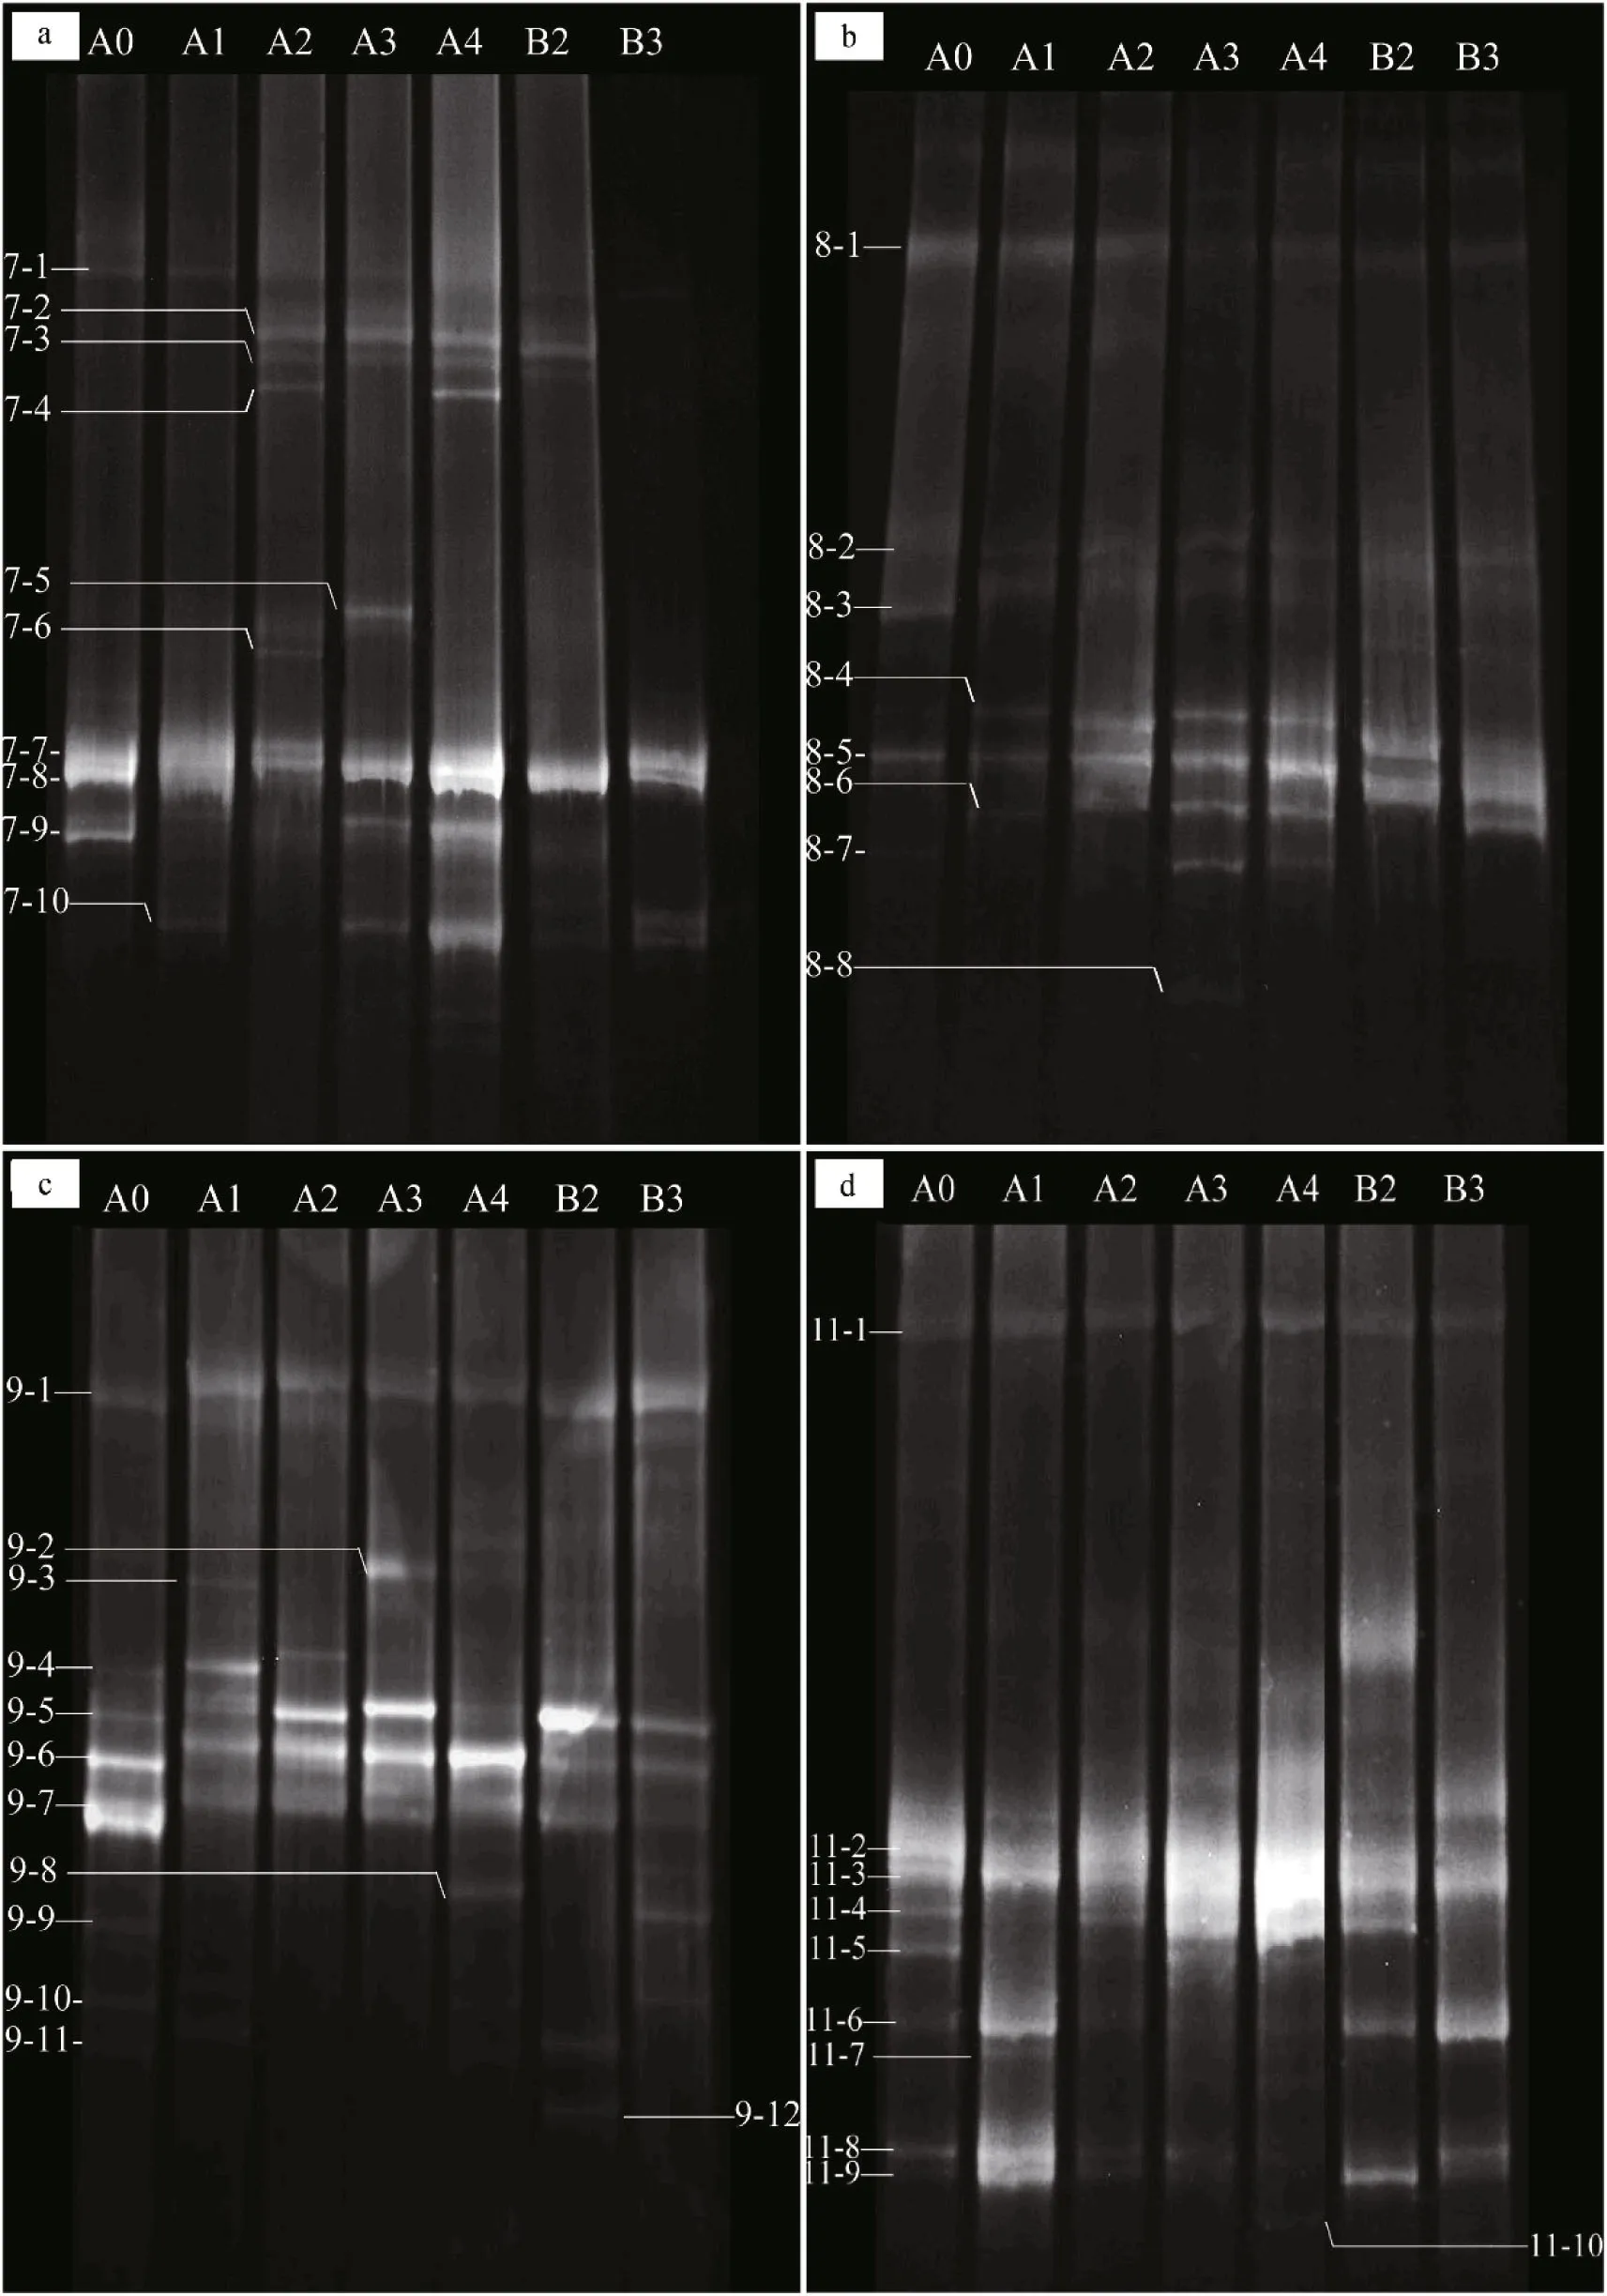
Fig.1 DGGE profile of nested PCR-amplified CTO fragments
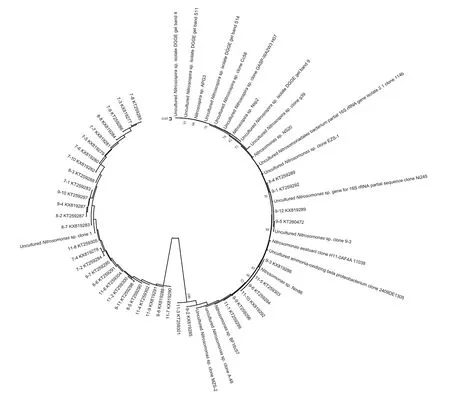
Fig.2 Phylogenetic relationships among the β-AOB 16S rRNA gene nucleotide sequences recovered from the saltmarsh plots
The different amounts and forms of N treatment yielded different banding patterns (Fig.1). Forty bands were excised from the DGGE profiles, sequenced and subjected to phylogenetic analysis (Fig.2). The sequences of 11 bands (7-2, 7-3, 7-4, 7-5, 7-6, 7-7,7-8, 7-9 7-10, 8-3 and 8-8) were highly similar to those of members of the genusNitrosospira, while the sequences of the other 27 bands (excluding 8-1 and 8-6) were closely related toNitrosomonasbacteria(Table 1). Bands 7-2, 7-3, 7-4, 7-5, 7-6, 7-10, 8-6, 8-8,9-2, 9-3, 9-8, 9-12, 11-7 and 11-10 were detected only in the N fertilizer treatments (Fig.1). Bands 9-8 and 9-12 were unique to the 0.8 g N and (NH4)2SO4treatments, respectively (Fig.1). Nitrogen treatment effects were verified by the unweighted pair group method with arithmetic average clustering (Fig.3).
3.2 Responses of abundance of β-AOB and potential nitrification rate to fertilization
Across all sampling dates except September, the β-AOBamoAgene abundance was significantly higher in samples treated with 0.2 g N than in the control samples (Table 2,P<0.05). In samples treated with 0.1, 0.4 and 0.8 g N, the β-AOBamoAgene abundance was significantly higher than the control abundance only in July and August (Table 2,P<0.05).Across all sampling dates, no significant differences in β-AOBamoAgene abundance were observed among different amounts of N application (Table 2,P>0.05). Thus, the β-AOBamoAgene abundance was significantly affected by the N amount only in July and August (Table 2,P<0.05).
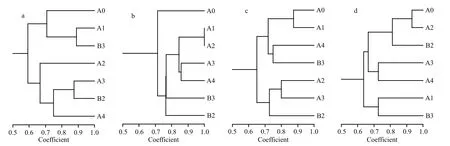
Fig.3 Dendrograms comparing the similarity levels of the β-AOB communities in different sediment samples

Table 1 Blast analysis of the AOB 16S rDNA sequences derived from DGGE bands

Table 2 effects of varying the amount and form of N treatment on β-AOB amoA gene abundance
Relative to the control, the β-AOBamoAgene abundance was significantly increased by urea application across all sampling dates except November(Table 2,P<0.05), by (NH4)2SO4addition in July and August alone (Table 2,P<0.05), and by NH4NO3addition in August alone (Table 2,P<0.05). Moreover,the β-AOBamoAgene abundance significantly differed between the urea- and NH4NO3-treated samples in August and November (Table 2,P<0.05),between the urea- and (NH4)2SO4-treated applications in August alone (Table 2,P<0.05), and between the NH4NO3- and (NH4)2SO4-treated applications in November alone (Table 2,P<0.05). Thus, the β-AOBamoAgene abundance was significantly affected by the N form across all sampling dates (Table 2,P<0.05).
Over 6 months’ application of 0.1, 0.2 and 0.4 g N,the potential nitrification rate was significantly higher than the control rate (Table 3,P<0.05). However, the addition of 0.8 g N significantly increased the potential nitrification rate only in November (Table 3,P<0.05).Moreover, the potential nitrification rate after 0.2 g N addition was significantly higher than after 0.1 and 0.4 g N addition in August and November (Table 3,P<0.05), and after 0.8 g N addition at all sampling dates except September (Table 3,P<0.05). The potential nitrification rates after 0.4 g N and 0.8 g Naddition were significantly different only in November(Table 3,P<0.05). No significant differences in potential nitrification rate were observed between 0.1 g N and 0.4 g N application, or between 0.1 g N and 0.8 g N addition, across all sampling dates. Thus,the potential nitrification rate was significantly affected by the N amount at all sampling dates (Table 3,P<0.05).
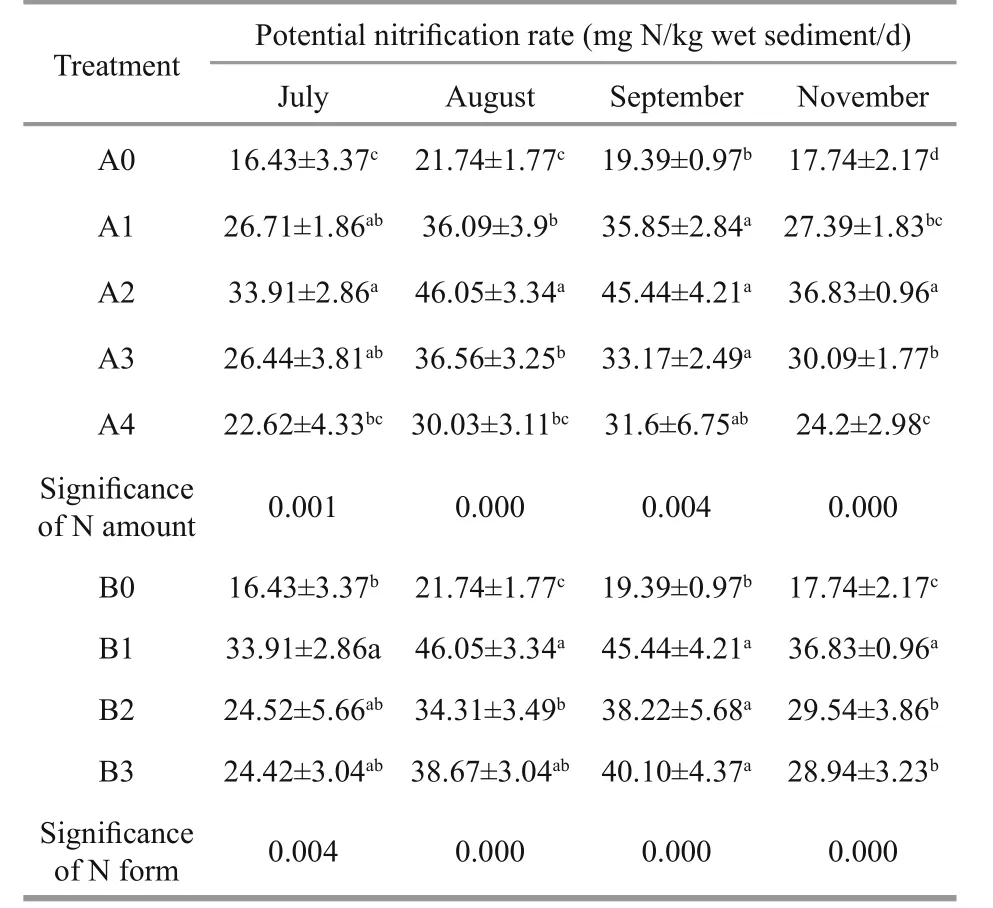
Table 3 effects of varying the amount and form of N on potential nitrification rate
Urea, (NH4)2SO4and NH4NO3addition significantly increased the potential nitrification rate over the control (Table 3,P<0.05) across all sampling dates except July (in which the rates of the (NH4)2SO4-and NH4NO3-treated samples were statistically similar to the control rate). Furthermore, significant differences in the potential nitrification rate were observed between the urea- and (NH4)2SO4-treated samples in August and November alone (Table 3,P<0.05), and between the urea- and NH4NO3-treated samples in November alone (Table 3,P<0.05).Finally, no differences in potential nitrification rate were observed between the (NH4)2SO4- and NH4NO3-treated samples at any sampling date.Thus, the potential nitrification rate was significantly affected by the N form across all sampling dates (Table 3,P<0.05).
The potential nitrification rates were significantly correlated with β-AOB abundance across all sampling dates (Fig.4,P<0.05), suggesting that the resident β-AOBs are active ammonia oxidizers.
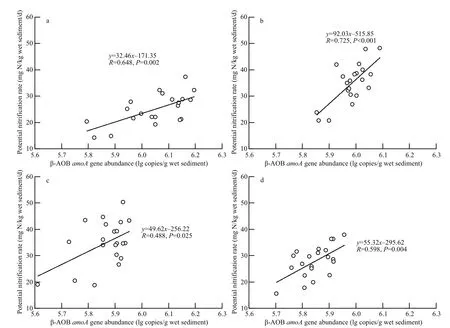
Fig.4 Relationship between potential nitrification rate and amoA gene abundance of β-AOBs
4 DISCUSSION
In previous experiments on salt marsh sediments,the β-AOB community composition shifted after 2 years’ application of single nutrients (N), and after nearly 40 years of mixed fertilizer (NPK) application(Lage et al., 2010; Peng et al., 2012). In the present study, the β-AOB community responded to shortterm (2–6 months) fertilization with different amounts of a specific N source (urea) and with different forms of N (urea, (NH4)2SO4and NH4NO3). The AOB community composition might actually be linked to N availability (Hynes and Germida, 2012). Similarly,the β-AOB community in fertilized soils is affected by urea, (NH4)2HPO4and NH4NO3applied at different amounts (Shen et al., 2011; Chen et al., 2013; Xiao et al., 2014; Wang et al., 2015). Sequences related toNitrosospiraandNitrosomonaswere detected in the present study of a saltmarsh in Shuangtai estuary.ElevenNitrosospirasequences were recovered in July and August. In the Wequetequock-Pawcatuck tidal marsh (dominated byS.alternifloraorS.patens)and the saltmarsh in Scarborough Marsh (dominated byS.patens), almost all of the β-AOBamoAsequences form aNitrosospira-like clade (Moin et al.,2009; Lage et al., 2010). The same sequence type predominates in the Great Sippewissett Marsh, which is mainly populated byS.alterniflora,S.patensorD.spicata(Peng et al., 2012). The present study found 27Nitrosomonassequences in July, August,September and November. The intensities of bands 8-4 and 9-5 increased after N addition, band 9-8 was restricted by 0.8 g N treatment, and band 9-12 was detected only after (NH4)2SO4application. These findings were partly supported by Peng et al. (2012),who found that sequences related toNitrosomonasspp. dominated in systems treated with high-toexcessive levels of mixed NPK fertilizer.Nitrosomonas-related sequences also predominate in fertilized or polluted sediments (Beman and Francis,2006; Dang et al., 2010; Cao et al., 2012). Moreover,most of the 16S rRNA gene sequences were closely related to uncultured AOB. By cultivating these culturally recalcitrant AOBs and characterizing their ecophysiology, we can potentially identify specific AOB populations that consistently respond to fertilization (Peng et al., 2012).
In this study, the abundances of the β-AOBamoAgenes ranged from 4.1×10⁵to 1.6×10⁶copies/g sediment, within the abundance ranges reported in other estuarine and saltmarsh studies (Moin et al.,2009; Bernhard and Bollmann, 2010; Peng et al.,2012; Marton et al., 2015). Specifically, the abundance of β-AOBamoAgenes ranged from 3.6×10³to 2.6×10⁷copies/g sediment in the Wequetequock-Pawcatuck tidal marsh (Moin et al., 2009), from 1.2×10⁶to 1.63×10⁸copies g/wet sediment in a midtidal saltmarsh in Scarborough Marsh (Lage et al.,2010), and from 4.5×10³to 1.3×10⁷copies/g sediment in the Great Sippewissett Marsh (Peng et al., 2012). In our study, the β-AOB abundance significantly increased in the presence of various amounts of a specific N source (urea), and in the presence of various N sources (urea, (NH4)2SO4and NH4NO3). Nitrogen addition positively aff ects the β-AOB abundance in agricultural soils (Glaser et al., 2010; Xu et al., 2012;Ai et al., 2013), forest soils (Long et al., 2012; Wertz et al., 2012) and grassland soils (Di et al., 2009; Shen et al., 2011; Tian et al., 2014; Chen et al., 2014).Consistent with our results, Kastl et al. (2015) found that N amounts aff ects the β-AOB abundance at the root–soil interfaces of plants with different N-uptake strategies, and Tian et al. (2014) reported that β-AOB abundance in fertilized grassland soil responds differently to different forms of N. However, Lage et al. (2010) and Peng et al. (2012) reported no effect of fertilization on β-AOB abundance in saltmarshes. The contrasting responses may arise from differences in the duration and amount of the added N, the form in which the N was applied, the plant species and the environmental factors of the investigated sites. In the present study, the β-AOB abundance may have positively responded to the increased N availability(Bai et al., 2011), as N provides energy for ammonia oxidizers. In addition, different amounts and forms of N fertilizers can alter the salinity, which may also affect β-AOB abundance (Moin et al., 2009).
The range of potential nitrification rates was higher in the saltmarsh in Shuangtai estuary than in other saltmarsh sediments (Dollhopf et al., 2005; Moin et al., 2009). Consistent with previous studies (Di et al.,2009; Wertz et al., 2012; Ai et al., 2013; Chen et al.,2013, 2014), we found that N fertilization increases the sediment potential nitrification rate, indicating that short-term N application greatly promotes the sediment nitrification function. Moreover, the potential nitrification rate was significantly correlated with β-AOB abundance during the plant-growing season, suggesting that nitrification is driven by β-AOB in the saltmarsh in Shuangtai estuary. Dollhopf et al. (2005) reported similar findings in saltmarsh sediments.
5 CONCLUSION
In summary, N addition altered the β-AOB community composition, increasing both β-AOB abundance and potential nitrification rate. Moreover,the microbial parameters responded differently to varying amounts of a specific nitrogen source (urea)and to different forms of nitrogen applied at the same concentration. To our knowledge, we present the first demonstration that short-term N application influences the sediment β-AOB community, β-AOB abundance and potential nitrification rate in a saltmarsh ecosystem.
Ai C, Liang G Q, Sun J W, Wang X B, He P, Zhou W. 2013.different roles of rhizosphere effect and long-term fertilization in the activity and community structure of ammonia oxidizers in a calcareous fluvo-aquic soil.Soil Biol.Biochem.,57: 30-42.
Bai J, Chen C T, Zhao Y G, Tian W J, Dong X, Yin N N. 2010.Studies on nitrobacteria and nitrification in Liaohe estuary wetland sediments.Environ.Sci.,31(12): 3 011-3 017. (in Chinese with English abstract)
Bai J, Dong X, Zhao Y G. 2011. Characteristics of temporal and spatial distribution of ammonia-oxidizing bacteria in Liaohe estuary wetland soil.ChinaEnviron.Sci.,31(11):1 870-1 874. (in Chinese with English abstract)
Bayer K, Schmitt S, Hentschel U. 2008. Physiology, phylogeny andinsituevidence for bacterial and archaeal nitrifiers in the marine spongeAplysinaaerophoba.Environ.Microbiol.,10(11): 2 942-2 955.
Beman J M, Francis C A. 2006. Diversity of ammoniaoxidizing archaea and bacteria in the sediments of a hypernutrified subtropical estuary: Bahía del Tóbari,Mexico.Appl.Environ.Microbiol.,72(12): 7 767-7 777.
Bernhard A E, Bollmann A. 2010. Estuarine nitrifiers: new players, patterns and processes.Estuar.Coast.ShelfSci.,88(1): 1-11.
Burrell P C, Phalen C M, Hovanec T A. 2001. Identification of bacteria responsible for ammonia oxidation in freshwater aquaria.Appl.Environ.Microbiol.,67(12): 5 791-5 800.
Cao H L, Hong Y G, Li M, Gu J D. 2012. Community shift of ammonia-oxidizing bacteria along an anthropogenic pollution gradient from the Pearl River Delta to the South China Sea.Appl.Microbiol.Biotechnol.,94(1): 247-259.
Chen Y L, Hu H W, Han H Y, Du Y, Wan S Q, Xu Z W, Chen B D. 2014. Abundance and community structure of ammonia-oxidizingArchaeaandBacteriain response to fertilization and mowing in a temperate steppe in Inner Mongolia.FEMSMicrobiol.Ecol.,89(1): 67-79.
Chen Y L, Xu Z W, Hu H W, Hu Y J, Hao Z P, Jiang Y, Chen B D. 2013. Responses of ammonia-oxidizing bacteria and archaea to nitrogen fertilization and precipitation increment in a typical temperate steppe in Inner Mongolia.Appl.SoilEcol.,68: 36-45.
Dang H Y, Li J, Chen R P, Wang L, Guo L Z, Zhang Z N, Klotz M G. 2010. Diversity, abundance, and spatial distribution of sediment ammonia-oxidizingBetaproteobacteriain response to environmental gradients and coastal eutrophication in Jiaozhou Bay, China.Appl.Environ.Microbiol.,76(14): 4 691-4 702.
Di H J, Cameron K C, Shen J P, Winefield C S, O’Callaghan M, Bowatte S, He J Z. 2009. Nitrification driven by bacteria and not archaea in nitrogen-rich grassland soils.Nat.Geosci.,2(9): 621-624.
Dollhopf S L, Hyun J H, Smith A C, Adams H J, O’Brien S,Kostka J E. 2005. Quantification of ammonia-oxidizing bacteria and factors controlling nitrification in salt marsh sediments.Appl.Environ.Microbiol.,71(1): 240-246.
Glaser K, Hackl E, Inselsbacher E, Strauss J, Wanek W,Zechmeister-Boltenstern S, Sessitsch A. 2010. Dynamics of ammonia-oxidizing communities in barley-planted bulk soil and rhizosphere following nitrate and ammonium fertilizer amendment.FEMSMicrobiol.Ecol.,74(3): 575-591.
Grommen R, Dauw L, Verstraete W. 2005. Elevated salinity selects for a less diverse ammonia-oxidizing population in aquarium biofilters.FEMSMicrobiol.Ecol.,52(1): 1-11.
Haaijer S C M, Ji K, van Niftrik L, Hoischen A, Speth D, Jetten M S M, Damsté J S, Op den Camp H J M. 2013. A novel marine nitrite-oxidizingNitrospiraspecies from Dutch coastal North Sea water.Front.Microbiol.,4: 60.
Head I M, Hiorns W D, Embley T M, McCarthy A J, Saunders J R. 1993. The phylogeny of autotrophic ammoniaoxidizing bacteria as determined by analysis of 16S ribosomal RNA gene sequences.J.Gen.Microbiol.,139(6): 1 147-1 153.
Hynes H M, Germida J J. 2012. Relationship between ammonia oxidizing bacteria and bioavailable nitrogen in harvested forest soils of central Alberta.SoilBiol.Biochem.,46: 18-25.
Itoi S, Niki A, Sugita H. 2006. Changes in microbial communities associated with the conditioning of filter material in recirculating aquaculture systems of the puff erfishTakifugurubripes.Aquaculture,256(1-4): 287-295.
Jangid K, Williams M A, Franzluebbers A J, Sanderlin J S,Reeves J H, Jenkins M B, Endale D M, Coleman D C,Whitman W B. 2008. Relative impacts of land-use,management intensity and fertilization upon soil microbial community structure in agricultural systems.SoilBiol.Biochem.,40(11): 2 843-2 853.
Kastl E M, Schloter-Hai B, Buegger F, Schloter M. 2015.Impact of fertilization on the abundance of nitrifiers and denitrifiers at the root-soil interface of plants with different uptake strategies for nitrogen.Biol.Fertil.Soils,51(1):57-64.
Kowalchuk G A, Stephen J R, De Boer W, Prosser J I, Embley T M, Woldendorp J W. 1997. Analysis of ammoniaoxidizing bacteria of the beta subdivision of the classProteobacteriain coastal sand dunes by denaturing gradient gel electrophoresis and sequencing of PCR-amplified 16S ribosomal DNA fragments.Appl.Environ.Microbiol.,63(4): 1 489-1 497.
Laanbroek H J, Keijzer R M, Verhoeven J T A, Whigham D F.2012. The distribution of ammonia-oxidizing betaproteobacteria in stands of Black mangroves(Avicenniagerminans).Front.Microbiol.,3: 153.
Lage M D, Reed H E, Weihe C, Crain C M, Martiny J B H.2010. Nitrogen and phosphorus enrichment alter the composition of ammonia-oxidizing bacteria in salt marsh sediments.ISMEJ.,4(7): 933-944.
Long X E, Chen C R, Xu Z H, Oren R, He J Z. 2012. Abundance and community structure of ammonia-oxidizing bacteria and archaea in a temperate forest ecosystem under tenyears elevated CO2.SoilBiol.Biochem.,46: 163-171.
Magalhães C, Bano N, Wiebe W J, Hollibaugh J T, Bordalo A A. 2007. Composition and activity of beta-Proteobacteria ammonia-oxidizing communities associated with intertidal rocky biofilms and sediments of the Douro River estuary, Portugal.J.Appl.Microbiol.,103(4):1 239-1 250.
Marton J M, Roberts B J, Bernhard A E, Giblin A E. 2015.Spatial and temporal variability of nitrification potential and ammonia-oxidizer abundances in Louisiana salt marshes.Estuar.Coast,38(6): 1 824-1 837.
McCaig A E, Embley T M, Prosser J I. 1994. Molecular analysis of enrichment cultures of marine ammonia oxidisers.FEMSMicrobiol.Lett.,120(3): 363-367.
Moin N S, Nelson K A, Bush A, Bernhard A E. 2009.Distribution and diversity of archaeal and bacterial ammonia oxidizers in salt marsh sediments.Appl.Environ.Microbiol.,75(23): 7 461-7 468.
Nelson J L, Zavaleta E S. 2012. Salt marsh as a coastal filter for the oceans: changes in function with experimental increases in nitrogen loading and sea-level rise.PloSOne,7(8): e38558.
Nold S C, Zhou J Z, Devol A H, Tiedje J M. 2000. Pacific northwest marine sediments contain ammonia-oxidizing bacteria in the β subdivision of theProteobacteria.Appl.Environ.Microbiol.,66(10): 4 532-4 535.
Peng X F, Yando E, Hildebrand E, Dwyer C, Kearney A,Waciega A, Valiela I, Bernhard A E. 2012. differential responses of ammonia-oxidizing archaea and bacteria to long-term fertilization in a New England salt marsh.Front.Microbiol.,3: 445.
Purkhold U, Pommerenin-Röser A, Juretschko S, Schmid M C,Koops H P, Wagner M. 2000. Phylogeny of all recognized species of ammonia oxidizers based on comparative 16S rRNA andamoAsequence analysis: implications for molecular diversity surveys.Appl.Environ.Microbiol.,66(12): 5 368-5 382.
Purkhold U, Wagner M, Timmermann G, Pommerening-Röser A, Koops H P. 2003. 16S rRNA andamoA-based phylogeny of 12 novel betaproteobacterial ammoniaoxidizing isolates: extension of the dataset and proposal of a new lineage within the nitrosomonads.Int.J.Syst.Evol.Microbiol.,53(5): 1 485-1 494.
Rotthauwe J H, Witzel K P, Liesack W. 1997. The ammonia monooxygenase structural geneamoAas a functional marker: molecular fine-scale analysis of natural ammoniaoxidizing populations.Appl.Environ.Microbiol.,63(12):4 704-4 712.
Shen X Y, Zhang L M, Shen J P, Li L H, Yuan C L, He J Z.2011. Nitrogen loading levels affect abundance and composition of soil ammonia oxidizing prokaryotes in semiarid temperate grassland.JSoilsSediments,11(7):1 243-1 252.
Tamura K, Dudley J, Nei M, Kumar S. 2007. MEGA4:Molecular Evolutionary Genetics Analysis (MEGA)software version 4.0.Mol.Biol.Evol.,24(8): 1 596-1 599.
Tian X F, Hu H W, Ding Q, Song M H, Xu X L, Zheng Y, Guo L D. 2014. Influence of nitrogen fertilization on soil ammonia oxidizer and denitrifier abundance, microbial biomass, and enzyme activities in an alpine meadow.Biol.Fertil.Soils,50(4): 703-713.
Urakawa H, Garcia J C, Nielsen J L, Le V Q, Kozlowski J A,Stein L Y, Lim C K, Pommerening-Röser A, Martens-Habbena W, Stahl D A, Klotz M G. 2015.Nitrosospira lacussp. nov., a psychrotolerant, ammonia-oxidizing bacterium from sandy lake sediment.Int.J.Syst.Evol.Microbiol.,65(1): 242-250.
Urakawa H, Kurata S, Fujiwara T, Kuroiwa D, Maki H,Kawabata S, Hiwatari T, Ando H, Kawai T, Watanabe M,Kohata K. 2006. Characterization and quantification of ammonia-oxidizing bacteria in eutrophic coastal marine sediments using polyphasic molecular approaches and immunofluorescence staining.Environ.Microbiol.,8(5):787-803.
Valiela I, Cole M L. 2002. Comparative evidence that salt marshes and mangroves may protect seagrass meadows from land-derived nitrogen loads.Ecosystems,5(1): 92-102.
Vitousek P M, Aber J D, Howarth R W, Likens G E, Matson P A, Schindler D W, Schlesinger W H, Tilman D G. 1997.Human alteration of the global nitrogen cycle: sources and consequences.Ecol.Appl.,7(3): 737-750.
Vivanco L, Irvine I C, Martiny J B. 2015. Nonlinear responses in salt marsh functioning to increased nitrogen addition.Ecology,96(4): 936.
Wang J, Li G, Lai X, Song X L, Zhao J N, Yang D L. 2015.differential responses of ammonia-oxidizers communities to nitrogen and water addition inStipabaicalensisSteppe,Inner Mongolia, northern China.J.Resour.Ecol.,6(1):1-11.
Wertz S, Leigh A K K, Grayston S J. 2012. effects of long-term fertilization of forest soils on potential nitrification and on the abundance and community structure of ammonia oxidizers and nitrite oxidizers.FEMSMicrobiol.Ecol.,79(1): 142-154.
Xiao R, Chen B Z, Liu Y J, Wang C P, Gu J D, Feng H Y, Du G Z, Ma X J. 2014. Higher abundance of ammonia oxidizing archaea than ammonia oxidizing bacteria and their communities in Tibetan alpine meadow soils under long-term nitrogen fertilization.Geomicrobiol.J.,31(7):597-604.
Xu Y G, Yu W T, Ma Q, Zhou H. 2012. Responses of bacterial and archaeal ammonia oxidisers of an acidic luvisols soil to different nitrogen fertilization rates after 9 years.Biol.Fertil.Soils,48(7): 827-837.
Yi B L. 2013. The geochemistry of N, P in Shuangtaizi river estuary. Ocean University of China, Qingdao, China. (in Chinese)
Zhong L H, Dong X, Bai J, Wang Y, Zhao Y G. 2013.Community structure of ammonia-oxidizing bacteria in soil at different salinities of Liaohe estuary reed wetland.Period.OceanUniv.China,43(4): 94-99. (in Chinese with English abstract)
猜你喜欢
少男少女·小作家(2022年4期)2022-04-23
婚姻与家庭·婚姻情感版(2021年5期)2021-05-29
好孩子画报(2021年2期)2021-03-15
音乐天地(音乐创作版)(2020年8期)2020-12-06
青年歌声(2020年11期)2020-11-24
少先队活动(2020年6期)2020-07-27
音乐教育与创作(2020年5期)2020-06-19
童话世界(2019年29期)2019-11-23
小学生优秀作文(低年级)(2018年3期)2018-02-08
红蜻蜓·低年级(2016年4期)2016-11-19
 Journal of Oceanology and Limnology2018年2期
- Journal of Oceanology and Limnology的其它文章
- An aftereffect of global warming on tropical Pacific decadal variability*
- Analysis of monthly variability of thermocline in the South China Sea*
- A numerical study of the South China Sea Warm Current during winter monsoon relaxation*
- Predicting the sinkage of a moving tracked mining vehicle using a new rheological formulation for soft deep-sea sediment*
- Chemical characterization of fractions of dissolved humic substances from a marginal sea—a case from the Southern Yellow Sea*
- The morphological and molecular detection for the presence of toxic Cylindrospermopsis (Nostocales, Cyanobacteria) in Beijing city, China*