
Intestinal microbiota of healthy and unhealthy Atlantic salmon Salmo salar L. in a recirculating aquaculture system*
2018-05-07 06:07WANGChun王纯SUNGuoxiang孙国祥LIShuangshuang李双双LIXian李贤LIUYing刘鹰
关键词:李贤
WANG Chun (王纯) SUN Guoxiang (孙国祥) LI Shuangshuang (李双双)LI Xian (李贤) LIU Ying (刘鹰)
1 Institute of Oceanology, Chinese Academy of Sciences, Qingdao 266071, China
2 University of Chinese Academy of Sciences, Beijing 100049, China
3 College of Energy and Environmental Engineering, Hebei University of Engineering, Handan 056038, China
1 INTRODUCTION
The intestinal microbiota that colonize an animal’s intestines function as a “forgotten” organ in the host and perform critical functions for the host that the host cannot perform itself (O’Hara and Shanahan,2006; Nicholson et al., 2012). Many studies have indicated that the intestinal microbiota represent an important component of the metabolism, immunity,energy utilization, and health maintenance of its host(Backhed et al., 2004; Hooper et al., 2012). The intestinal microbiota provide a physical barrier against pathogen invasion through competitive exclusion, by occupying attachment sites and consuming nutrient resources (Round and Mazmanian,2009; Gill et al., 2011).
Bacteria ingested during the yolk sac stage colonize the fish intestine (Ringø and Birkbeck, 1999). The primary intestinal microbiota are established in several stages, producing the “adult” microbiota,which acts for several weeks or even months after first feeding (Hansen and Olafsen, 1999). The microorganisms that eventually inhabit the gut originate from the water, soil/sediment, or live feed(Romero and Navarrete, 2006; Wu et al., 2012).However, the intestinal microbiota does not remain constant, but varies in composition and can be affectedby many exogenous and endogenous factors,including the host’s genotype, feeding habits, and lifestyle (Claesson et al., 2012; Li et al., 2012; Yan et al., 2012). However, most available studies have been performed on mammals, and little attention has been paid to the intestinal microbiota of fish.

Table 1 Ingredients and chemical composition of the basal diet for Atlantic salmon (% dry matter)
Atlantic salmon (SalmosalarL.) often suff er from infectious diseases caused byAeromonassalmonicida,a non-motile Gram-negative bacterium and the causative agent of furunculosis. This disease is ubiquitous in salmonids (salmon, trout, etc.) with high morbidity and mortality rates, and has become a major constraint and threat to the salmon aquaculture industry (Janda and Abbott, 2010; Du et al., 2015). It is widely recognized that the health status of the host depends strongly on the biological composition of the intestinal microbiota (Wang et al., 2012; Zheng et al.,2016). Some symbiotic bacteria with potential antiinflammatory properties disappear during disease in their host, indicating that the health status of the host also depends on the microbiota present (Round and Mazmanian, 2009). The relationship between fish health and the intestinal microbiota of the host has been widely studied in humans and other mammals(Round and Mazmanian, 2009; Manichanh et al.,2012; Wang et al., 2012). However, few studies have investigated the impact of the host’s health status on the intestinal microbiota in fish, particularly in Atlantic salmon. Understanding the intestinal microbiota of Atlantic salmon in different health statuses is important for monitoring health of other fish species. The health status of fish is also closely related to the ambient water, which contains various microorganisms at different concentrations. Therefore,exploring the potential relationships between the intestinal microbiota of unhealthy fish and ambient water is also necessary.
In this study, we compared the intestinal bacterial communities ofA.salmonicida-infected Atlantic salmon and healthy fish. We investigated the diversity and composition of the intestinal bacterial biota in healthy and unhealthy Atlantic salmon using highthroughput pyrosequencing of the 16S rRNA genes.
2 MATERIAL AND METHOD
2.1 Sample collection
Healthy and unhealthy Atlantic salmon samples with no differences in body length (BL; (70.67±5.69)vs. (66.67±6.11) cm,t-test,P=0.921) or body weight(BW; (5.06±0.24) vs. (4.83±0.51) kg,t-test,P=0.156)were captured from a recirculating aquaculture systems (RAS) at the Oriental Ocean Sci-Tech Co.Ltd., Yantai, Shandong, China (37°42′N, 121°08′E).Both healthy and unhealthy fish were fed the same diet (Table 1) and reared in similar environments.
Each sample had three replications representing the two health statuses. Healthy samples were taken from a RAS containing adults feeding normally behavior with no signs of disease as confirmed by both visual inspection and a dissection analysis.Diseased samples were obtained from unhealthy salmon with various syndromes, of whichA.salmonicidawas confirmed in the infection as referenced by Gustafson et al. (1992), and by dissection and polymerase chain reaction (PCR)analyses (data not shown). An ambient water sample was collected using a sterile 1-L beaker from four different locations in the tank (120-m3) with unhealthy fish and mixed. Ten ball media that comprised the aerated biological filter to treat the RAS water were taken randomly as the biofilter sample using a sterile 250-mL beaker, cleaned with a sterile soft bristle brush, and rinsed with sterile water. All samples were transported to the laboratory immediately. After body BW and BL were measured, the fish were disinfected with 70% alcohol and dissected under sterile conditions. All procedures followed Ni et al. (2014).A small portion of the intestinal contents(approximately 1g wet weight) was excised from the intestine and stored in a 2.0-mL sterile tube(Eppendorf) individually. The 4-L mixed ambient water and 100-mL biofilm water samples were sequentially filtered through 1.2-μm (Whatman,Florham Park, NJ, USA) and 0.22-μm filter paper(Millipore, Billerica, MA USA), respectively, to collect as many bacterioplankton organisms as possible. All eight samples were stored at -80°C for later microbial DNA extraction.
This study was performed in accordance with the protocols of China’s National Regulations for the Administration of Aff airs Concerning Experimental Animals (approved by the State Council on October 31, 1988 and promulgated by Decree No. 2 of the State Science and Technology Commission on November 14, 1988). All experiments and procedures involving animals were performed strictly according to international guidelines concerning the care and treatment of experimental animals (Wolfensohn and Lloyd, 2008).
2.2 Genomic DNA extraction and high-throughput sequencing
Genomic DNA was extracted from the hindgut contents of Atlantic salmon as described by Ni et al.(2012) with some modifications. In brief, hindgut content sample homogenates were heated in a water bath with lysozyme at 37°C for 1 h, incubated overnight, and added to 1 200-μL lysis buff er(0.1 mg/mL proteinase K, 10 mmol/L Tris-HCL,0.5% SDS, 100 mmol/L EDTA, and 0.005 mg/mL RNase A) at 55°C for 14 h. Genomic DNA was extracted using a standard phenol/chloroform method(phenol: chloroform: isoamyl alcohol, 25:24:1, v:v:v),precipitated with a double volume of ethanol and onetenth volume of 3 mol/L NaCl, and rinsed with 70%ethanol. The crude extracted DNA product was purified with the TIANgel Maxi Purification Kit(Tiangen Biotech, Co. Ltd., Beijing, China) and stored at -20°C. The 1.2-μm and 0.22-μm filters previously applied to collect microorganisms were used to extract DNA with the E.Z.N.A.®Water DNA Kit (Omega Bio-Tek, Norcross GA, USA) individually according to the manufacturer’s instructions. The DNA extracted from the two filters was pooled as a single sample for analysis.
Deep sequencing of the 16S rRNA gene amplicons was performed using the Illumina MiSeq paired-end sequencing platform at Guangzhou Jingge Biotechnology Co. Ltd. (Guangzhou, China). Briefly,the universal primers 515F(5′-GTGCCAGCMGCCGCGGTAA-3′) and 909R(5′-CCCCGYCAATTCMTTTRAGT-3′) with a unique 12-nt barcode were used to amplify the V4–V5 hypervariable region of 16S rRNA gene for highthroughput sequencing with the Miseq sequencer(Caporaso et al., 2010). The PCR mixture (25- μ L)contained 1×PCR buff er, 1.5 mmol/L MgCl2,0.4 μ mol/L of each deoxynucleoside triphosphate,1.0 μ mol/L of each primer, 0.5 U of Ex Taq (TaKaRa,Dalian, China), and 10-ng genomic DNA. The PCR amplification program included initial denaturation at 94°C for 3 min, followed by 30 cycles of 94°C for 40 s, 56°C for 60 s, 72°C for 60 s, and a final extension at 72°C for 10 min. Two PCR reactions for each sample were conducted and combined after PCR amplification. The PCR products were subjected to 1.0% agarose gel electrophoresis. The target band was excised and purified using the SanPrep DNA Gel Extraction Kit (cat# SK8132; Sangon Biotech,Shanghai, China) and quantified with a Nanodrop spectrophotometer (Nanodrop Technologies Inc.,Wilmington, DE, USA). All samples were pooled in equimolar quantities. The sequencing samples were prepared using the TruSeq DNA kit according to manufacturer’s instructions. The purified library was diluted, denatured, re-diluted, mixed with PhiX (equal to 30% of final DNA amount), as described in the Illumina library preparation protocols, and applied to an Illumina Miseq system for sequencing with the Reagent Kit v2 (Illumina, San Diego, CA, USA) as described in the manufacturer’s manual.
2.3 Statistical analysis
The sequence data were processed using QIIME Pipeline 1.7.0 (Caporaso et al., 2010). All sequence reads were trimmed and assigned to each sample based on their barcodes. The high-quality sequences(length>300 bp, without ambiguous base ‘N’, and mean base quality score>30) were used for the downstream analysis. The aligned 16S rRNA gene sequences were used for the chimera check in the Uchime algorithm (Edgar et al., 2011), and the chimera sequences were removed without further analysis. Sequences whose chimera sequences were removed were clustered into operational taxonomic units (OTUs) at a 97% identity threshold. Random resampling was conducted with QIIME Pipeline 1.7.0. Representative sequences of each OTU were used for taxonomic assignments by referencing the Ribosomal Database Project (RDP) classifier (Cole,2003) and the Greengenes database (DeSantis et al.,2006). The OTU composition data were further analyzed statistically. Community alpha-diversity indices were calculated to compare the bacterial communities in each sample. A clustering analysis was performed based on the community structure.Principal coordinates analysis (PCoA) was conducted based on community structural characteristics. All statistical analyses were accomplished with R package vegan (R Foundation for Statistical Computing,Vienna, Austria), QIIME Pipeline 1.7.0, and SPSS 13.0 for Microsoft Windows (SPSS Inc., Chicago, IL,USA). APvalue<0.05 was considered significant.

Table 2 Sequencing depth and taxonomic distribution of each sample
3 RESULT
3.1 Sequence data and microbial diversity analysis
In total, 157 326 high-quality 16S rRNA gene sequence reads and 24 439 OTUs were obtained from eight samples using the MiSeq Illumina sequencing platform. These OTUs were assigned to 62 different taxa. Each of the eight samples contained 7 117–47 344 reads and 1 939–6 293 OTUs (Table 2). The mean numbers of OTUs were 2 715.33±1 120.56(unhealthy fish), 4 378.33±1 951.49 (healthy fish),4 594 (ambient water sample from the unhealthy fish),and 3 719 (biofilter sample). No differences were found in the numbers of reads or OTUs between the unhealthy and healthy fish (P>0.05).
The mean number of OTUs in the unhealthy fish was well below that in the healthy fish. The OTU rarefaction curves clustered at 97% identity among the different samples. The rarefaction curves tended to approach the saturation plateau (Fig.S1).
Diversity indices have been used to describe species composition in a specific habitat and to differentiate among habitats (Peter et al., 2011). The alpha-diversity index values are shown in Table 3.The Chao1 estimators were 10 715.18±7 338.23 for the unhealthy fish and 7 693.61±2 977.04 for thehealthy fish (P>0.05). The Shannon–Wiener index reflects both species richness and evenness (Bik et al.,2006). The Shannon-Wiener and Simpson indices for the intestinal microbiota of the healthy fish were significant higher than that those of the unhealthy fish(P<0.05) (Table 3). The Good’s coverage rarefaction curves tended to approach the saturation plateau (Fig.S2). These results indicate that the intestinal microbiota of the healthy Atlantic salmon was much more diverse than that of unhealthy fish.
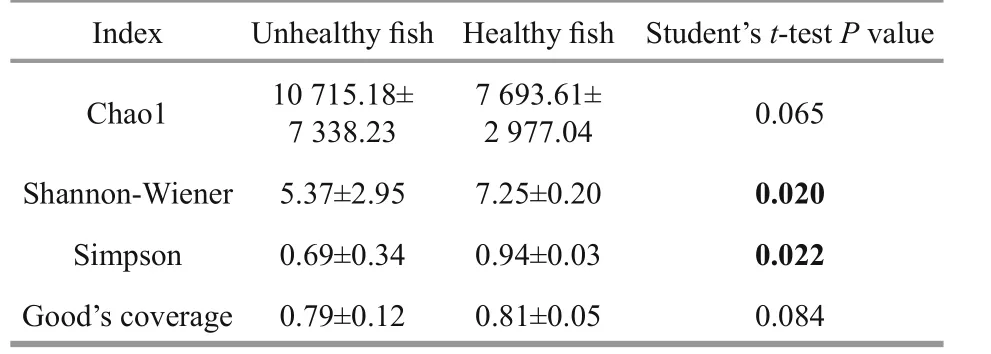
Table 3 Analysis of intestinal microbial diversity and Good’s coverage of unhealthy and healthy Atlantic salmon (mean±SD)
3.2 Microbial composition
The phylogenetic diversity of the bacterial communities was studied in all samples. The effective sequence reads were classified with the RDP classifier(ver. 2.2, http://sourceforge.net/projects/rdpclassifier/) and the Greengenes database (http://greengenes.lbl.gov/cgi-bin/nph-index.cgi). In total,62 phyla were identified in the fish intestines and water samples, nine of which were dominant (>1% of mean relative abundance). The 10 most abundant phyla constituted 98.05% (healthy fish), 98.07%(unhealthy fish), 97.28% (water), and 96.75%(biofilter) of the total reads. In general, the microbial composition of the tank water and biofilter samples was similar, with the dominant phyla Bacteroidetes(32.98% of total abundance), Proteobacteria(30.42%), and Firmicutes (10.40%). However, the dominant phyla in the healthy fish intestinal samples were Proteobacteria (44.33%), Actinobacteria(17.89%), Bacteroidetes (15.25%), and Firmicutes(9.11%), whereas they were Proteobacteria (70.46%),Bacteroidetes (7.59%), Firmicutes (7.55%), and Chloroflexi (2.71%) in the unhealthy fish intestines.Thus, Proteobacteria was clearly more abundant in the unhealthy fish intestinal samples than in the other samples (Fig.1).
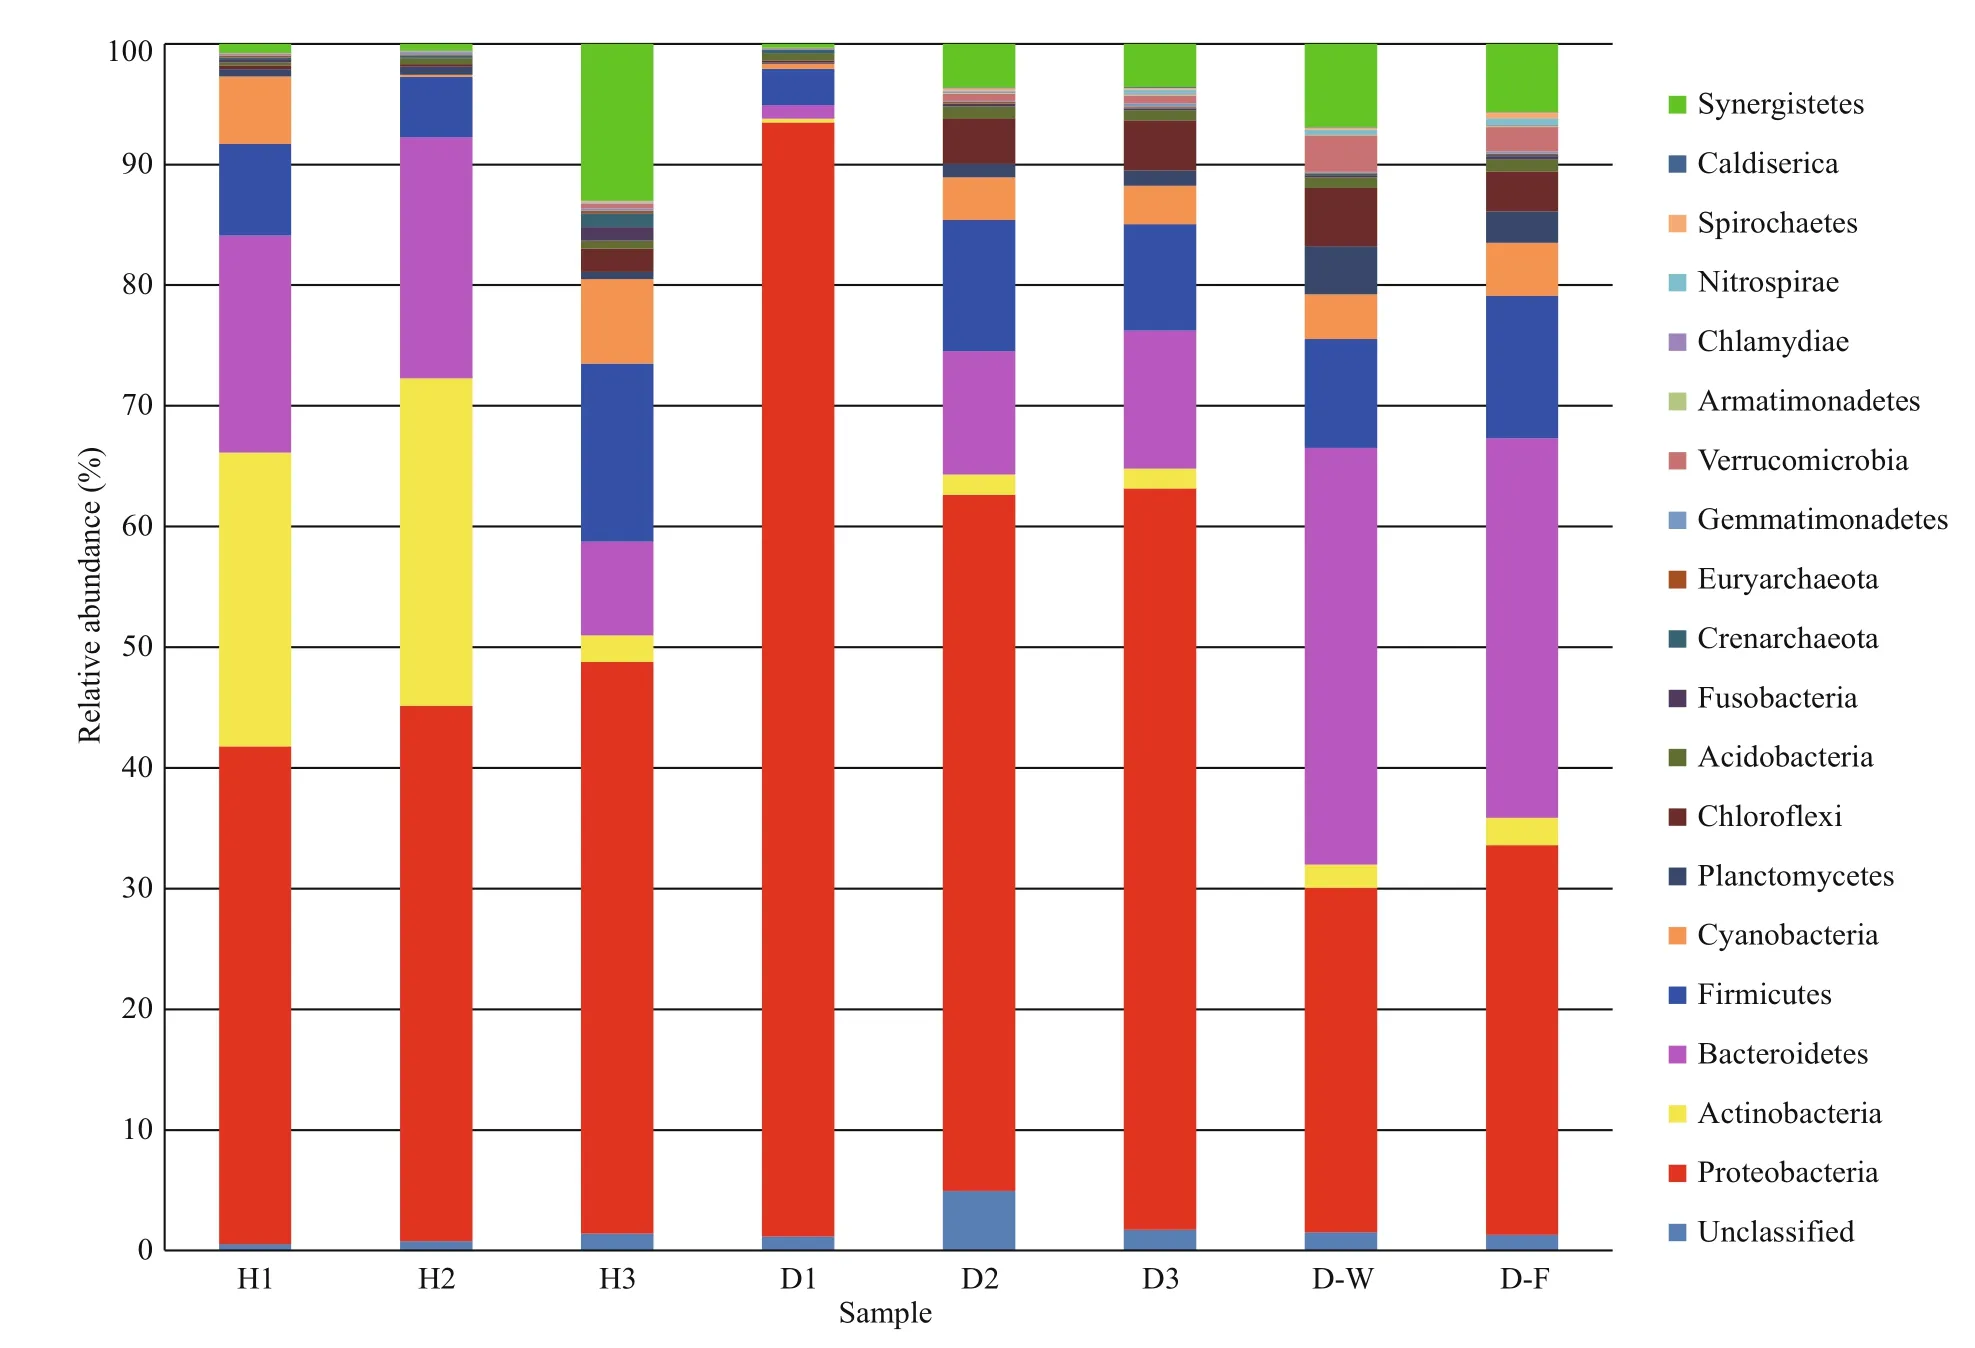
Fig.1 Relative abundance in intestinal microbial composition
We also investigated the most abundant genera of bacteria (>1% of mean relative abundance) in the fish intestines. Eleven bacterial genera in Proteobacteria,Actinobacteria, and Bacteroidetes found in the intestines of the unhealthy fish were very different from those found in the healthy fish (Table 4).Members of phylum Proteobacteria, genera of family Oxalobacteraceae and the generaSphingomonas Janthinobacterium,Burkholderia, andBalneimonaswere clearly far more abundant in the healthy fish intestines. Of these, genera in the family Oxalobacteraceae and Micrococcaceae, as well asSphingomonas,Streptomyces,Lactococcus, andPedobacterwere predominant in the healthy fish intestines.Streptomyces, genera in the family Micrococcaceae phylum Actinobacteria, andPedobacterin the phylum Bacteroidetes were also significantly strongly represented. In contrast,Aliivibrio,Vibrio, and genera in the family Aeromonadaceae of the Proteobacteria were far more abundant in unhealthy fish intestines (Table 4).Genera of the families Aeromonadaceae and Saprospiraceae and the generaAliivibrio,Vibrio,Sporolactobacillus, andClostridiumwere predominant in the unhealthy fish intestines. No significant differences were noted in the relative abundance ofLactococcus,Sporolactobacillus,Clostridium,Pseudomonas, or genera in the family Saprospiraceae in the healthy and unhealthy fish intestines. Genera of the families Saprospiraceae,Flavobacteriaceae, Rhodobacteraceae, and Flavobacteriaceae, as well asSporolactobacillus, andClostridiumwere predominant in the biofilter sample.Genera in the families Saprospiraceae,Flavobacteriaceae, and Rhodobacteraceae, as well asPolaribacter,Sporolactobacillus, andClostridiumwere predominant in the water sample (data not shown).
3.3 Main features of the microbial composition in the fish intestines
The total number of observed OTUs in the intestinal samples from healthy fish (H, see Fig.1 for sample coding) was 4 514, of which only 78 (1.73%) were also present in other samples. The predominant phyla shared by all healthy fish samples were Planctomycetes,Firmicutes, Bacteroidetes, and Actinobacteria,accounting for 38.46%, 23.08%, 14.10%, and 10.26%of total bacteria, respectively (Fig.2a). The H1 and H2 samples shared 420 (9.30%) of their total OTUs with the H3 sample, which was consistent with the results of hierarchical clustering and the PCoA. However,1 065 (H1), 1 084 (H2), and 1 820 (H3) OTUs were unique to a specific sample, and together constituted 87.93% of the total OTUs.

Table 4 Mean relative abundances (in % of sequences per treatment) and standard deviation of the most abundant genera of bacteria in the intestines of Atlantic salmon
A total of 4 612 OTUs were observed in the unhealthy fish samples (D, see Fig.1 for sample coding), of which only 35 (0.76%) were shared with other samples. The predominant phyla in the shared OTUs were Proteobacteria (37.14%), Firmicutes(17.14%), and Bacteroidetes (14.29%). The predominant common OTUs in the D2 and D3 samples accounted for 402 (8.72%) of all OTUs(Fig.2b).
3.4 Comparison in bacterial communities
The hierarchical clustering analysis revealed that the bacterial communities in healthy fish samples clustered together and then clustered secondarily with those of the unhealthy fish (Fig.S3). As shown by the weighted and unweighted Unifrac distances in the PCoA and heat map, fish samples collected from the diseased RAS clustered together and separately from the healthy fish cluster (Fig.3).
A heat map analysis of the bacterial communities at the genus level also demonstrated different compositions of the microbial community structures,and the unhealthy fish samples clustered together and separately from the healthy fish cluster (Fig.4).
The PCoA scores plot revealed that samples from healthy Atlantic salmon intestines (H1 and H2)showed unique bacterial communities, except for H3,which may be attributable to individual differences.All healthy fish intestinal samples grouped on the left side of the graph along PC1 and accounted for 45.28%of the total variation (Fig.3a), whereas the unhealthy fish samples were clustered together on the right side.The D1 sample remained separate from the other samples along PC2, representing 30.24% of the total variation. Overall, the two PCoA axes explained 75.52% of the total variation among the different communities (Fig.3).
4 DISCUSSION
The intestinal microbiota of fish plays important roles regulating the immune response, combating disease, and suppressing potential pathogens(Verschuere et al., 2000; Rawls et al., 2004; Ray et al.,2012). Changes in microbial diversity and abundance of intestinal bacteria constitute a microbial imbalance,which has positive and negative effects on the host fish (Gómez and Balcázar, 2008; Willing et al., 2011).
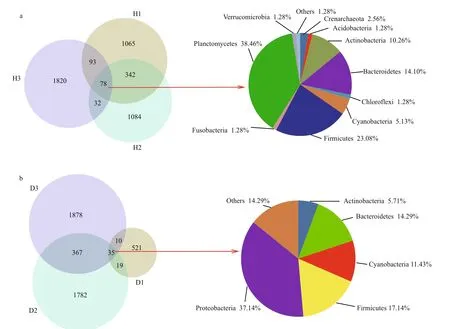
Fig.2 Overlap of Venn diagrams showing different bacterial communities in the operational taxonomic unit (OTU) samples(97% similarity) and the taxonomic identities of the OTUs in common at the phylum level
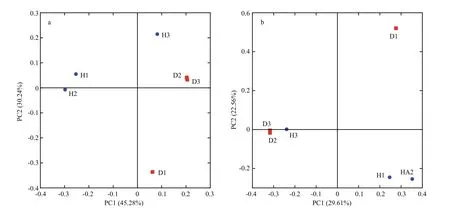
Fig.3 Principal coordinates analysis (PCoA) on weighted (a) and unweighted (b) Unifrac distances of the 16S rRNA genes
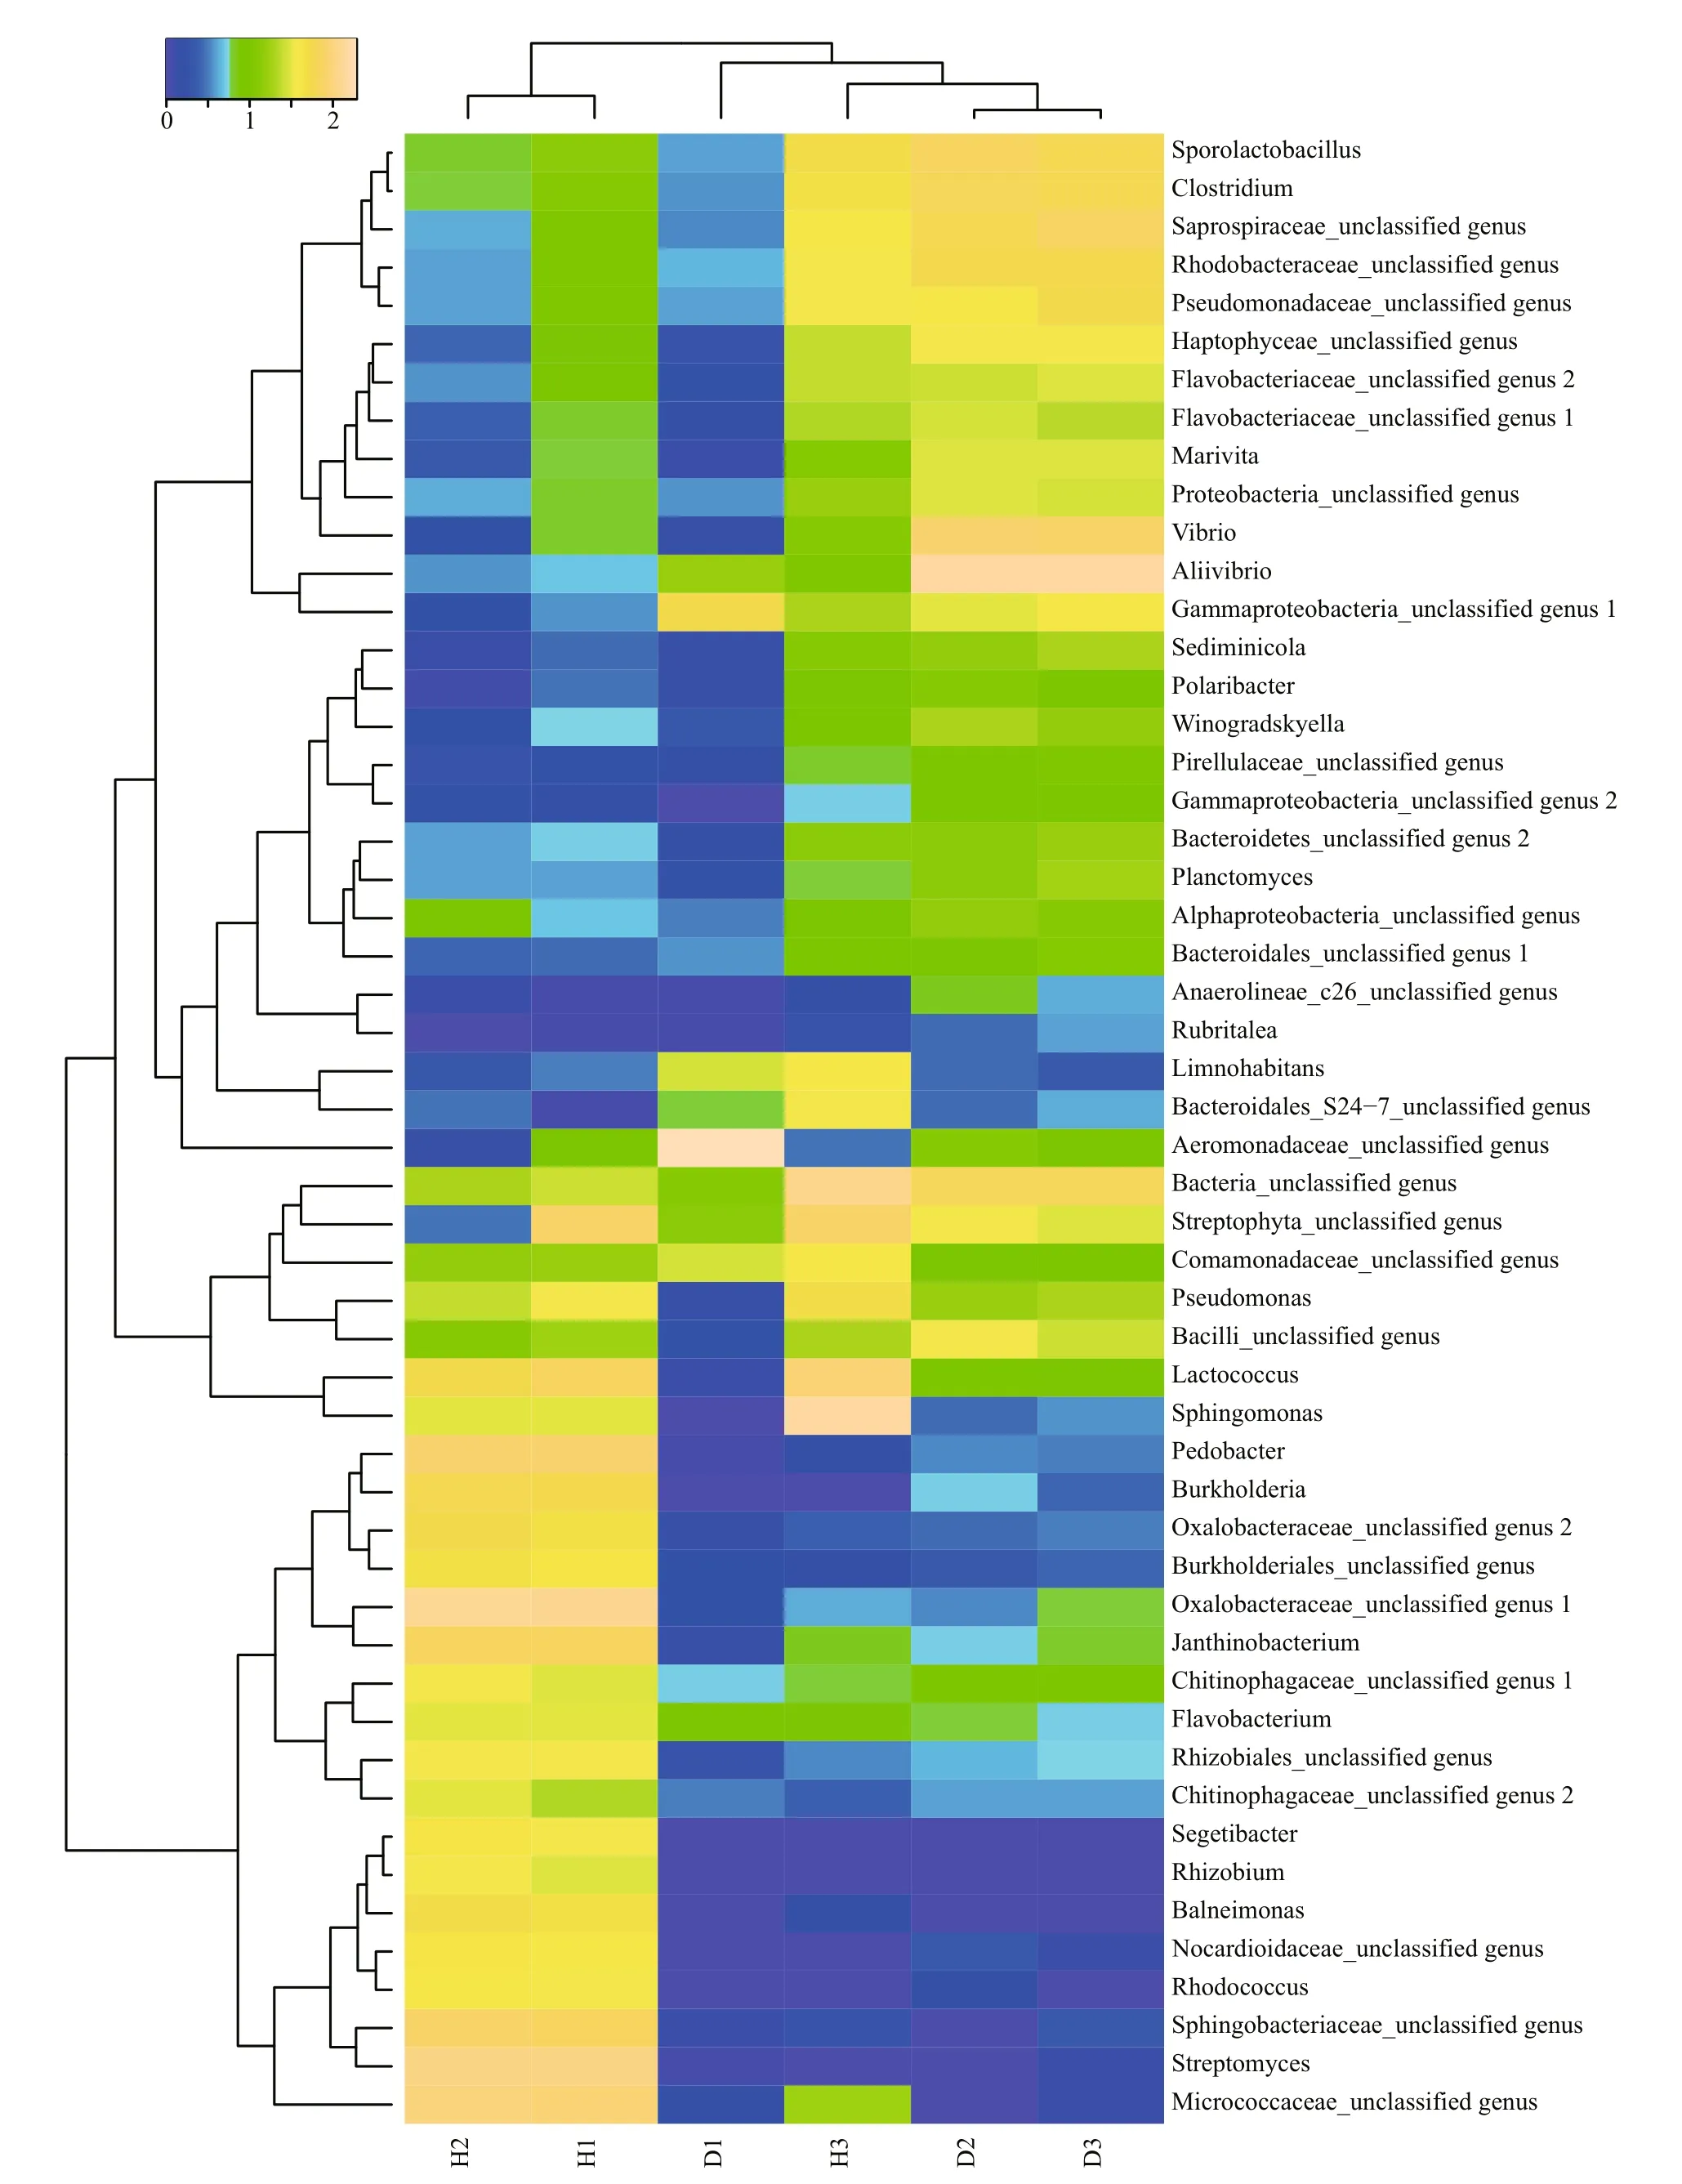
Fig.4 Heat map of bacterial genera in the fish intestinal and environmental samples
To understand the relationships between fish health status of Atlantic salmon and intestinal microbiota composition, we studied the community structure of its intestinal microbiota, which provides a good window to monitor fish health. In this study, the intestinal microbiota of healthy fish included Proteobacteria (44.33%), Actinobacteria (17.89%),Bacteroidetes (15.25%), and Firmicutes (9.11%),whereas that of unhealthy fish included Proteobacteria(70.46%), Bacteroidetes (7.59%), Firmicutes (7.55%),and Chloroflexi (2.71%). Consistent with these findings, Proteobacteria is a common dominant phylum in the intestine of rainbow trout (Kim et al.,2007), coho salmon (Romero and Navarrete, 2006),paddlefish, bighead carp (Li et al., 2014), and grass carp (Ni et al., 2014); therefore, this phylum has been found in both marine and freshwater fish species.Proteobacteria is the dominant phylum in the intestinal microbiome of Atlantic salmon during the freshwater and marine phases and is thought to be the bacterial core set of the intestinal microbiota (Llewellyn et al.,2015). A relatively stable but varied abundance of Proteobacteria was found in farmed Atlantic salmon with different health statuses in the present study.Proteobacteria is also closely related to inflammation(Shin et al., 2015). Approximately one in five human patients have a significantly altered microbiota during aNorovirusinfection, with loss of diversity and an increased proportion of Proteobacteria (Nelson et al.,2012), which is consistent with our results. An increase in the number of Proteobacteria is a common feature in infected individuals with an altered microbiota and can be considered a potential diagnostic signature of dysbiosis and increased risk for disease (Nelson et al., 2012; Shin et al., 2015).The present study is the first to examine the diversity and pathogenic potential of elevated Proteobacteria in Atlantic salmon infected withA.salmonicida.
Actinobacteria was a common bacterial phylum in the intestines of healthy Atlantic salmon, occurring in much greater abundance (17.89%) in healthy than in unhealthy fish samples (1.22%). Generally, members of Actinobacteria are widely distributed in terrestrial and aquatic ecosystems and are critical for recycling refractory biomaterials via biodegradation or decomposition and in the formation of humus(Goodfellow and Williams, 1983). Actinobacteria is also a predominant allochthonous microbial taxon in the intestinal contents of grass carp and rainbow trout(Han et al., 2010; Navarrete et al., 2010).Actinobacteria has a well-known capacity to biosynthesize secondary metabolites that act as potent antibiotics against invasive pathogens (Penn et al.,2009), such asA.hydrophila(Dharmaraj, 2011) andVibrio(Velmurugan et al., 2015). Nevertheless, the relative abundance of Actinobacteria was much lower in unhealthy Atlantic salmon than that in healthy fish,which was probably attributable to the serious microecological imbalance in intestinal microbiota caused by theA.salmonicidainfection. The mechanisms and dynamic changes in the Actinobacteria and intestinal microbiota during infection require further rigorous research.Interestingly, several studies have shown that patients with inflammatory bowel diseases show reduced microbial diversity and abundance of specific phyla,such as Bacteroidetes and Firmicutes, together with increased Proteobacteria, including the family Enterobacteriaceae (Blumberg and Powrie, 2012;Reveco et al., 2014). This is consistent with our findings, and calls for more investigation on the causal relationship between inflammatory bowel diseases and changes in the intestinal microbiota in aquaculture species, particularly fish.
The dominant phyla in the tank water included Bacteroidetes (34.53%), Proteobacteria (28.55%),Firmicutes (9.01%), and Chloroflexi (4.83%),whereas Proteobacteria (32.29%), Bacteroidetes(31.44%), Firmicutes (11.79%), and Cyanobacteria(4.41%) were present in the biofilter sample. The bacterial community structures of the tank water and biofilter were similar to those in the unhealthy fish intestine, which is consistent with the finding that a relatively balanced microflora was established when fish were grown in response to the external environment (Hansen and Olafsen, 1999; Sullam et al., 2012). More attention should be paid to the genus level for an in-depth analysis of specific groups of bacteria. Genera in the families Oxalobacteraceae and Micrococcaceae, as well asSphingomonas,Streptomyces,Lactococcus, andPedobacterwere dominant in the healthy Atlantic salmon, whereas genera in the families Aeromonadaceae and Saprospiraceae, as well asAliivibrio,Vibrio,Sporolactobacillus, andClostridiumwere dominant in unhealthy fish, and in much higher abundances than those in the healthy fish. Similar to the tank water sample, the biofilter sample predominantly contained genera in the families Saprospiraceae,Flavobacteriaceae, Rhodobacteraceae, and Flavobacteriaceae, as well asPolaribacter,Sporolactobacillus, andClostridium. Llewellyn et al.(2015) reported that Mycoplasmataceae phylotypes were abundant in the intestine of Atlantic salmon in the freshwater and marine phases. However, negligibleMycoplasmawas detected in the intestine of healthy farmed Atlantic salmon in this study and none in the unhealthy fish.Sporolactobacilluswas pervasive in the unhealthy Atlantic salmon intestine, and is believed to be capable of producing d-lactate efficiently and stimulating intestinal development and digestion (Wang et al., 2011). Members of the Archaea have been reported in the intestines of animals. At present, the only archaeal phylotype detected in the human intestinal microbiota is the methanogenic archaeonMethanobrevibactersmithii(Gill et al.,2006). In this study, 22 archaeal phylotypes were identified in the healthy fish intestine, and 15 in unhealthy fish. We foundNitrosopumilus,Methanosarcina,Halococcus,Methanosaetam, andMethanobrevibacterin both the healthy and unhealthy fish intestines, which have been reported in the grass carp intestine (Ni et al., 2014). These results indicate greater archaeal diversity in the intestines of farmed Atlantic salmon than that in the human intestine.Many studies have focused on the genomes and community structures of Archaea, but the role played by Archaea remains poorly understood, and the causes of variation in archaeal diversity in different host species remain unknown, although the contents of Archaea may be very small.
Some serious potential pathogens were also identified in unhealthy and healthy fish intestines.Aliivibrio,Vibrio, and genera in the family Aeromonadaceae were significantly more abundant in the unhealthy fish intestine than that in the healthy fish (P<0.05) (Table 4). Earlier studies showed thatA.salmonicidaandV.salmonicidaare the most serious pathogens in Atlantic salmon aquaculture(Ewart et al., 2005; Janda and Abbott, 2010). As opportunistic pathogens, genera in the family Aeromonadaceae, such asPseudomonas,Tolumonas,Flavobacterium,Vibrio,Photobacterium,Aliivibrio,andDesulfovibriowere detected in the healthy fish intestine in this study but in relatively low numbers(Table 4). Donskey (2004) published some identical data and proposed that the intestinal tract is a niche for many opportunistic pathogens.Sphingomonas,Streptomyces, andLactococcuswere detected in high abundance in the healthy fish intestines and have been described as probiotic bacteria in other animals(Koskinen et al., 2000; Balcázar et al., 2008; Das et al., 2010). However, whether they are helpful or harmful to Atlantic salmon requires further study.Understanding the dynamic variations in the relative abundance of opportunistic pathogens and probiotic bacteria is important when monitoring fish health in aquaculture (Verschuere et al., 2000). Novel technologies, such as metagenomics, are useful to describe functional and complex microbial communities (Round and Mazmanian, 2009). In many cases, pathogens, such asVibrio, are opportunistic and only cause disease when the host is under immune or physiological stress (Sommer and Bäckhed, 2013).Frequent infections occur in intensive culture when adverse environmental conditions are present(Defoirdt et al., 2007). The relationship between the health status of fish and the opportunistic pathogens in the fish intestine must be clarified.
Microbial communities are highly diverse in different species and are often refractory to the techniques used to measure their diversity (Hughes et al., 2001). Several indices, including the Shannon,Chao1, and Simpson indices have been used to assess different aspects of community assemblages,including species richness, evenness, and abundance.Our results show that the Shannon-Wiener diversity and Simpson indices of the intestinal microbiota were significantly lower in unhealthy Atlantic salmon(P<0.05) than those in healthy fish. Several studies have reported that the intestinal bacterial population can be affected in fish suff ering diet-induced enteritis,regardless of bacterial diversity (Bakke-McKellep et al., 2007; Desai et al., 2012; Reveco et al., 2014).Severe enteritis was detected in the unhealthy Atlantic salmon in the present study, and bacterial diversity was significantly reduced in the intestinal samples from these fish, which is consistent with a previous study (Reveco et al., 2014). The maintenance of a healthy state in fish is complex and requires a delicate balance between the host and the indigenous microbiota. A reduction in microbial diversity will reduce the set of ecosystem processes available, such as a reduced capacity to digest a diverse diet, causing lower energy levels and reduced resistance to pathogens by the host (Giongo et al., 2011). Ecological theory predicts that diverse communities are better able to resist invasion by exotic species than simple communities (Levine and D’Antonio, 1999). A highly diverse intestinal microbiota contributes to the maintenance of healthy Atlantic salmon. The relationship between fish health and intestinal bacterial diversity indices has been demonstrated in the present study but requires further research.
5 CONCLUSION
In this study, we found that the intestinal microbiota of healthy and unhealthy farmed Atlantic salmon differed. Significantly higher bacterial diversity was observed in the healthy fish intestine than that in the unhealthy fish intestine. Some opportunistic pathogens were significantly more abundant in the unhealthy fish intestine, whereas the healthy fish intestine hosted significantly more probiotic bacteria.These results provide information for the early detection of infectious diseases in cultured fish species.
Backhed F, Ding H, Wang T, Hooper L V, Koh G Y, Nagy A,Semenkovich C F, Gordon J I. 2004. The gut microbiota as an environmental factor that regulates fat storage.Proc.Natl.Acad.Sci.U.S.A.,101(44): 15 718-15 723.
Bakke-McKellep A M, Penn M H, Salas P M, Refstie S,Sperstad S, Landsverk T, Ringø E, Krogdahl Å. 2007.effects of dietary soyabean meal, inulin and oxytetracycline on intestinal microbiota and epithelial cell stress, apoptosis and proliferation in the teleost Atlantic salmon (SalmosalarL.).Brit.J.Nutr.,97(4): 699-713.
Balcázar J L, Vendrell D, de Blas I, Ruiz-Zarzuela I, Muzquiz J L, Girones O. 2008. Characterization of probiotic properties of lactic acid bacteria isolated from intestinal microbiota of fish.Aquaculture,278(1-4): 188-191.
Bik E M, Eckburg P B, Gill S R, Nelson K E, Purdom E A,Francois F, Perez-Perez G, Blaser M J, Relman D A.2006. Molecular analysis of the bacterial microbiota in the human stomach.Proc.Natl.Acad.Sci.U.S.A.,103(3): 732-737.
Blumberg R, Powrie F. 2012. Microbiota, disease, and back to health: a metastable journey.Sci.Transl.Med.,4(137):137rv7.
Caporaso J G, Kuczynski J, Stombaugh J, Bittinger K,Bushman F D, Costello E K, Fierer N, Peña A G, Goodrich J K, Gordon J I, Huttley G A, Kelley S T, Knights D,Koenig J E, Ley R E, Lozupone C A, McDonald D,McDonald B D, Pirrung M, Reeder J, Sevinsky J R,Turnbaugh P J, Walters W A, Widmann J, Yatsunenko T,Zaneveld J, Knight R. 2010. QIIME allows analysis of high-throughput community sequencing data.Nat.Methods.,7(5): 335-336.
Claesson M J, Jeff ery I B, Conde S, Power S E, O’Connor E M, Cusack S, Harris H M B, Coakley M, Lakshminarayanan B, O’Sullivan O, Fitzgerald G F, Deane J, O’Connor M,Harnedy N, O’Connor K, O’Mahony D, van Sinderen D,Wallace M, Brennan L, Stanton C, Marchesi J R,Fitzgerald A P, Shanahan F, Hill C, Ross R P, O’Toole P W. 2012. Gut microbiota composition correlates with diet and health in the elderly.Nature,488(7410): 178-184.
Cole J R. 2003. The ribosomal database project (RDP-II):previewing a new autoaligner that allows regular updates and the new prokaryotic taxonomy.Nucleic.Acids.Res.,31(1): 442-443.
Das S, Ward L R, Burke C. 2010. Screening of marineStreptomycesspp. for potential use as probiotics in aquaculture.Aquaculture,305(1-4): 32-41.
Defoirdt T, Boon N, Sorgeloos P, Verstraete W, Bossier P.2007. Alternatives to antibiotics to control bacterial infections: luminescent vibriosis in aquaculture as an example.Trends.Biotechnol.,25(10): 472-479.
Desai A R, Links M G, Collins S A, Mansfield G S, Drew M D,Van Kessel A G, Hill J E. 2012. effects of plant-based diets on the distal gut microbiome of rainbow trout(Oncorhynchusmykiss).Aquaculture,350-353: 134-142.
DeSantis T Z, Hugenholtz P, Larsen N, Rojas M, Brodie E L,Keller K, Huber T, Dalevi D, Hu P, Andersen G L. 2006.Greengenes, a chimera-checked 16S rRNA gene database and workbench compatible with ARB.Appl.Environ.Microbiol.,72(7): 5 069-5 072.
Dharmaraj S. 2011. Antagonistic potential of marine actinobacteria against fish and shellfish pathogens.Turk.J.Biol.,35(3): 303-311.
Donskey C J. 2004. The role of the intestinal tract as a reservoir and source for transmission of nosocomial pathogens.Clin.Infect.Dis.,39(2): 219-226.
Du Y S, Yi M M, Xiao P, Meng L J, Li X, Sun G X, Liu Y.2015. The impact of Aeromonas salmonicida infection on innate immune parameters of Atlantic salmon (Salmo salarL).Fish.Shellfish.Immun.,44(1): 307-315.
Edgar R C, Haas B J, Clemente J C, Quince C, Knight R. 2011.UCHIME improves sensitivity and speed of chimera detection.Bioinformatics,27(16): 2 194-2 200.
Ewart K V, Belanger J C, Williams J, Karakach T, Penny S,Tsoi S C M, Richards R C, Douglas S E. 2005.Identification of genes differentially expressed in Atlantic salmon (Salmosalar) in response to infection byAeromonassalmonicidausing cDNA microarray technology.Dev.Comp.Immunol.,29(4): 333-347.
Gill N, Wlodarska M, Finlay B. 2011. Roadblocks in the gut:barriers to enteric infection.Cell.Microbiol.,13(5): 660-669.
Gill S R, Pop M, DeBoy R T, Eckburg P B, Turnbaugh P J,Samuel B S, Gordon J I, Relman D A, Fraser-Liggett C M,Nelson K E. 2006. Metagenomic analysis of the human distal gut microbiome.Science,312(5778): 1 355-1 359.
Giongo A, Gano K A, Crabb D B, Mukherjee N, Novelo L L,Casella G, Drew J C, Ilonen J, Knip M, Hyöty H, Veijola R, Simell T, Simell O, Neu J, Wasserfall C H, Schatz D,Atkinson M A, Triplett E W. 2011. Toward defining the autoimmune microbiome for type 1 diabetes.ISMEJ,5(1): 82-91.
Gómez G D, Balcázar J L. 2008. A review on the interactions between gut microbiota and innate immunity of fish.FEMSImmunol.Med.Microbiol.,52(2): 145-154.
Goodfellow M, Williams S T. 1983. Ecology of actinomycetes.Annu.Rev.Microbiol.,37: 189-216.
Gustafson C E, Thomas C J, Trust T J. 1992. Detection of Aeromonas salmonicida from fish by using polymerase chain reaction amplification of the virulence surface array protein gene.Appl.Environ.Microbiol.,58(12): 3 816-3 825.
Han S F, Liu Y C, Zhou Z G, He S X, Cao Y N, Shi P, Yao B,RingÖ E. 2010. Analysis of bacterial diversity in the intestine of grass carp (Ctenopharyngodonidellus) based on 16S rDNA gene sequences.Aquac.Res.,42(1): 47-56.
Hansen G H, Olafsen J A. 1999. Bacterial interactions in early life stages of marine cold water fish.Microb.Ecol.,38(1):1-26.
Hooper L V, Littman D R, Macpherson A J. 2012. Interactions between the microbiota and the immune system.Science,336(6086): 1 268-1 273.
Hughes J B, Hellmann J J, Ricketts T H, Bohannan B J M.2001. Counting the uncountable: statistical approaches to estimating microbial diversity.Appl.Environ.Microbiol.,67(10): 4 399-4 406.
Janda J M, Abbott S L. 2010. The genus aeromonas: taxonomy,pathogenicity, and infection.Clin.Microbiol.Rev.,23(1):35-73.
Kim D H, Brunt J, Austin B. 2007. Microbial diversity of intestinal contents and mucus in rainbow trout(Oncorhynchusmykiss).J.Appl.Microbiol.,102(6):1 654-1 664.
Koskinen R, Ali-Vehmas T, Kämpfer P, Laurikkala M, Tsitko I,Kostyal E, Atroshi F, Salkinoja-Salonen M. 2000.Characterization ofSphingomonasisolates from Finnish and Swedish drinking water distribution systems.J.Appl.Microbiol.,89(4): 687-696.
Levine J M, D'Antonio C M. 1999. Elton revisited: a review of evidence linking diversity and invasibility.Oikos,87(1):15-26.
Li X M, Yu Y H, Feng W S, Yan Q Y, Gong Y C. 2012. Host species as a strong determinant of the intestinal microbiota of fish larvae.J.Microbiol.,50(1): 29-37.
Li X M, Zhu Y J, Yan Q Y, Ringø E, Yang D G. 2014. Do the intestinal microbiotas differ between paddlefish (Polyodon spathala) and bighead carp (Aristichthysnobilis) reared in the same pond?.J.Appl.Microbiol.,117(5): 1 245-1 252.
Llewellyn M S, McGinnity P, Dionne M, Letourneau J, Thonier F, Carvalho G R, Creer S, Derome N. 2015. The biogeography of the atlantic salmon (Salmosalar) gut microbiome.ISMEJ.,10(5): 1 280-1 284.
Manichanh C, Borruel N, Casellas F, Guarner F. 2012. The gut microbiota in IBD.Nat.Rev.Gastroenterol.Hepatol.,9(10): 599-608.
Navarrete P, Magne F, Mardones P, Riveros M, Opazo R, Suau A, Pochart P, Romero J. 2010. Molecular analysis of intestinal microbiota of rainbow trout (Oncorhynchus mykiss).FEMSMicrobiol.Ecol.,71(1): 148-156.
Nelson A M, Walk S T, Taube S, Taniuchi M, Houpt E R,Wobus C E, Young V B. 2012. Disruption of the human gut microbiota following Norovirus infection.PLoSOne,7(10): e48224.
Ni J J, Yan Q Y, Yu Y H, Zhang T L. 2014. Factors influencing the grass carp gut microbiome and its effect on metabolism.FEMSMicrobiol.Ecol.,87(3): 704-714.
Ni J J, Yu Y H, Zhang T L, Gao L. 2012. Comparison of intestinal bacterial communities in grass carp,Ctenopharyngodonidellus, from two different habitats.Chin.J.Oceanol.Limnol.,30(5): 757-765.
Nicholson J K, Holmes E, Kinross J, Burcelin R, Gibson G, Jia W, Pettersson S. 2012. Host-gut microbiota metabolic interactions.Science,336(6086): 1 262-1 267.
O'Hara A M, Shanahan F. 2006. The gut flora as a forgotten organ.EMBORep.,7(7): 688-693.
Penn K, Jenkins C, Nett M, Udwary D W, Gontang E A,McGlinchey R P, Foster B, Lapidus A, Podell S, Allen E E, Moore B S, Jensen P R. 2009. Genomic islands link secondary metabolism to functional adaptation in marine Actinobacteria.ISMEJ.,3(10): 1 193-1 203.
Peter H, Beier S, Bertilsson S, Lindström E S, Langenheder S,Tranvik L J. 2011. Function-specific response to depletion of microbial diversity.ISMEJ.,5(2): 351-361.
Rawls J F, Samuel B S, Gordon J I. 2004. Gnotobiotic zebrafish reveal evolutionarily conserved responses to the gut microbiota.Proc.Natl.Acad.Sci.U.S.A.,101(13):4 596-4 601.
Ray A K, Ghosh K, Ringø E. 2012. Enzyme-producing bacteria isolated from fish gut: a review.Aquacult.Nutr.,18(5):465-492.
Reveco F E, Øverland M, Romarheim O H, Mydland L T.2014. Intestinal bacterial community structure differs between healthy and inflamed intestines in Atlantic salmon (SalmosalarL.).Aquaculture,420-421: 262-269.
Ringø E, Birkbeck T H. 1999. Intestinal microflora of fish larvae and fry.Aquac.Res.,30(2): 73-93.
Romero J, Navarrete P. 2006. 16S rDNA-based analysis of dominant bacterial populations associated with early life stages of coho salmon (Oncorhynchuskisutch).Microb.Ecol.,51(4): 422-430.
Round J L, Mazmanian S K. 2009. The gut microbiota shapes intestinal immune responses during health and disease.Nat.Rev.Immunol.,9(5): 313-323.
Shin N R, Whon T W, Bae J W. 2015.Proteobacteria: microbial signature of dysbiosis in gut microbiota.Trends Biotechnol.,33(9): 496-503.
Sommer F, Bäckhed F. 2013. The gut microbiota—masters of host development and physiology.Nat.Rev.Microbiol.,11(4): 227-238.
Sullam K E, Essinger S D, Lozupone C A, O'Connor M P,Rosen G L, Knight R, Kilham S, Russell J A. 2012.Environmental and ecological factors that shape the gut bacterial communities of fish: a meta-analysis.Mol.Ecol.,21(13): 3 363-3 378.
Velmurugan S, John S T, Nagaraj D S, Ashine T A, Kumaran S,Pugazhvendan S. 2015. Isolation of actinomycetes from shrimp culture pond and antagonistic to pathogenic Vibrio spp. and WSSV.Int.J.Curr.Microbiol.App.Sci.,4(7):82-92.
Verschuere L, Rombaut G, Sorgeloos P, Verstraete W. 2000.Probiotic bacteria as biological control agents in aquaculture.Microbiol.Mol.Biol.R.,64(4): 655-671.
Wang L M, Zhao B, Li F S, Xu K, Ma C Q, Tao F, Li Q G, Xu P. 2011. Highly efficient production of D-lactate bySporolactobacillussp. CASD with simultaneous enzymatic hydrolysis of peanut meal.Appl.Microbiol.Biot.,89(4): 1 009-1 017.
Wang T T, Cai G X, Qiu Y P, Fei N, Zhang M H, Pang X Y, Jia W, Cai S J, Zhao L P. 2012. Structural segregation of gut microbiota between colorectal cancer patients and healthy volunteers.ISMEJ.,6(2): 320-329.
Willing B P, Russell S L, Finlay B. 2011. Shifting the balance:antibiotic effects on host-microbiota mutualism.Nat.Rev.Microbiol.,9(4): 233-243.
Wolfensohn S, Lloyd M. 2008. Handbook of Laboratory Animal Management and Welfare. 3rdedn. John Wiley &Sons, United Kingdom.
Wu S G, Wang G T, Angert E R, Wang W W, Li W X, Zou H.2012. Composition, diversity, and origin of the bacterial community in grass carp intestine.PLoSOne,7(2):e30440.
Yan Q Y, van der Gast C J, Yu Y H. 2012. Bacterial community assembly and turnover within the intestines of developing zebrafish.PLoSOne,7(1): e30603.
Zheng Y F, Yu M, Liu Y, Su Y, Xu T, Yu M C, Zhang X H.2016. Comparison of cultivable bacterial communities associated with Pacific white shrimp (Litopenaeus vannamei) larvae at different health statuses and growth stages.Aquaculture,451: 163-169.
猜你喜欢
民间文学(2021年2期)2021-03-24
青年文学家(2020年22期)2020-08-31
课堂内外·创新作文高中版(2018年8期)2018-10-15
环球人物(2017年15期)2017-08-31
做人与处世(2017年12期)2017-07-27
思维与智慧·上半月(2017年4期)2017-04-11
意林(2015年2期)2015-05-14
文史月刊(2014年5期)2014-09-24
故事会(2007年10期)2007-05-14
 Journal of Oceanology and Limnology2018年2期
- Journal of Oceanology and Limnology的其它文章
- An aftereffect of global warming on tropical Pacific decadal variability*
- Analysis of monthly variability of thermocline in the South China Sea*
- A numerical study of the South China Sea Warm Current during winter monsoon relaxation*
- Predicting the sinkage of a moving tracked mining vehicle using a new rheological formulation for soft deep-sea sediment*
- Chemical characterization of fractions of dissolved humic substances from a marginal sea—a case from the Southern Yellow Sea*
- The morphological and molecular detection for the presence of toxic Cylindrospermopsis (Nostocales, Cyanobacteria) in Beijing city, China*