淀粉基荧光碳点的快速绿色制备及其在白光LED中的应用
2018-06-28 01:48郑静霞刘兴华杨永珍刘旭光许并社
新型炭材料 2018年3期
郑静霞, 刘兴华, 杨永珍, 刘旭光, 许并社
(1. 太原理工大学 新材料界面科学与工程教育部重点实验室, 山西 太原030024;2. 太原理工大学 新材料工程技术研究中心, 山西 太原030024;3. 太原理工大学 材料科学与工程学院, 山西 太原030024)
1 Introduction
Since carbon dots (CDs) first appeared in 2006, they have been gaining importance in both fundamental research and industry owing to their unique and novel properties[1]. The most notable properties are their high stability, high solubility in water, low toxicity, excellent bio-compatibility, variable photoluminescence (PL) behavior, which make CDs have a wide range of applications in different fields including electrochemical applications[2], photocatalysis[3], waste water treatment[4], bio-imaging[5], chemical sensing[6, 7]and optical devices like lighting-emitting diode (LED)[8-10]. Among, a variety of synthesis approaches involving arc-discharge[11], laser ablation[12], chemical oxidation[13, 14], electrochemical synthesis[15], hydrothermal method[9]and microwave method[16,17], microwave-assisted technique, seems to be the most facile, time-saving and economical method and has been widely applied in virtue of simultaneous, homogeneous and efficient heating, which leads to fast reaction rate and uniform size distribution of products[18-21].
Since carbon is the element that can be found in every organic matter, CDs can be prepared from easily available organic matters. At present, in most cases, precursors of CDs were derived from fine carbon structure (like graphene[22]and carbon nanotubes[23]) or traditional chemical substances (e.g. citric acid monohydrate[7,9]and carbohydrate[24]). Alternatively, some successes have been achieved recently by employing renewable resources as the raw materials (such as plant leaf[25], papaya[26], milk[27], aloes[28]and waste rice husk[29]).
Starch, which widely exists in plants, is a readily accessible, low-cost, renewable and environmentally friendly raw material. In 2014, fluorescent organic nanoparticles based on carbohydrate polymers were prepared through one-pot hydrothermal treatment of starch in the presence of polyethyleneimine by Wei group[30]. And the fluorescent organic nanoparticles exhibit a high water dispersibility and good biocompatibility with cells, making them highly potential for various biomedical applications. In 2015, Ogale et al[31]. prepared photoluminescent CDs from starch through a solution method under mild conditions. The as-prepared CDs were used as photoluminescence probes for highly anion-selective fluoride ion detection in aqueous solutions. Tan group reported a facile alkali-assisted hydrothermal method to fabricate polysaccharide fluorescent nanostructures using starch and chitosan as the raw materials in 2016[24]. The starch-based nanostructures showed a low cell cytotoxicity and high possibility for application in mouse melanoma cells and guppy fish imaging. In the same year, as-prepared carbon nanoparticles were mixed with starch in acetone solvent, and fluorescent starch powder was obtained after ultrasonic agitation and drying. Fluorescent starch powder as fluorescent marks was used for detecting latent fingerprints in non-porous surfaces, which showed high quality fluorescent images. Obviously, this method is simple, rapid, green, and effective, enabling its practical applications in forensic sciences[32]. Despite recent amazing advances in the applications of the CDs prepared with starch, there remains broad research space for this topic. For example, widening the application of CDs is still highly needed.
Hence, in this study, to efficiently and quickly synthesize CDs from starch with good fluorescent property, starch as the carbon source was adopted to prepare CDs by a rapid, simple and cost-efficient method based on microwave-assisted hydrothermal carbonization of the precursor as shown in Fig. 1.

Fig. 1 Synthesis scheme of fluorescent CDs from starch and their applications in WLEDs.
The effects of starch concentration, reaction time and temperature on the fluorescent properties and quantum yield (QY) of CDs were investigated and optimized. Under the same optimal preparation parameters with CDs, nitrogen-doped CDs (N-CDs) were synthesized using ethylenediamine as a nitrogen additive. TheQYof the N-CDs are greatly increased and they present yellow-white fluorescence in solid state. Above all, CD/starch composite and the N-CDs as phosphors were combined with UV chips (λem=365 nm) to fabricate white light-emitting diode (WLED) devices, which presents great potential for applications in the field of optoelectronic devices.
2 Experimental
2.1 Materials
Potato starch was purchased from local supermarket. Quinine sulfate was acquired from Sinopharm Chemical Reagent Co., Ltd. Sulfuric acid was supplied by Luoyang Chemical Reagent Factory. Ethylenediamine (EDA) was purchased from Tianjin Fuchen Chemical Reagent Factory. All chemicals were used as received without further purification unless otherwise specified. Deionized water was used throughout this study.
2.2 Synthesis of CDs
To obtain optimal fluorescent property of CDs, the effect of experimental conditions including reaction time (10, 20, 30, 40, 50 min), reaction temperature (180, 200, 220 ℃) and the concentration of starch aqueous solutions (0.3, 0.5, 1.0 and 5.0 mg/mL) was discussed in sequence. In a typical CD synthesis, a certain amount of starch was dissolved in 15 mL of deionized water by heating and continuously stirring to form a colloidal solution. The as-prepared precursor solution was then transferred into a pressure-resistant vial and heated up to a given temperature for a certain time in a microwave reactor (Monowave 300, Anton Paar (China) co. LTD).
To obtain photoluminescent nitrogen-doped CDs (N-CDs), 1 mL of EDA was added into the starch precursor solution under the optimal experimental conditions for CDs. After cooled down to room temperature, the large particles were removed from as-synthesized CDs and N-CDs solutions through filtering using a 0.22 μm membrane. Finally, the powders of CDs and N-CDs were obtained by freeze drying at -80 ℃ for 2 days, and stored at room temperature for further measurements.
2.3 Preparation of WLEDs
To achieve the application of starch-based CDs in WLEDs, the CD/starch composite and the N-CDs as phosphors, were combined with a UV chip to prepare the WLED devices.
First, to realize the fluorescent emission of CDs in the solid-state, CD/starch composite (mass ratio: 1∶20) was prepared by mixing the CDs and starch in deionized water[33,34]. After constant stirring for 5 h, the mixture was centrifugated for removing un-adsorbed CDs, and the precipitation was freeze-dried in a vacuum freeze dryer. Thus, the CD/starch composite was obtained.
Then, for obtaining solidified CD phosphors, the CD/starch composite or N-CDs powder were dispersed in 1 mL of a PVA solution (1.0 g of PVA in 15 mL of deionized water) under stirring or ultrasonic treatment for 15 min. The CD/starch composite-PVA or N-CD-PVA solution was slowly dripped into the inner wall of optical lens, which was then left in a drying oven at 80 ℃ for 4 h.
Finally, for fabricating the LED device, the UV chip (emission wavelength at 365 nm) was fixed on a LED base. Then, the optical lens was placed on the bottom of the LED chip.
2.4 Characterization
UV-visible (UV-vis) absorption analysis was performed using a Hitachi U3900 UV-vis spectrophotometer. The photoluminescence (PL) spectrum was obtained using a Horiba Fluoromax-4 luminescence spectrometer equipped with a Xe lamp as the excitation source. The morphology and microstructure of the CDs were examined by transmission electron microscopy (TEM) on a JEOL JEM-2010 using an accelerating voltage of 200 kV. The X-ray photoelectron spectroscopy (XPS) spectrum of the sample was recorded on a Kratos AXIS ULTRA DLD X-ray photoelectron spectrometer with an exciting source of AlKα= 1 486.6 eV. Fourier transform infrared (FT-IR) analysis of the CD powder was carried out in the form of KBr pellets with a BRUKER TENSOR 27 spectrometer. The fluorescence decay status and fluorescence lifetime of CDs were measured by transient fluorescence & phosphorescence (FLS980). The thermal analysis (TA) was conducted with a NETZSCH TG209F3 instrument in nitrogen atmosphere at a heating rate of 10 ℃/min. The Spectra Scan PR 655 was applied to analyze the emission spectra, CIE coordinates and correlated color temperature (CCT) of the LEDs.
Quantum yield (QY) of the CDs was determined by a relative method[35], and measured by using quinine sulfate in a sulfuric acid solution as a reference. TheQYwas calculated according to the following equation:
综上所述,老年肺炎患者在发病早期血清中PCT、hs-CRP及D-Dimer水平就会升高,血清PCT、hs-CRP及D-Dimer水平与肺炎严重程度存在正相关性,病情越严重,其浓度亦越高,在疾病早期检测上述3项指标,有利于评估疾病的严重程度,及时指导临床用药。对于控制病情,降低病死率具有较高的临床意义。但因本研究样本量偏少,可能使数据分析产生一定偏倚,为减少这种偏倚,后续将开展更加深入及更大规模的研究。
(1)
whereQis theQY,Ais the optical density,Gis the measured integrated emission intensity, andnis the refractive index (1.33 for water). The subscripts s and x refer to the standard quinine sulfate and the testing sample, respectively. To obtain more reliable results, the concentration of CDs and quinine sulfate for estimation should be selected to adjust the optical absorbance values between 0-0.1 at 360 nm to avoid any significant reabsorption.
3 Results and discussion
3.1 Optimal fluorescent property of CDs
3.1.1 The effect of reaction time
Reaction time, as the kinetic factor of microwave-assisted hydrothermal reaction, plays a significant role in the synthesis of CDs. Therefore, the influence of reaction time on the fluorescent property of CDs was first investigated. With 1 mg/mL starch colloidal solution, CDs were prepared at 220 ℃ for different reaction times (10-50 min, with an interval of 10 min). Fig. 2(a) shows that PL intensity of CD solution first increases and then decreases with increasing reaction time. When the reaction time is 30 min, PL intensity of CD solution reaches the maximum. Probably, a short reaction time leads to inadequate carbonization and a too long reaction time exacerbates the degree of disruption of the surface functional groups of CDs, thus leading to a decrease of the fluorescent intensity[36]. Meanwhile, theQYof as-prepared CD aqueous solution is estimated by a relative method (Fig. 2(b)) and the changing trend of PL intensity of CDs with different reaction times accords with that ofQY(1.33%, 1.67%, 2.46%, 1.90% and 1.79% for 10, 20,30, 40 and 50 min, respectively). When the reaction time is 30 min, the maximumQYis 2.46%. Consequently, 30 min was chosen as the optimal reaction time for the synthesis of CDs.
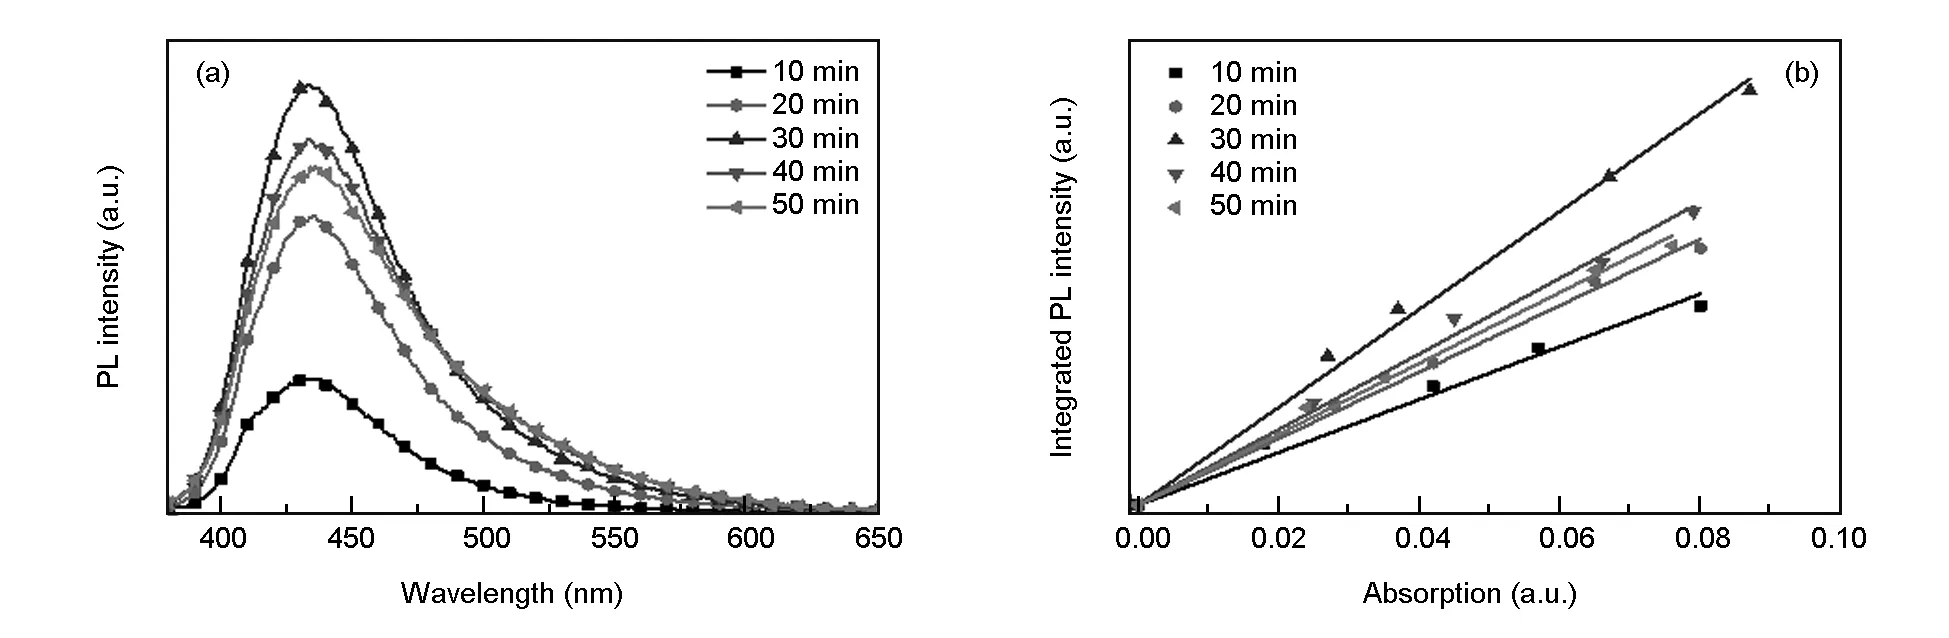
Fig. 2 (a) PL emission spectra and (b) QY measurements of CDs prepared at different reaction times.
3.1.2 The effect of reaction temperature
Carbohydrate was dehydrated and carbonized during microwave-assisted hydrothermal reaction, and reaction temperature also has a crucial influence on the synthesis of CDs. With 1 mg/mL starch colloidal solution, CDs were prepared at 180-220 ℃ (the interval of 20 ℃) for 30 min (above-mentioned optimal time). In Fig. 3(a), with increasing reaction temperature, the PL intensity of CD solution enhances continuously. The PL intensity maximizes and theQYof CDs reaches the highest value of 2.46% at 220 ℃, as shown in Fig. 3(b). A reasonable explanation is that the degree of carbonization of CDs increases as the temperature rises, which results in an increase ofQYand the PL enhancement of CDs[25,37]. Given that the highest allowable temperature of the microwave reactor is 230, 220 ℃ was chosen as the optimal reaction temperature for the synthesis of CDs.
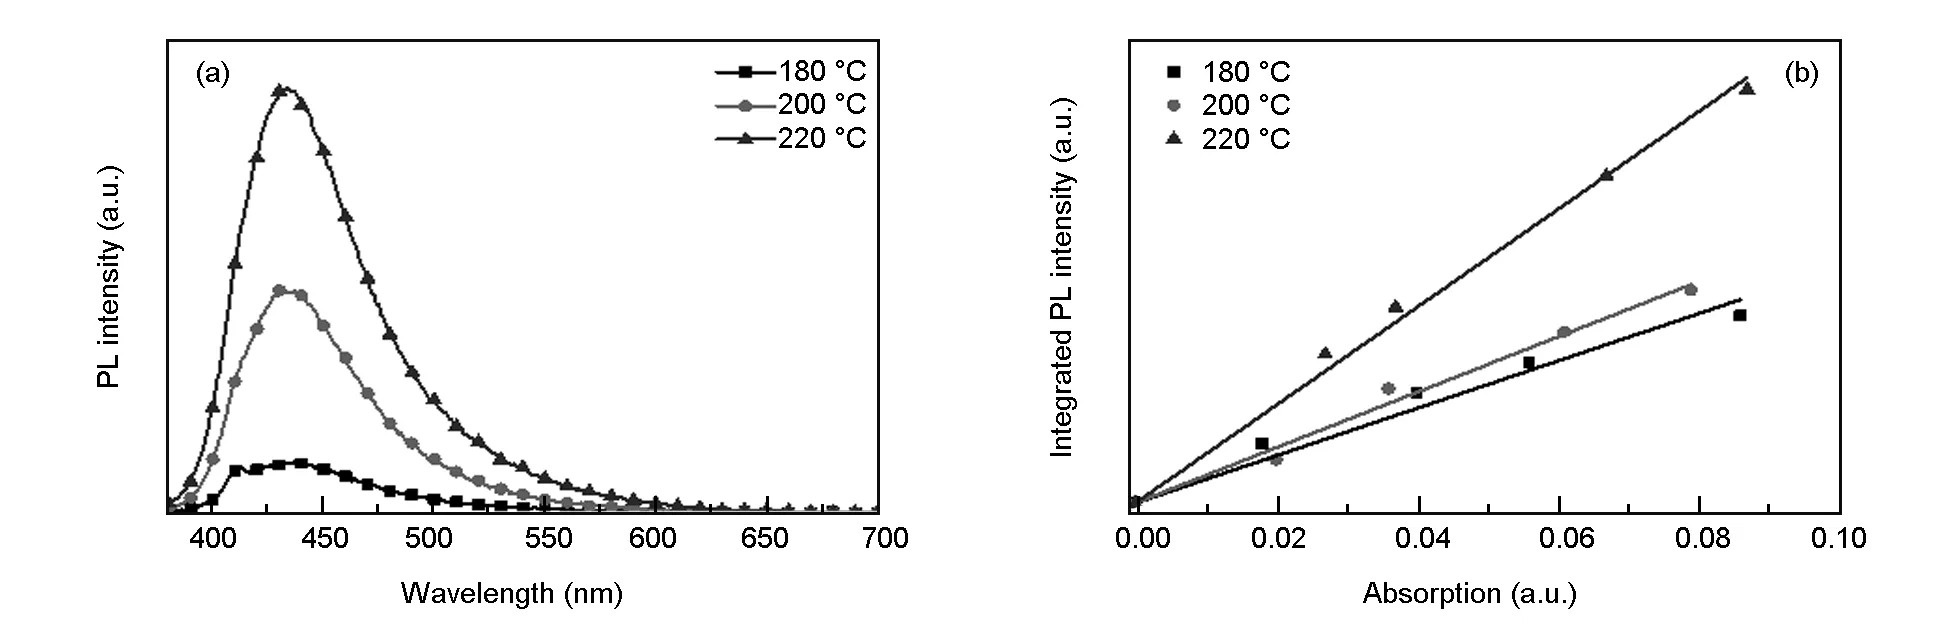
Fig. 3 (a) PL emission spectra and (b) QY measurements of CDs prepared at different reaction temperatures.
3.1.3 The effect of the concentration of starch colloidal solution
The influence of the concentration of starch colloidal solution on fluorescent emission andQYof CDs was investigated. CDs were synthesized with different concentrations of starch colloidal solutions (0.3, 0.5, 1.0 and 5.0 mg/mL) at 220 ℃ (above-mentioned optimal time) for 30 min. As presented in Fig. 4(a), the PL intensity of CD solution enhances with increasing the concentration from 0.3 to 1.0 mg/mL, while PL intensity weakens when the concentration of starch solution is higher than 1.0 mg/mL. When the concentration of starch solution is 1.0 mg/mL, the PL intensity is strongest and theQYof CDs is highest. This may be because CDs prepared at the concentration of 1.0 mg/mL have the highest degree of carbonization[29].

Fig. 4 (a) PL emission spectra and (b) QY measurements of CDs prepared at different concentrations of starch colloidal solutions.
3.1.4 The effect of nitrogen dopant

Fig. 5 (a) PL emission spectra and (b) QY measurements of the CDs and N-CDs prepared under the same conditions.
Next, the effect of EDA doping amount on the fluorescence properties of the N-CDs was investigated. TheQYof the N-CDs shows a volcano tendency that is increasing first and then decreasing, with the increase of EDA dosage, as shown in Fig. 6.
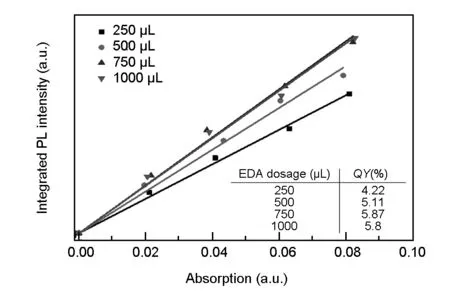
Fig. 6 QY measurements of the N-CDs prepared under different EDA dosages.
When the doping amount of EDA added to the starch colloidal solution is 250 μL, theQYof the N-CDs is about 4.22%. With increasing dosage of EDA, the N-doping amount increases, and thus theQYof the N-CDs continues to rise until it reaches the maximum value of 5.87% at the EDA dosage of 750 μL. As the dosage of EDA further increases, excessive introduction of nitrogen-containing functional groups leads to the increase in surface defects of the N-CDs and consequently in the non-radiative transitions of electrons. As a result, theQYof the N-CDs is dropped slightly when the dosage of EDA is 1 000 μL. In summary, when the EDA dosage is 750 μL, the maximumQYof the N-CDs is obtained as 5.87%.
3.2 Morphology and structure characterization
TEM images of as-obtained CDs and the N-CDs are shown in Fig. 7. The average diameter of the spherical CDs derived from sole starch is around 3.0 nm (Fig. 7(a)), while the N-CDs from starch and EDA are quasi-spherical with an average particle size of about 4.5 nm (Fig. 7(b)). The starch containing long chains of glucose units with hydroxyl groups is converted to polymeric material by the microwave-assisted hydrothermal method via polycondensation, and then to CDs after carbonization. Besides, the N-CDs with a bigger polymer molecular network are formed by the reaction of the hydroxyl group of starch with the amino group of EDA during the polycondensation and carbonization[44]. Therefore, the particle sizes of the N-CDs are larger than those of CDs.
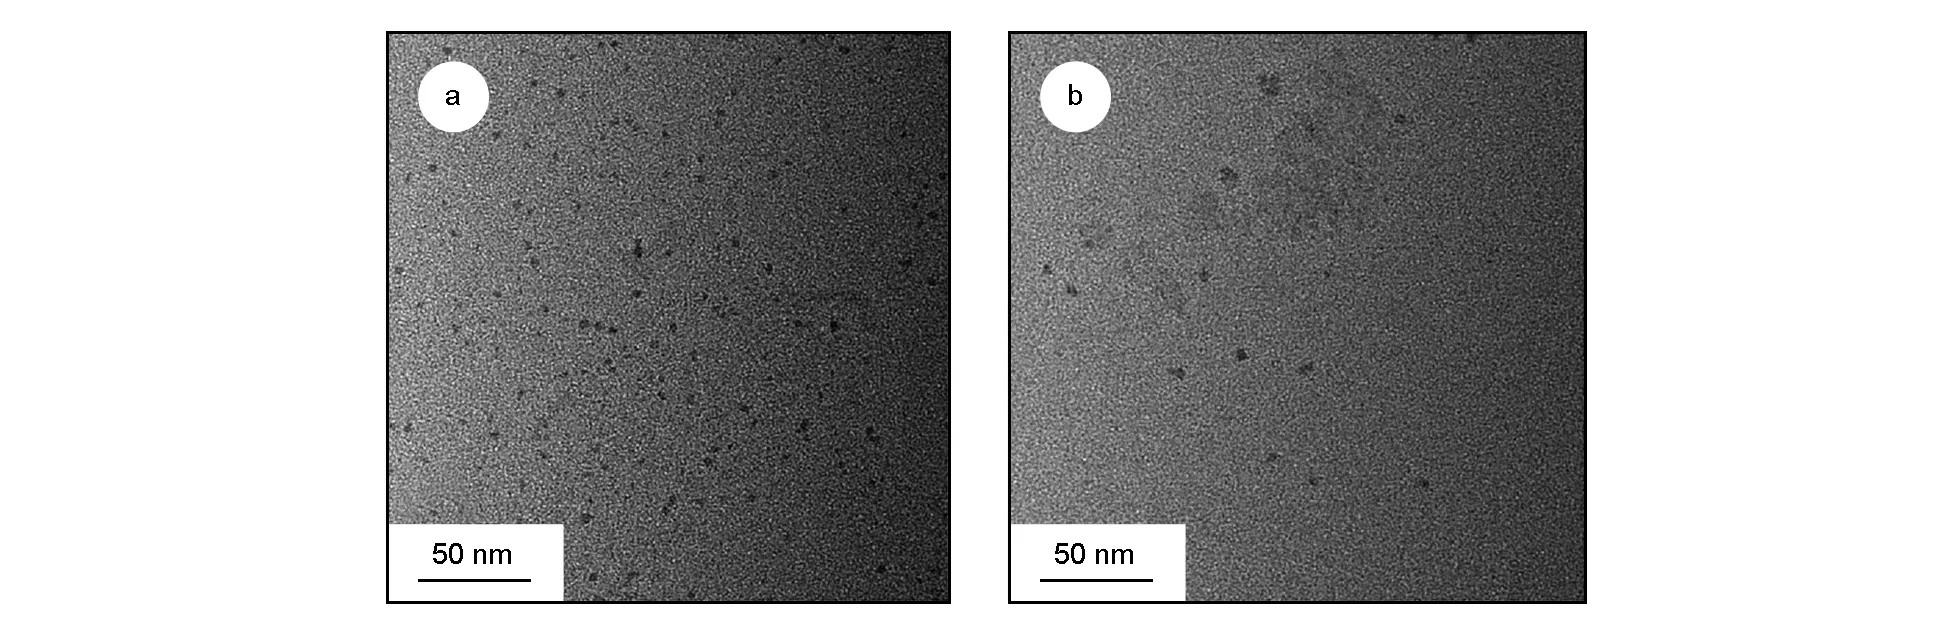
Fig. 7 TEM images of the (a) CDs and (b) N-CDs.


Fig. 8 FTIR spectra of the CDs and N-CDs.

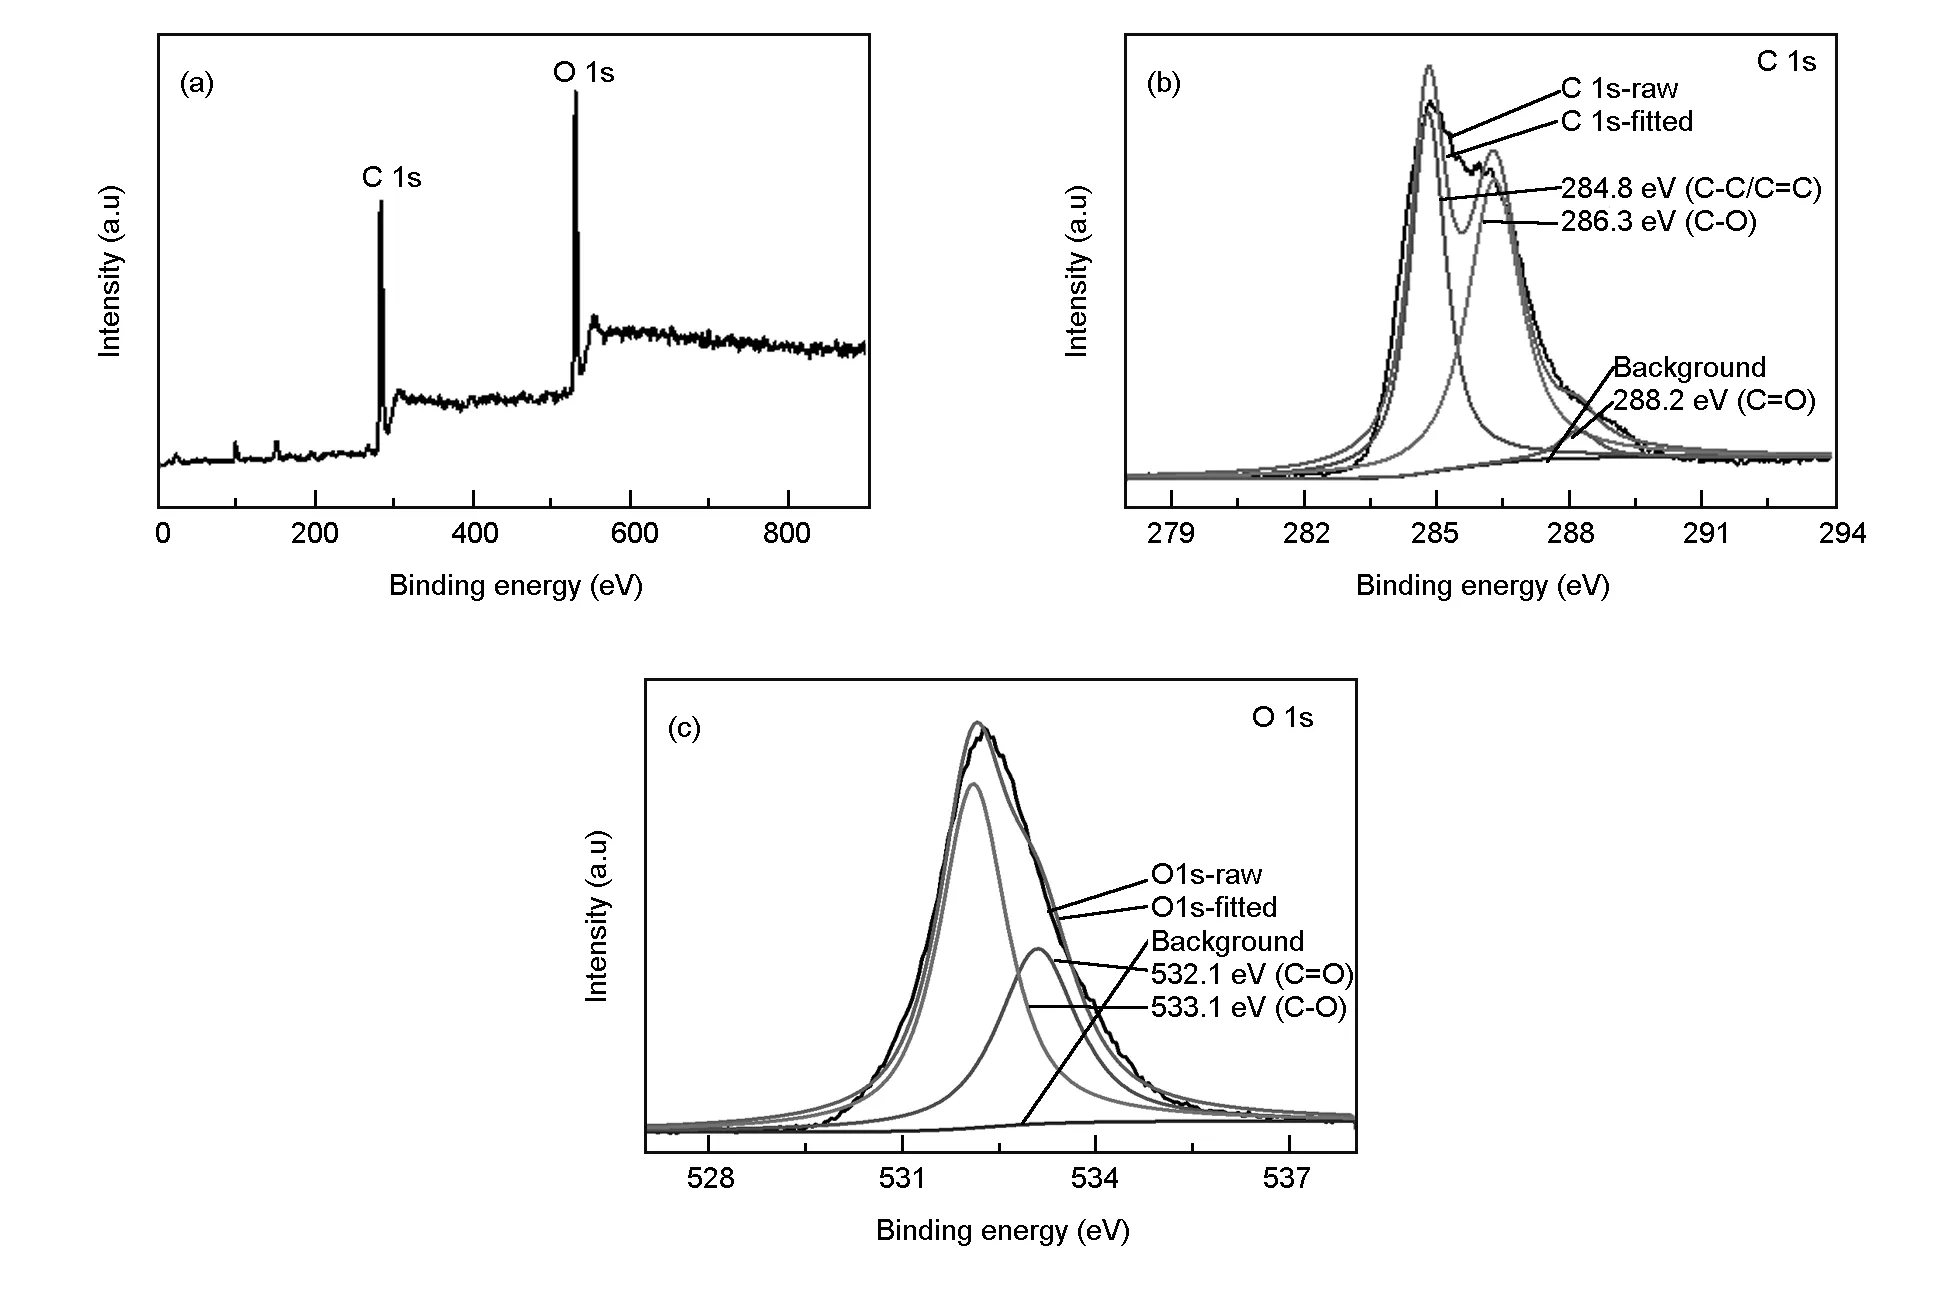
Fig. 9 (a) XPS survey, (b) C 1s and (c) O 1s high resolution spectra of the CDs.
3.3 Optical properties

Fig. 10 (a) XPS survey, (b) C 1s, (c) O 1s and (d) N 1s high resolution spectra of the N-CDs.

Fig. 11 UV-vis absorption spectra of the CDs and N-CDs.
The fluorescent emission spectra of the CDs and N-CDs are shown in Fig. 12. Under the effect of excitation light with different wavelengths, the emitted light with different wavelengths is mainly in the visible range, suggesting that the CDs and N-CDs both exhibit an excitation-dependent emission phenomenon. The emission wavelengths of the CDs and N-CDs shift toward longer wavelengths with the increase of excitation wavelength. The CDs emit blue fluorescence under 360 nm excitation light and show the strongest emission peak at 433 nm in Fig. 12(a). While the N-CDs display similar properties at the 320 nm excitation light in Fig. 12(b), with a maxi mum emission at 385 nm. This results indicate that the N-doping can change the surface states of the CDs and thus leads to the blue-shifting of wavelength[36]. The excitation-dependent fluorescent behavior of the CDs and N-CDs might be ascribed to the influence of different surface states derived from different particles sizes[24, 46, 47].
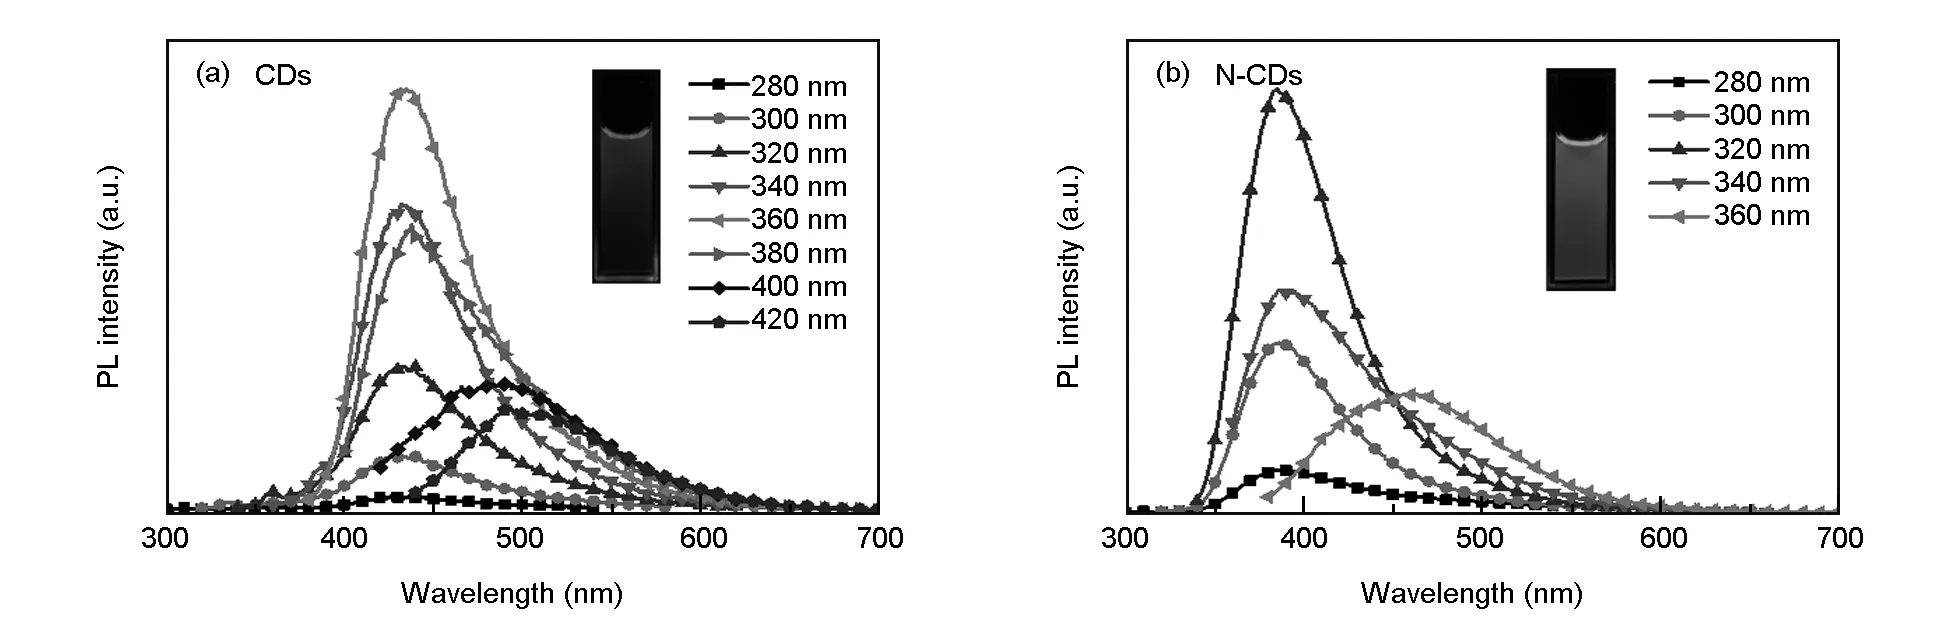
Fig. 12 PL emission spectra of (a) CD solution and (b) N-CD solution at different excitation wavelengths. Inset: Photograph of (a) CD solution and (b) N-CD solution under UV (λex=365 nm) illumination.
Interestingly, compared with the CD powder with no fluorescence under UV light, N-CD powder emits yellow-green fluorescence under UV irradiation with emission wavelength at 485 nm (inset (right) of Fig. 13). There is no remarkable difference in PL spectra between the N-CD solution and solid-state N-CDs as seen in Fig. 13, indicating that the N-CDs maintain the inherent fluorescent property in both states, which is beneficial for further application of the N-CDs as phosphors.

Fig. 13 PL emission spectra of N-CD aqueous solution and N-CD powder under UV irradiation. Inset: photographs of N-CD powder under day light (left) and UV light (right).
To testify the feasibility of the CDs and N-CDs as phosphors for applications in white LEDs, their spectral compositions were measured and analyzed, as shown in Fig. 14. By the integration of fluorescent intensity for individual wavelength segment in PL spectra, the red-green-blue spectral compositions of the CDs and N-CDs were calculated to be 50.01% and 63.43%, respectively. Nitrogen doping effectively promote the proportion of red-green-blue spectral composition. A plausible explanation is that the red-green-blue spectral composition mainly depends on the carbogenic core structure, which determines the intrinsic fluorescence emission[9,48]. The formation of the CDs is mainly the carbonization of starch, while the formation of the N-CDs is composed of carbonization and amidation of starch and EDA, thus forming two kinds of the carbogenic core structure. In comparison to the CDs, N-CDs with a higher proportion of red-green-blue spectral composition show the advantage of converting UV light from UV chip into visible light, which is in favor of improving the color rendering index of WLED devices.
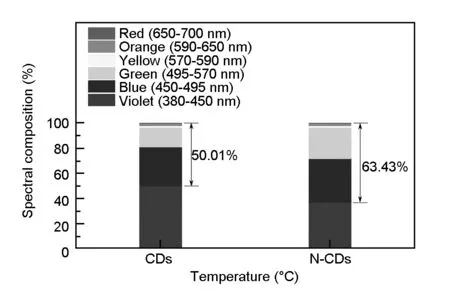
Fig. 14 Spectral compositions of the CDs and N-CDs.
To acquire further insight into the photoluminescence, the time-resolved fluorescent behavior of CDs (solution), N-CDs (powder) and N-CDs (solution) were investigated under the laser with excitation wavelength of 375 nm. As illustrated in Fig. 15 and Table 1, all CDs exhibit double exponential decay, and the fitting functions is as follows.
Y(t)=α1exp(-t/τ1)+α2exp(-t/τ2)
(1)

(2)
The fitting parameters are summarized in Table 1.
The calculated average lifetime of CDs (solution), N-CDs (powder) and N-CDs (solution) are 2.56, 4.68 and 7.00 ns, respectively. Relative to the CDs, the prominently increased lifetime of the N-CDs reveals decreased nonradiative trap and increased fluorophore density, which may be closely associated with nitrogen doping[49]and the carbonization of the N-CDs[50].
Structural stability is considered as an important factor for CDs applied in the field of LED devices. Fig. 16 presents the thermogravimetric analysis curves for the CDs and N-CDs heated up to 800 ℃ in N2atmosphere. In agreement with previous reports, carbon cores are seen to survive within the whole range of applied temperatures[42,51]. Below 150 ℃, two samples demonstrate slopes with a similar behavior. At higher temperature than 150 ℃, the N-CDs began to lose their surface amino-groups around this temperature. Obviously, the as-prepared CDs and N-CDs are thermally stable enough for the fabrication and operation of LEDs, because the working temperature of LED is no more than 150 ℃[8].
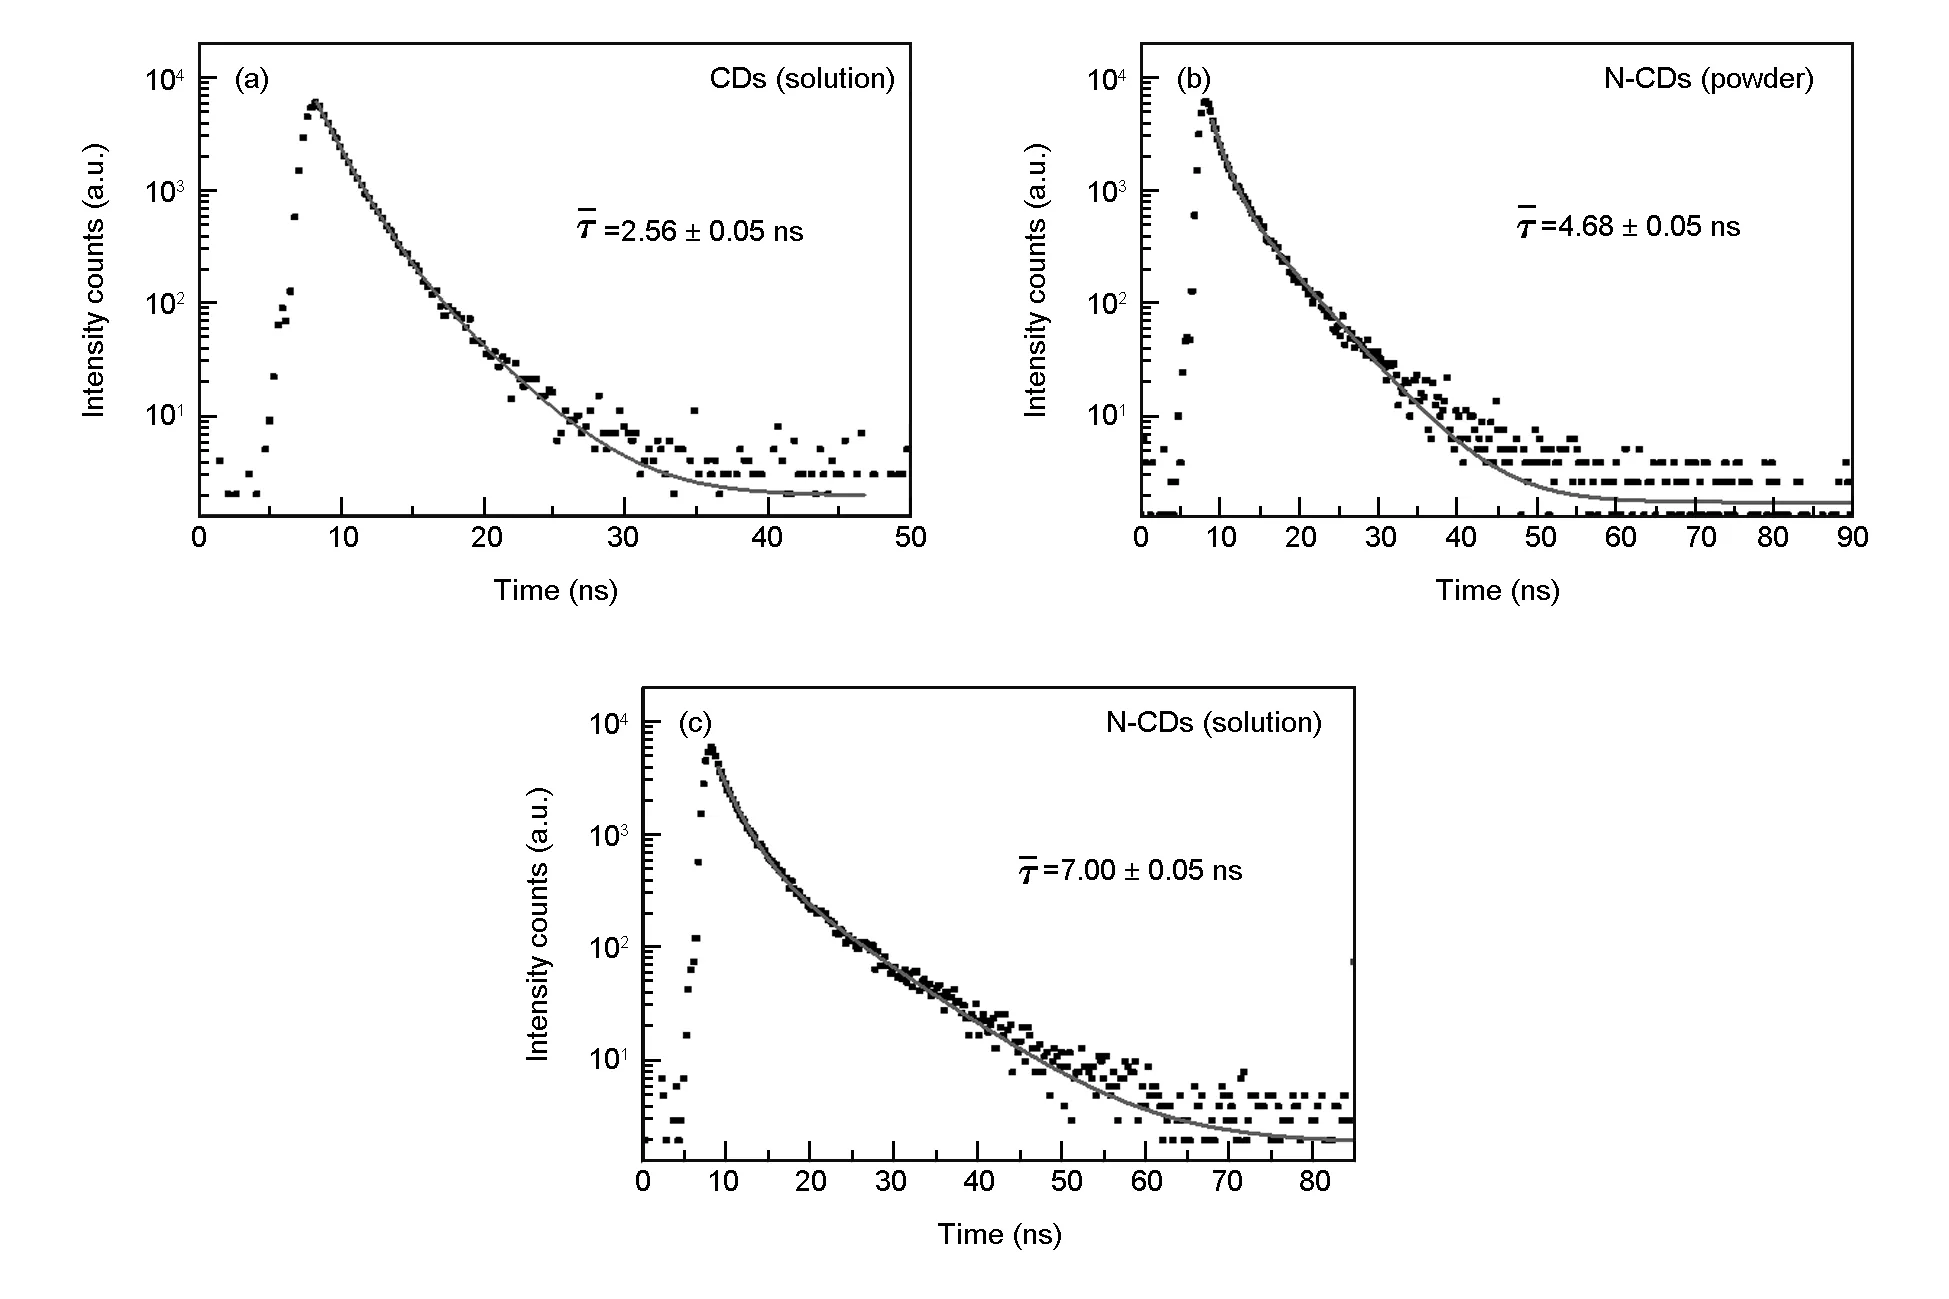
Fig. 15 Time-resolved fluorescent decay curves for CDs (solution), N-CDs (powder) and N-CDs (solution).
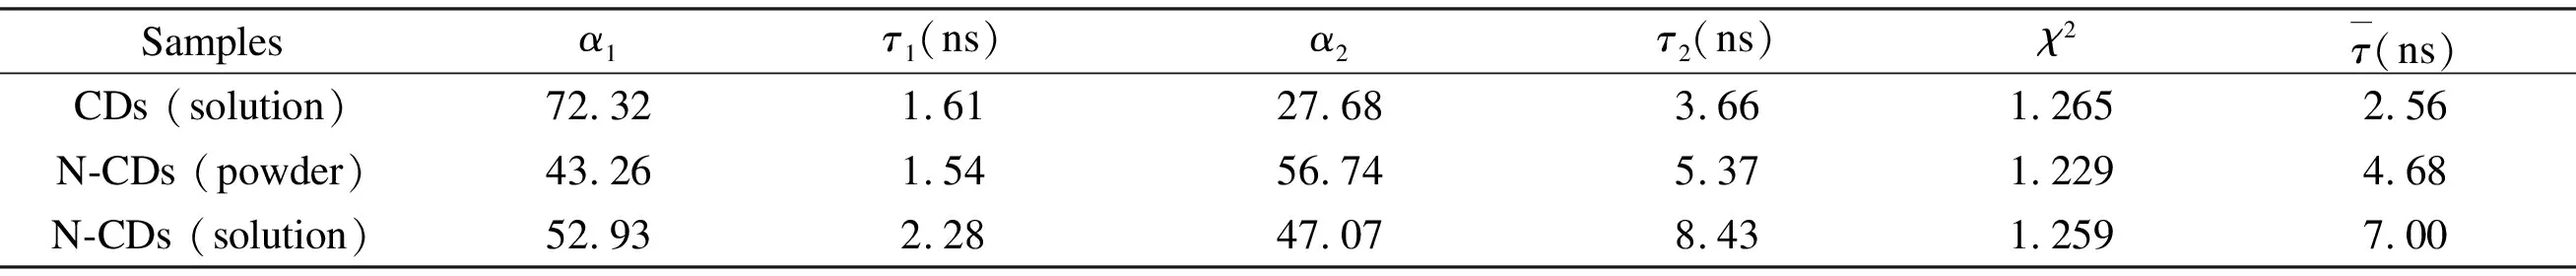
Samplesα1τ1 (ns)α2τ2 (ns)χ2τ(ns)CDs (solution)72.321.6127.683.661.2652.56N-CDs (powder)43.261.5456.745.371.2294.68N-CDs (solution)52.932.2847.078.431.2597.00
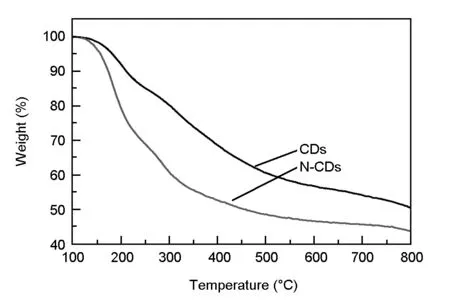
Fig. 16 The thermogravimetric analysis curves of the CDs and N-CDs under N2 atmosphere.
3.4 Application of starch-based CDs in WLEDs
By virtue of their PL properties and good thermal ability, the CD/starch composite and N-CDs phosphors were applied to fabricate WLED devices[8]. The emission spectrum of as-prepared WLED device is shown in Fig. 17(a). Applying an operating voltage of 2.9 V, we obtain a yellowish white light from the CD/starch composite-based WLED and a white light from the N-CDs based WLED with CIE (Commission Internationale d’Éclairage) coordinates of (0.38, 0.45) and (0.33, 0.35), as well as the correlated color temperature of 4 329 and 5 437 K, respectively, as shown in Fig. 17(b). These results demonstrate the success in LED fabrication from the starch-based CDs, which is reported for the first time, which indicate that the starch-based CDs have enormous potential for practical phosphor applications.
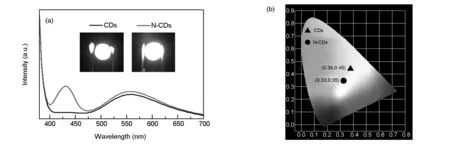
Fig. 17 (a) Emission spectra of CD/starch composite and N-CD phosphors-based WLED. Inset: The photography of the corresponding WLED operated at 2.9 V. (b) The CIE chromaticity coordinates for the illustrating WLED of (a).
4 Conclusions
A facile synthesis of the CDs was achieved with the use of renewable and natural potato starch as the carbon source by the microwave-assisted hydrothermal method. The reaction parameters including reaction time, reaction temperature and concentration of starch solution were investigated and optimized as 30 min, 220 ℃ and 1 mg/mL, respectively. As-prepared CDs exhibit blue emission at the excitation wavelength of 360 nm with aQYof 2.46%. To improve theQY, N-CDs were prepared with the addition of nitrogen dopant ethylenediamine under the above optimal conditions. The doping of N atom was confirmed and theQYof the N-CDs doubled that of CDs. Besides, the CDs and N-CDs have excitation wavelength-dependent luminescence and excellent water solubility. Together with good thermal ability, WLEDs based on CD/starch composite and N-CD phosphor are achieved for the first time, with CIE coordinates of (0.38, 0.45) and (0.33, 0.35), respectively. This study demonstrates that the starch-based CDs have promising potential for serving as candidate phosphors for applications in optoelectronic devices.
[1] Sun Y P, Zhou B, Lin Y, et al. Quantum-sized carbon dots for bright and colorful photoluminescence[J]. Journal of the American Chemical Society, 2006, 128(24): 7756-7757.
[2] Canevari T C, Nakamura M, Cincotto F H, et al. High performance electrochemical sensors for dopamine and epinephrine using nanocrystalline carbon quantum dots obtained under controlled chronoamperometric conditions[J]. Electrochimica Acta, 2016, 209: 464-470.
[3] Li H, Guo S, Li C, et al. Tuning laccase catalytic activity with phosphate functionalized carbon dots by visible light[J]. ACS Applied Materials & Interfaces, 2015, 7(18): 10004-10012.
[4] Saud P S, Pant B, Alam A M, et al. Carbon quantum dots anchored TiO2nanofibers: Effective photocatalyst for waste water treatment[J]. Ceramics International, 2015, 41(9): 11953-11959.
[5] Ding H, Yu S B, Wei J S, et al. Full-color light-emitting carbon dots with a surface-state-controlled luminescence mechanism[J]. ACS Nano, 2016, 10(1): 484-491.
[6] Chang M M F, Ginjom I R, Ngu-Schwemlein M, et al. Synthesis of yellow fluorescent carbon dots and their application to the determination of chromium(III) with selectivity improved by pH tuning[J]. Microchimica Acta, 2016, 183(6): 1899-1907.
[7] Zhang Y, Cui P, Zhang F, et al. Fluorescent probes for “off-on” highly sensitive detection of Hg(2+) and L-cysteine based on nitrogen-doped carbon dots[J]. Talanta, 2016, 152: 288-300.
[8] Zheng J, Wang Y, Zhang F, et al. Microwave-assisted hydrothermal synthesis of solid-state carbon dots with intensive emission for white light-emitting devices[J]. Journal of Materials Chemistry C, 2017, 5: 8105-8111.
[9] Zhang F, Feng X, Zhang Y, et al. Photoluminescent carbon quantum dots as a directly film-forming phosphor towards white LEDs[J]. Nanoscale, 2016, 8(16): 8618-8632.
[10] Wang Y, Zhao Y, Zhang Y, et al. Single-phase heteroatom doped carbon dots phosphor toward white light-emitting diodes[J]. RSC Advances, 2016, 6(45): 38761-38768.
[11] Bottini M, Balasubramanian C, Dawson M I, et al. Isolation and characterization of fluorescent nanoparticles from pristine and oxidized electric arc-produced single-walled carbon nanotubes[J]. Journal of Physical Chemistry B, 2006, 110(2): 831-836.
[12] Hu S, Liu J, Yang J, et al. Laser synthesis and size tailor of carbon quantum dots[J]. Journal of Nanoparticle Research, 2011, 13(12): 7247-7252.
[13] Zuo P, Xiao D, Gao M, et al. Single-step preparation of fluorescent carbon nanoparticles, and their application as a fluorometric probe for quercetin[J]. Microchimica Acta, 2014, 181(11-12): 1309-1316.
[14] Fang Y, Guo S, Li D, et al. Easy synthesis and imaging applications of cross-linked green fluorescent hollow carbon nanoparticles[J]. ACS Nano, 2012, 6(1): 400-409.
[15] Yao S, Hu Y, Li G. A one-step sonoelectrochemical preparation method of pure blue fluorescent carbon nanoparticles under a high intensity electric field[J]. Carbon, 2014, 66(66): 77-83.
[16] Zhang F, Wang Y, Miao Y, et al. Optimal nitrogen and phosphorus codoping carbon dots towards white light-emitting device[J]. Applied Physics Letters, 2016, 109(8): 083103.
[17] Luo Z, Qi G, Chen K, et al. Microwave-assisted preparation of white fluorescent graphene quantum dots as a novel phosphor for enhanced white-light-emitting diodes[J]. Advanced Functional Materials, 2016, 26(16): 2739-2744.
[18] Zhu H, Wang X, Li Y, et al. Microwave synthesis of fluorescent carbon nanoparticles with electrochemiluminescence properties[J]. Chemical Communications, 2009, (34): 5118-5120.
[19] Tang L, Ji R, Cao X, et al. Deep ultraviolet photoluminescence of water-soluble self-passivated graphene quantum dots[J]. ACS Nano, 2012, 6(6): 5102-5110.
[20] Wang J, Cheng C, Huang Y, et al. A facile large-scale microwave synthesis of highly fluorescent carbon dots from benzenediol isomers[J]. Journal of Materials Chemistry C, 2014, 2(25): 5028-5035.
[21] Wang W, Li Y, Cheng L, et al. Water-soluble and phosphorus-containing carbon dots with strong green fluorescence for cell labeling[J]. Journal of Materials Chemistry B, 2014, 2(1): 46-48.
[22] Strek W, Tomala R, Lukaszewicz M, et al. Laser induced white lighting of graphene foam[J]. Scientific Reports, 2017, 7, 41281.
[23] Zhou J, Booker C, Li R, et al. An electrochemical avenue to blue luminescent nanocrystals from multiwalled carbon nanotubes (MWCNTs)[J]. Journal of the American Chemical Society, 2007, 129(4): 744-745.
[24] Zu Y, Bi J, Yan H, et al. Nanostructures derived from starch and chitosan for fluorescence bio-imaging[J]. Nanomaterials (Basel), 2016, 6(7): 130.
[25] Zhu L, Yin Y, Wang C F, et al. Plant leaf-derived fluorescent carbon dots for sensing, patterning and coding[J]. Journal of Materials Chemistry C, 2013, 1(32): 4925.
[26] Wang N, Wang Y, Guo T, et al. Green preparation of carbon dots with papaya as carbon source for effective fluorescent sensing of Iron (III) and Escherichia coli[J]. Biosensors and Bioelectronics, 2016, 85: 68-75.
[27] Wang D, Zhu L, McCleese C, et al. Fluorescent carbon dots from milk by microwave cooking[J]. RSC Advances, 2016, 6(47): 41516-41521.
[28] Xu H, Yang X, Li G, et al. Green synthesis of fluorescent carbon dots for selective detection of tartrazine in food samples[J]. Journal of Agricultural and Food Chemistry, 2015, 63(30): 6707-6714.
[29] Ngu P Z Z, Chia S P P, Fong J F Y, et al. Synthesis of carbon nanoparticles from waste rice husk used for the optical sensing of metal ions[J]. New Carbon Materials, 2016, 31(2): 135-143.
[30] Liu M, Zhang X, Yang B, et al. Fluorescent nanoparticles from starch: facile preparation, tunable luminescence and bioimaging[J]. Carbohydrate Polymers, 2015, 121: 49-55.
[31] Basu A, Suryawanshi A, Kumawat B, et al. Starch (Tapioca) to carbon dots: an efficient green approach to an on-off-on photoluminescence probe for fluoride ion sensing[J]. Analyst, 2015, 140(6): 1837-1841.
[32] Li H, Guo X, Liu J, et al. A synthesis of fluorescent starch based on carbon nanoparticles for fingerprints detection[J]. Optical Materials, 2016, 60: 404-410.
[33] Sun M, Qu S, Hao Z, et al. Towards efficient solid-state photoluminescence based on carbon-nanodots and starch composites[J]. Nanoscale, 2014, 6(21): 13076-13081.
[34] Chen Y, Zheng M, Xiao Y, et al. A self-quenching-resistant carbon-dot powder with tunable solid-state fluorescence and construction of dual-fluorescence morphologies for white light-emission[J]. Advanced Materials, 2016, 28(2): 312-318.
[35] Fletcher A N. Quinine sulfate as a fluorescence quantum yield standard[J]. Photochemistry & Photobiology, 1969, 9(5): 439-444.
[36] Meiling T T, Cywinski P J, Bald I. White carbon: Fluorescent carbon nanoparticles with tunable quantum yield in a reproducible green synthesis[J]. Scientific Reports, 2016, 6: 28557.
[37] Song Y, Zhu S, Zhang S, et al. Investigation from chemical structure to photoluminescent mechanism: a type of carbon dots from the pyrolysis of citric acid and an amine[J]. Journal of Materials Chemistry C, 2015, 3(23): 5976-5984.
[38] Yang Z, Xu M, Liu Y, et al. Nitrogen-doped, carbon-rich, highly photoluminescent carbon dots from ammonium citrate[J]. Nanoscale, 2014, 6(3): 1890-1895.
[39] Song Z, Quan F, Xu Y, et al. Multifunctional N,S co-doped carbon quantum dots with pH- and thermo-dependent switchable fluorescent properties and highly selective detection of glutathione[J]. Carbon, 2016, 104: 169-178.
[40] Qu D, Zheng M, Zhang L, et al. Formation mechanism and optimization of highly luminescent N-doped graphene quantum dots[J]. Scientific Reports, 2014, 4: 5294.
[41] Dong Y, Pang H, Yang H B, et al. Carbon-based dots co-doped with nitrogen and sulfur for high quantum yield and excitation-independent emission[J]. Angewandte Chemie-International Edition, 2013, 52(30): 7800-7804.
[42] Li X, Zhang S, Kulinich S A, et al. Engineering surface states of carbon dots to achieve controllable luminescence for solid-luminescent composites and sensitive Be2+detection[J]. Scientific Reports, 2014, 4(1).
[43] Zheng H, Wang Q, Long Y, et al. Enhancing the luminescence of carbon dots with a reduction pathway[J]. Chemical Communications, 2011, 47(38): 10650-10652.
[44] Niu Q, Gao K, Lin Z, et al. Amine-capped carbon dots as a nanosensor for sensitive and selective detection of picric acid in aqueous solution via electrostatic interaction[J]. Analytical Methods, 2013, 5(21): 6228-6233.
[45] Kellner R, Mermet J M, Otto M, et al. Analytical chemistry: a modern approach to analytical science[Z]. Germany: Wiley-VCH; ISBN 3-527-30590-4; 2004.
[46] Zhu S, Meng Q, Wang L, et al. Highly photoluminescent carbon dots for multicolor patterning, sensors, and bioimaging[J]. Angewandte Chemie, 2013, 52(14): 3953.
[47] Li H, Kang Z, Liu Y, et al. Carbon nanodots: synthesis, properties and applications[J]. Journal of Materials Chemistry, 2012, 22(46): 24230.
[48] Krysmann M J, Kelarakis A, Dallas P, et al. Formation mechanism of carbogenic nanoparticles with dual photoluminescence emission[J]. Journal of the American Chemical Society, 2011, 134(2): 747-750.
[49] Mao L H, Tang W Q, Deng Z Y, et al. Facile access to white fluorescent carbon dots toward light-emitting devices[J]. Industrial & Engineering Chemistry Research, 2014, 53(15): 6417-6425.
[50] Wen X, Yu P, Toh Y R, et al. Near-infrared enhanced carbon nanodots by thermally assisted growth[J]. Applied Physics Letters, 2012, 101(16): 7756-7757.
[51] Zhang P, Li W, Zhai X, et al. A facile and versatile approach to biocompatible “fluorescent polymers” from polymerizable carbon nanodots[J]. Chemical Communications, 2012, 48(84): 10431-10433.
猜你喜欢
中国机械工程(2022年18期)2022-10-08
内蒙古统计(2021年4期)2021-12-06
潍坊学院学报(2021年2期)2021-07-22
中国机械工程(2019年19期)2019-10-28
中国卫生统计(2019年3期)2019-07-10
中国机械工程(2019年11期)2019-06-13
中国机械工程(2019年4期)2019-03-06
分析化学(2017年12期)2017-12-25
分析化学(2017年12期)2017-12-25
中国光学(2015年1期)2015-06-06