
大麦TILLING群体的构建及EDR1基因突变的检测
2018-07-19 07:51吕瑞华冯飞雪陈耀锋
西北植物学报 2018年6期
吕瑞华,冯 昭,冯飞雪,陈耀锋
(1 陕西中医药大学 医学技术学院,陕西咸阳 712046;2 陕西中医药大学 附属医院 检验科,陕西咸阳 712000;3 西北农林科技大学 农学院,陕西杨陵 712100)
The barley genusHordeumbelongs to the grass family Poaceae[1]. Cultivated barleyHordeumvulgareL. is the economically important crop and ranks the forth in world cereal production after wheat, maize and rice[2]. Barley is mostly used as a food and in malting. In 2010, barley production was 123.7 Mt worldwide, with most of this production from Europe, Australia, USA and China[3]. The barley genome (n= 7) comprises more than 5 000 Mb, equivalent to approximately 12 times the size of the rice genome, and consists of about 80% repetitive DNA[4]. Due to its importance as a staple crop and as a model for other Triticeae genomes, comprehensive genetic and genomic resources have been established for barley over the past decades, including a large number of well-characterized genetic stocks and mutant collections (http://www.untamo.net/cgi-bin/ace/searches/basic)[5-6]. The first induced mutagenesis of barley was reported in 1928[7], only a year after Muller reported that ionizing irradiation could increase the mutation frequency inDrosophila[8]. This finding promoted barley as a model plant and one of the first crops in which mutations were induced for applied purposes[9-10].
EDR1 (Enhanced Disease Resistance 1) was reported as a key negative regulator of plant-powdery mildew interaction. TheEDR1 mutant generates powdery mildew-induced cell death and increases resistance to powdery mildew infection. In addition,EDR1 results in increased leaf senescence when treated with ethylene.EDR1 encodes a protein kinase, which has a conserved C-terminal kinase domain and an N-terminal regulatory domain. TheEDR1 inArabidopsis, wheat and rice have been fully studied and cloned[11-14].
EDR1 may function as a negative regulator at the top of a MAPK cascade in wild-type plants[15]. The increased resistance conferred by theEDR1 mutation may provide a novel means of conferring resistance to powdery mildew. It has been suggested that theEDR1 pathway is conserved in crop species[16]. Putative orthologs ofEDR1 are present in monocots such asOryzasativaL. andHordeumvulgareL., indicating thatEDR1 may regulate defense responses in a wide range of crop species[16].
Usually, radiation or chemical mutagens such as EMS (ethyl methanesulfonate) were used to increase mutations in plant breeding. EMS is the most widely used mutagen due to its high mutation frequency, and most mutants are recessive[17]. The mutation process consists of two steps: 1) the O-6 location of guanine first becomes a quaternary ammonium group with positive charge by alkylation, then 2) the group base pairs thymine instead of cytosine in the subsequent DNA-replication step, which leads to base substitution (G-C→A-T)[18]. Mutations in coding regions can be silent, missense or nonsense, and mutations outside coding regions, such as promoter mutations, result in up-or down-regulation of transcription, aberrant splicing of mRNA, altered mRNA stability or changes in protein translation.
TILLING was first demonstrated inArabidopsisthaliana[19]andDrosophilamelanogaster[20], and has later been successfully applied to a number of plant systems includingArabidopsis[21], barley[6, 22],Lotusjaponicus[23-24], wheat[25], maize[26], rice[26-28], pea[29], soybean[30]and naked oats[31]. Two large-scale EMS mutant populations from barley have been developed by Caldwell[6].16-32 alleles and 10 induced mutations in the coding sequences of two target genes were obtained. Gottwald[32]developed a barley TILLING population of 10 279 M2plants. The screening of six target genes demonstrated a moderate mutation frequency of approximately one mutation per 0.5 Mb. A detailed TILLING analysis was performed for the geneHvHox1, which is the major factor controlling the row-type morphology of the barley spike, multiple alleles causing phenotypic changes were obtained.Therefore, developing TILLING-populations in diploid barley with a reasonable mutation frequency could be productive in barley breeding.
In the present study, a TILLING population in a six-rowed barley cultivar ‘Xiyin2’, consisting of 2012 different mutagenized seed lines, was developed and the mutation frequency was determined. To screen the genetic mutation ofEDR1 gene in TILLING population, methods of optimized CELⅠ screening system and RAPD-PCR were adapted to identify the different mutations on barley lociEDR1 (AF305912) for demonstrating the potential of the barley TILLING population. The study would be of great interest to barley breeders for increasing the resistance to powdery mildew.
1 Materials and Methods
1.1 Plant material
Cultivar ‘Xiyin2’ was a six-rowed barley (HordeumvulgareL.) variety with the characteristics of mid-early maturity, high yield, and weak winter habit. This cultivar, introduced from Japan into China in 1980s by former Northwest Agriculture University, was mainly suitable cultivated in the Huanghuai areas of China. It was deposited in the College of Food Science and Engineering, Northwest A&F University at Shaanxi Province, China.
1.2 Methods
1.2.1EMSmutagenesisFor the screening of EMS (ethyl methanesulfonate) concentration stage, six groups of 600 barley seeds were treated at different EMS (Alfa Aesar Co.) concentrations (CK, 0.2%, 0.3%, 0.4%, 0.5%, 0.6%). All seeds were put into a 1 000 mL beaker pre-soaked in ddH2O for 4 h at room temperature (25 ℃). Then each of 100 seeds were transferred to a 50 mL falcon tube with 20 mL EMS solutions followed by 15 h shaking at room temperature (150 r/min). Subsequently, seeds were washed 2 times in tap water by 1 h of vigorous shaking, then washed again with ddH2O two times. Next, seeds were gently wiped with filter paper and transferred to the fume hood where they were dried for use.
1.2.2PopulationcultivationAfter treating seeds with mutagen, 600 barley seeds were immediately planted in a green house with a 17.5 h photo-period (19:30 pm-8:00 am) at aconstant temperature of 18 ℃. Germination data were collected 10 days after sowing. M1and M2populations were grown in experimental plots of the College of Plant Protection, Northwest A&F University. Genome DNA was collected.
1.2.3GenomicDNAisolationGenomic DNA was extracted from young leaves at the three-leaf stage which is about 45 d after sowing using the standard CTAB protocol[33-34]. DNA samples were quantified withOD260/280test and adjusted to a final concentration of 20 ng/μL for RAPD PCR.
1.2.4RAPDanalysisFive primers which formed polymorphic bands were selected from the ten random 10-mer primers (Sangon Biotech Co., Ltd, Shanghai). The specific sequences as follows: S5(TGCGCCCTTC),S31(CAATCGCCGT),S86(GTGCCTAACC),S284(GGCTGCAATG) and S1429(AGAGCGTACC).
The genome DNA from a non-mutagenised sample was defined as CK (control sample). The 25 μL reaction volume of PCR amplification, including 2.0 μL 20 ng genome DNA, 1.5 μL 2.0 mmol/L MgCl2, 2.0 μL 150 μmol/L dNTP, 1.0 μL 0.5 μmol/L primer, 0.25 μL 1.25 UTaqpolymerase. The amplication program consisted of initial denaturation (94 ℃ for 5 min) followed by 40 cycles at 94 ℃ for 30 s, annealing (37 ℃ for 1 min), extension (72 ℃ for 1 min), and a final extension (72 ℃ for 10 min). PCR products were analysed on 1.5% agarose gels (Amresco, USA) in Tris-borate buffer at 5 V/cm. The gel was then stained with ethidium bromide and visualized under UV light and photographed.
1.2.5CELⅠ-basedmutationscreeningCELⅠ extraction followed Till’s protocol[35]. TheEDR1 ofArabidopsisthaliana(GenBank: AF305913) conserved in barley genome (EDR1: AF305912), gene-specific primers, based on sequence information from NCBI, designed by Primer Premier 5.0 software (Premier Biosoft Interntional). The primer ofEDR1 (AF305912) is: F (5′GTGAACCTGGGACATTAG3′) and R (5′ATGGCTTTCTCAGTGTTG3′).
In all 2012 M2lines, every 4 line’s DNA was merged into one pool and 503 DNA pools were analyzed.
RAPD PCR amplification was carried out in a 25 μL volume containing 2.0 μL 20 ng of individual pooled DNA, 2.0 μL 0.2 mmol/L dNTPs, 1.0 μL 0.4 μmol/L primers (Invetrogen), and 0.2 μL 1.0 UTaqpolymerase (MBI). The PCR reactions were conducted using a thermal cycler (Applied Biosystems 9800 Fast Thermal Cycler, Foster City, USA) as follows: heat denaturation at 94 ℃ for 5 min was followed by 30 cycles at 94 ℃ for 30 s, 52 ℃ for 1 min, 72 ℃ for 1 min and extension at 72 ℃ for 1 to 1.30 min; and final extension at 72 ℃ for 8 min. The amplification step was followed by heteroduplex formation: inactivation and denaturation at 99 ℃ for 10 min; and a re-annealing process of 70 cycles for 20 s at 72 ℃ to 51 ℃, decreasing 0.3 ℃ per cycle.
CELⅠ extraction followed Till’s protocol[35]. CELⅠ was diluted to 1/10, and using a 2 μL CELⅠ dilution mixed with 2 μL buffer (20 mmol/L HEPES pH 7.5, 10 mmol/L KCl, 3 mmol/L MgCl2) and 14 μL PCR products digested at 45 ℃ for 30 minu, then adding 5 μL EDTA (75 mmol/L) to end the reaction.
2 Results and Analysis
2.1 Optimal EMS mutagen concentration in the development of a barley TILLING-population
Based on previous study[6, 32], for choosing the optimal EMS treatment concentration, an EMS treatment curve for germination rates and full-sterile rates of barley seeds was established (Fig.1). In total 5 different EMS concentrations, from 0.2% to 0.6% with the interval of 0.1%, were used and 100 seeds were treated at each concentration. According to Fig.1, 0.4% should be the optimal EMS mutagen concentration for treatment, but in consideration of the balance of the maximum mutation density with an acceptable seed survival rate, a concentration of 0.3% was finally chosen for constructing the TILLING population. A total of 5 000 seeds were treated resulting in a 3 750 M1population (survival rate of 75.0%). Of these, only 2 534 fertile plants set seeds to produce M2lines. The rest died, didn’t flower or produced empty seeds. M2seeds were harvested from each of the M1lines. We then planted every 4 seeds for 1 line and got 2012 M2lines, only keeping 1 strong plant after germination). An overview of the TILLING population procedure is given in Fig.2.
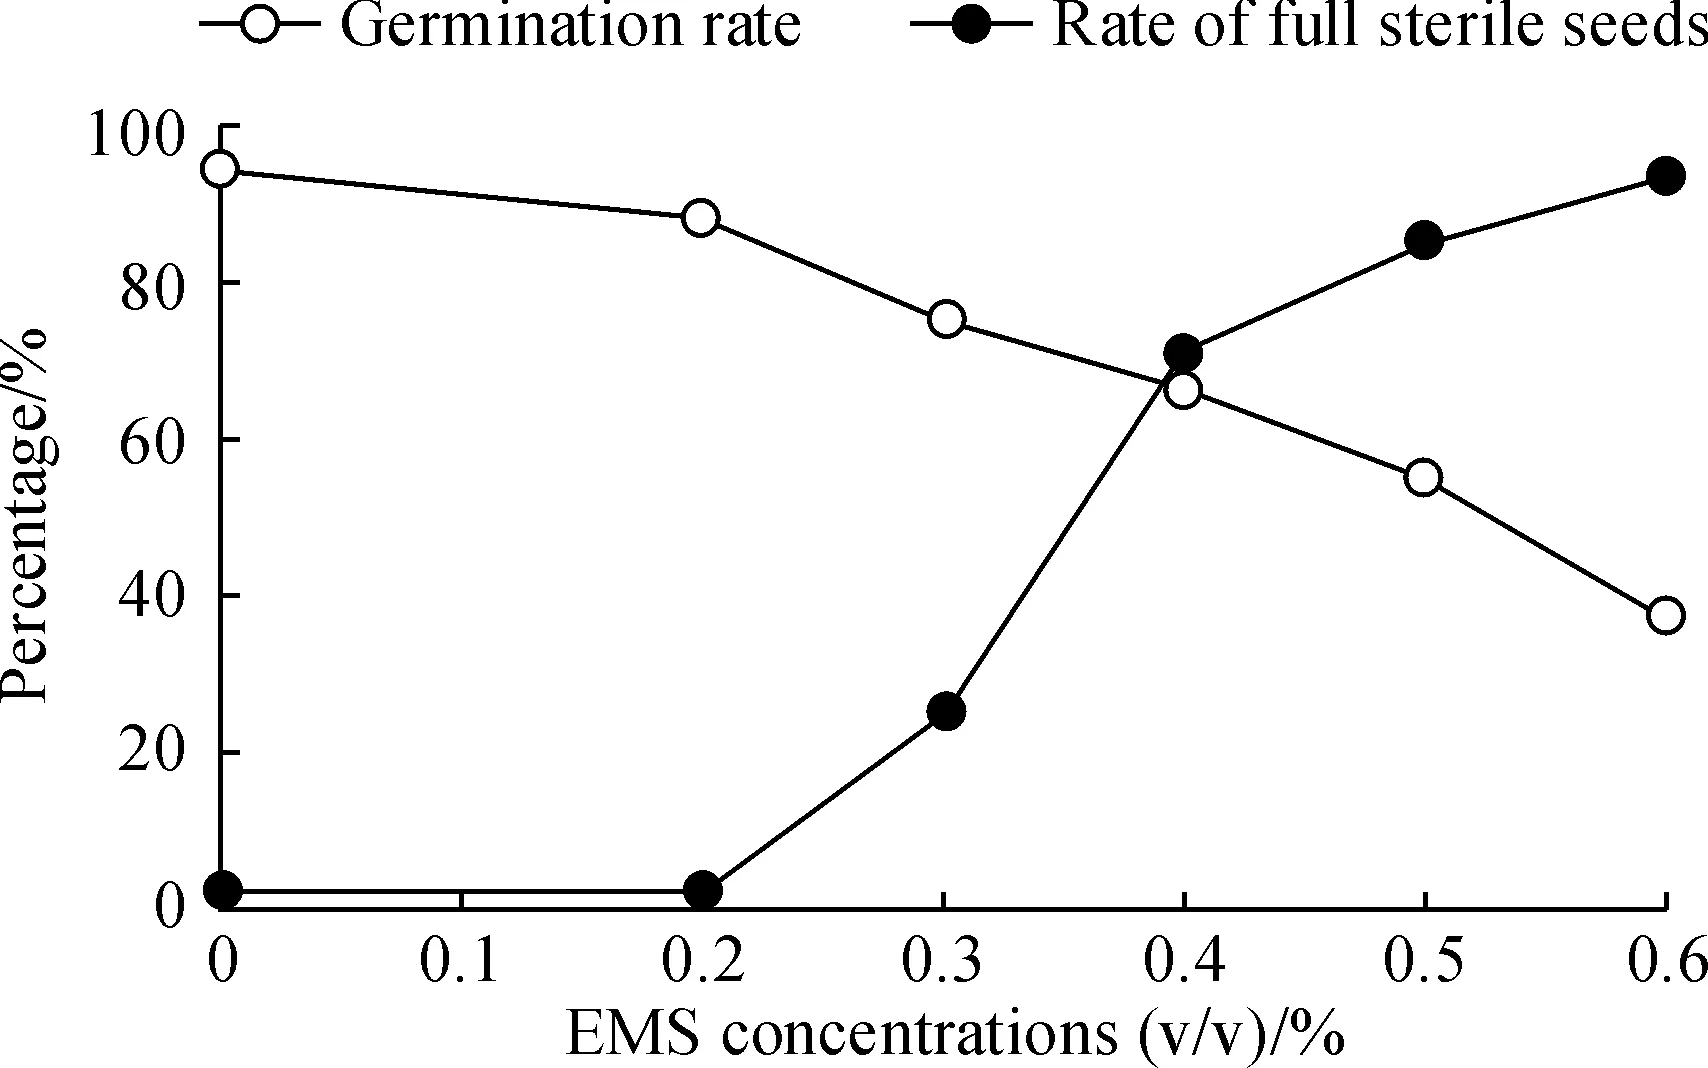
Fig.1 Average germination rates by different EMS concentration
2.2 Phenotype evidence for occurrence of mutation in TILLING-population
The phenotype variations of the M2population were recorded in detail, in which 115 lines showed chlorosis(Fig.3), 98 lines showed dwarfing, 101 lines showed very early/late flowering, and others 35 lines showed less tilling, small leaves, or produced no seeds. Totally phenotypic variations in 17.35% of the M2population were observed (Table 1).
2.3 Molecular level evidence for occurrence of mutation in TILLING-population achieved using RAPD
From the phenotypes of M2, we observed apparent mutations in the population, and then used the effective and inexpensive system RAPD (Random Amplification of Polymorphic DNA) to seek molecular level evidence. Based on previous studies[36-37], we chose ten random primers using nonmutated ‘Xiyin2’ DNA as a control template, and found five of them showed stable fragments. We then used these five random primers amplified 256 samples of the M2lines, and detected the polymorphism. The results show the mutations in the M2lines that occurred (Fig.4).
2.4 Estimation of the mutation frequency by CELⅠ-based mutation screening
We developed a CELⅠ (celery juice extract)-based screening system to explore the 2012 plants of M2. A plasmid pDRIVER (single-base variant) was used to optimize the temperature and digestion time of CELⅠ activity, and 40 ℃, 30 min was chosen for the CELⅠ-based screening system. In all 2012 plants of the M2population, each of the four lines was merged into one DNA pool, producing 503 DNA pools. Finally, three mutants were obtained after the M2lines ofEDR1 gene were screened using the optimized CELⅠ enzyme system (Table 2), among which the Pro to Ser transition happened in extron. By the 1 485 bp of theEDR1 fragment length and 3 mutations we detected, according to the previous studies[35, 38], we obtain an average mutation frequency of 1 per 661 kb.

Fig.3 Etiolated plants compared with normal plants

Table 1 The phenotype variations of M2
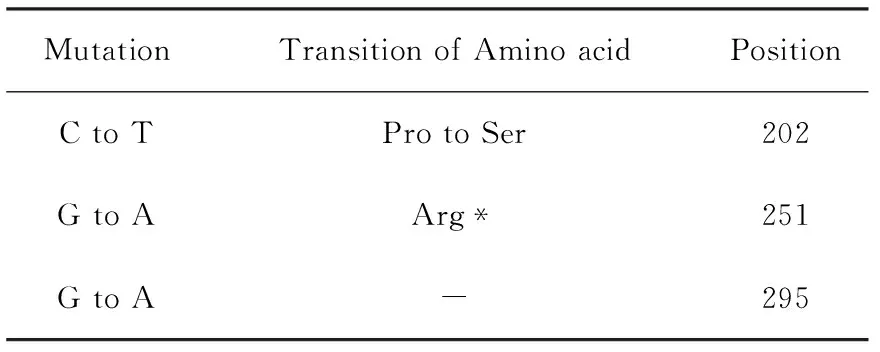
Table 2 Identified mutations in the EDR1 of M2
Note: * This mutant didn’t change the encoding of the Arg

Fig.2 Steps in the TILLING population procedure

A. S5;B.S31;C. S86;D.S284;E. S1429;1, 3, 5, 7, 9. Wild type; 2, 4, 6, 8, 10. M2 individuals. The arrows indicated variationsFig.4 RAPD profile produced in M2 lines by the primers
3 Discussion
Triticeae crops are the most important human food resources in the world. However, the recalcitration of genetic transformation limits the development of relative functional genomics research. TILLING (Targeting induced local lesions in genomes) is a reverse-genetics method for performing functional genomics research and can be applied to both plants and animals[33]. EMS-induced genetic mutation is a powerful tool to generate and study mutants which have interesting characters or functions. The EMS-induced TILLING population is easy to maintain, and the mutagenesis is easy to identify. The TILLING technology induces diverse allelic variation, including missense mutations that can lead to altered protein function, as well as premature stop codons and splice site changes that can result in knockout or knockdown of a gene[39]. Our aim was to produce a population with relatively high mutation frequency and moderate size to avoid labor intensive costs. Therefore, we first investigated the optimal balance between mutation frequency and lethality in the development of a TILLING-population of barley. 0.3% was settled on after testing a series of different EMS concentrations; this gave a germination rate of 75.0% and a full sterile rate of 25.0%. In other related studies, the EMS concentrations used for wheat were (0.75%, 1.0% or 1.2%)[25], oats (0.9%)[40], maize (1.0%) and barley (0.25%-0.4%)[18, 28], while the EMS concentration used for rice was much higher (1.5%)[28].The six-rowed Barley ‘Xiyin2’ is a mid-early maturity, high yield, weak winter barley variety, originally from Japan and introduced into China in 1980s by Northwest A&F University. It is mainly suitable for cultivation in the Huanghuai areas of China. By recording the phenotypes of the M2‘Xiyin2’ TILLING population, about 17.35% phenotypic variation was observed, which is close to Sven Gottwald’s “Barke” barley TILLING population (20%)[32]. According to other related studies on Triticeae crops, oat’s visible phenotype variation is about 5%[40]while wheat’s is only 0.5%[25]. Regarding the significant difference of the phenotype variation between barley, oat, and wheat, we presume that is because barley is a diploid plant in comparison to wheat and oats, which have relatively simple genomes. In wheat and oats, when one allele is mutated, other alleles in the genomes could compensate for the lost function[41].
In the present paper, two different approaches, RAPD and CELⅠ-based screening, were used to detect the mutagenesis that occurred in the ‘Xiyin2’, and to estimate the mutation frequency at the DNA level, respectively. We detected stable polymorphism using five random primers. The specific genes ofEDR1 were chosen as a model to estimate the mutation frequency of M2, insofar asEDR1 mutation ofA.thalianaresults in resistance to powdery mildew caused by the fungusErysiphecichoracearum[42], and theEDR1 pathway is conserved in crop species[11]such as rice and barley. Subsequently, theEDR1 gene was isolated by positional cloning and was found to encode a putative MAP kinase kinase kinase (MAPKKK) which is similar toCTR1 (constitutive triple response), a negative regulator of ethylene responses inA.thaliana[11]. By adapting a CELⅠ-based screening method to a barley TILLING population, mutations for theEDR1 target genes were identified. In total 1.485 kb were covered and 3 mutations were detected (Table 1) in 2 012 M2lines, by using 6% SDS-PAGE isolated digested products giving an average mutation frequency of 1 per 661 kb (with about a 0.25 kb mismatch happening at both ends). This is the same range as Gottwald and Hu’s (1 mutation/500-862 kb)[32, 38].
Compared to other related studies, the mutation frequency of barley appears to be at about the same level as rice (1 mutation/530 kb)[28]and maize (1 mutation/500 kb)[26], but is much lower than that of wheat (1 mutation/24 kb)[25]and oats (1 mutation/33.3 kb)[40]. The reason for such differences remain unproven, but most likely, as earlier described, is because barley, rice and maize have fewer chromosomes and could tolerate less mutagenesis before lethality occurs when a chemical mutation happens. In addition, the mutants in this study showed etiolation and senesce early after three-leave stage due to lacking of chloroplastids, however, if it is related to powdery mildew needs to be investigated further.
We choose the 0.3% EMS concentration to develop a TILLING population of the barley variety ‘Xiyin2’. Among 2012 M2lines, we used two efficient methods to make sure mutations happened at the DNA level and estimated the mutant frequency is about 1 per 661 kb ofEDR1 gene which is a key negative regulator of plant-powdery mildew interaction. By recording the phenotype variation of M2, the mutations or genes of interest can be used in future forward or reverse genetics research.
Acknowledgments: The authors thank Dr. John Richard Schrock (Emporia State University, Emporia, KS, USA) for language correction of the draft. We are thanks to Ms. Guorong Wei (Northwest A&F University, Yangling, China) for the plant care and to Zhengmao Zhang (Northwest A&F University, Yangling, China) for providing stocks of ‘Xiyin2’ seeds.
猜你喜欢
西北农林科技大学学报(自然科学版)(2021年12期)2021-12-17
西北农林科技大学学报(自然科学版)(2021年5期)2021-06-01
东坡赤壁诗词(2021年2期)2021-06-01
西北农林科技大学学报(自然科学版)(2021年4期)2021-05-06
西北农林科技大学学报(自然科学版)(2021年2期)2021-03-09
音乐天地(音乐创作版)(2020年3期)2020-06-09
中国卫生质量管理(2019年5期)2019-10-24
中学生天地(A版)(2019年3期)2019-04-19
作文世界(小学版)(2017年11期)2018-03-07
小小说月刊(2013年4期)2013-05-14
