Empirical Analysis of Compact Energy targets in four States of the United States
2018-08-24 22:24JINGWUTINGMEILUWENSUWEICHENMENGLINGWU
科学与财富 2018年24期
JING WU TINGMEI LU WEN SU WEI CHEN MENGLING WU

摘 要:The selection is based on the background of the four states, in order to learn to achieve the objectives of the four states on its compact energy. First of all, this paper analyzes and processes the original data to be informed of the energy structure proportion, total energy consumption and energy security of the states. For each of the four states, in 1960-2009 of the energy situation, using two types of energy consumption and population factors regression analysis model is established. Then, for the four states to use clean renewable energy, we adopt the analytic hierarchy process to construct the clean renewable energy judgment matrix of the plan layer and obtain the "best" use situation .
關键词:energy consumption, regression analysis, analytic hierarchy
1 an energy profile for each of the four states
Energy is the lifeblood of the national economy, which is closely related to the people's life and the living environment of human beings, and plays a major role in the sustainable development of society. With the rapid development of economy and the continuous improvement of people's living standard, the demand for energy also rapidly increases the energy constraint contradiction. However, the current problems such as low energy utilization efficiency, unreasonable energy consumption structure and environmental pollution caused by energy use severely limit the country's path to sustainable development. In order to solve the problems of energy utilization, realize the sustainable development of energy and the environment, in energy situation assessment is particularly weighty, energy situation, this paper study on the preliminary evaluation index system.
2 assessment indicators of energy utilization
According to the above principles and to provide data, California (CA), Arizona (AZ), New Mexico (NM) and the general situation of the energy (Texas), Texas should contain the following when evaluating indicators.
According to the definition of renewable energy, renewable energy resources can be divided into fuel ethanol minus the denaturant (EM), direct use of geothermal energy and geothermal heat pump (GE), the traditional hydropower (HY), the sun's heat directly to use energy and photovoltaic (pvc) grid generation (SO), wind power (WY), wood and wood burning (WD), biomass waste (WS). And the non-renewable energy resources can be divided into fossil fuel coal (CL), excluding supplementary gas fuel gas (NN), excluding fuel ethanol gasoline (PM) and nuclear power (NU). The energy consumption level and its structural characteristics of a region are another important indicator to measure the level of economic and social development.
Total energy consumption is the total amount of energy consumed by a region for production and living in a specified period. This reflects the absolute energy consumption level, composition and growth rate of the total area.
3 energy security
National energy security: I = energy supply/energy demand. If I am greater than or equal to 1, the energy supply is safe, I <1, indicating that the energy supply is not safe, and corresponding countermeasures should be taken, such as increased investment.
Arg, ethanol, o denaturant, total consumption is renewable energy, raw material can be used as a new Fuel alternative to gasoline additives, reduce the oil consumption, can be directly used as liquid Fuel or blended with gasoline, can reduce the dependence on non-renewable energy - oil, the region's energy security.
Regression analysis was used to develop a regression model.Using the regress command and the least square method in Matlab, the multivariate linear regression was realized by using the data and energy consumption data from four states. From the above, energy consumption can be found to be positively correlated with population.
At the same time, we recommend that clean renewable energy use less states, and can use more states to learn relevant technologies for clean renewable energy. States with more energy use may have a trading relationship with energy-using smaller states.
4 the ‘best profile for use of cleaner
Analytic hierarchy process is that people in the social, economic, and scientific management problem in the field of system analysis, the face is often a connected to each other, and mutual restriction of many factors that constitute the complex and often lack of quantitative data of the system. Analytic hierarchy process provides a new, concise and practical modeling method for the decision-making and ordering of such problems.
We have established a model, which is separated into three layers, from top to bottom: target layer, criterion layer and measure layer.
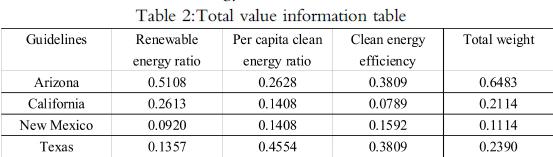
We define clean renewable energy ratio as B1, per capita clean energy ratio B2, and clean energy efficiency B3.Arizona is C1, California is C2, New Mexico is C3, Texas is C4.
Then, according to the ratio of clean energy and diverse values in each state in 2009, the judgment matrix of the scheme layer was constructed.Clean renewable energy ratio, per capita clean energy ratio and clean energy efficiency matrix.
According to the total weight information in the table above the size of the total weight, Arizona has the power value of 0.6483, so we can conclude that the 2009 Arizona looks in four states have the "best" an overview of the use of clean and renewable energy.
References
[1] Jinming Su, Shenyong Ruan . MATLAB practical course. Beijing:Electronic industry press, 2008.
[2] Yue Ma, Zhou Dong. Research and configuration scheme analysis of distributed energy system,Hebei electric power research and design institute, 2011.
[3] Maishen Xu, Xinsheng Zhang. The current situation and optimization of energy consumption structure in China, Henan science, 2012.
作者簡介:
吴菁,1997.5- ,女,丽水学院,本科,金融数学
陆婷妹,1996.10- ,女,丽水学院,本科,农村区域发展
苏文,1998.2- ,男,丽水学院,本科,金融数学
陈伟,1996.12- ,男,丽水学院,本科,计算机
吴梦玲,1996.10- ,女,丽水学院,本科,财务管理