基于大数据分析工具的传感器数据分析方法研究
2019-02-14 06:27KiWooSungHongGiShim
汽车文摘 2019年2期
Ki Woo Sung*,Hong Gi Shim
(现代汽车集团研发中心,Gyeonggi-do,18280,Korea)
主题词:传感器数据 符号聚合近似(SAX) 动态时间规整(DTW) R&D
1 Introduction
Recently,there has been a growing interest in big data,which enables the fast and efficient analysis of a large volume of data in various areas.Big data is being used in many areas for a variety of purposes because of an unprecedented stride in Information Technology(IT)and a significant drop in system implementation costs.Such a trend is also notable in the manufacturing industry.Leading automakers apply the results of various big data analyses to the development of their cars;that is,automakers gear toward a trend in which they collect big data about customers,not only from their SNS websites but also their cars,and use such data for marketing and R&D.GM,for example,uses driving style and battery status data for the development of its electric vehicles,whereas Ford and Honda use such data for their research on the implementation of electric vehicle charging infrastructure.Additionally,Ford,in particular,applies the data to its microtargeting advertising campaigns.There is a growing need to gain new insights through such data analysis.Hyundai Motor Group is not an exception.Regarding Research and Development(R&D),there are increasing needs for the analysis of accumulated data in addition to sensor data;that is,the company’s research center is faced with the need to perform an effective analysis of the measurement data that derives from tests.Currently,the R&D center attempts to store signal data and perform various analysis when it conducts tests on single components,the engine assembly and vehicles.However,it is really a challenging task regarding data saving,processing and analysis.
In this study,research is conducted with a focus on analysis,among the saving,processing and analysis issues.To date,using sensor data,some sampling-based analyses and damage-based signal data analyses have been conducted primarily.However,nowadays a new analysis paradigm is used through research on a variety of statistical analysis methods,machine learning methods and visualization techniques for big data analysis.Therefore,in this research,an analysis process is established ranging from the analysis of correlations of signal data to prediction and classification of models,and an analysis method is developed to optimize the signal.Additionally, an approach is devised to form abnormal signal data into patterns and detect a particular pattern.Furthermore,the feasibility and utility of such analysis methods are confirmed by applying the techniques to various types of big data held by each area of the R&D center,and a way forward for the big data analysis practice is proposed.
2 Big Data&Sensor Data Analysis Method
2.1 Definition of R&D Big Data
With the development of IT,enormous amounts of information and data are being produced in the big data environment,to such an extent that it is impossible to assess its sheer quantity.big data in daily lives are encountered,and the frequency of exposing to such big data is increasing.Big data are in general,defined as vast amounts of data created in a short cycle,including numerical data in addition to text and video data,in comparison to data created in the analog environment of the past.The features of big data are summarized into the 3Vs:Volume of data,Velocity of data creation,and Variety in data formats.Recently,value or complexity has sometimes been added to these features.
2.2 Features and Current Status of R&D Data
The features of data generated at the R&D center depend on a single attribute:Variety.The types of data created in the process from test to design are diverse.If data are viewed only regarding data types,then there are sensor data,which is semi-structured;text data,which is unstructured;and database data,which is structured.Among these,sensor data constitute a large category of data in R&D.To date,it has been common practice that data are analyzed according to the specific purpose of each business.However,it becomes increasingly necessary to consider the overall data comprehensively.The department in charge of durability has analyzed data,concentrating mostly on load.However,it is important to study a variety of statistical analytics,machine learning methods and visualization methods of big data analytics,in addition to existing damage-based signal data analytics.Among them,it is more urgent to conduct research on methods to predict and analyze sensor data that are created and saved most in R&D in an optimized manner and use methods to determine acertain pattern in sensor datasignals.
2.3 Big Data Analysis Process
Big data is analyzed using the following process(Figure 1).First is the data collecting phase.It is the most critical stage that is aimed at obtaining valid results and constitutes more than 70%of the analysis.Second is the data pre-processing phase,in which collected data are accumulated and pre-processed using the Hadoop system and Map Reduce.Third analysis is conducted by the type and purpose of data.Data can be analyzed using various methods according to their types and analysis purposes.Finally,the analysis result is used in many ways.Big data analysis is considered effective only when the analysis result provides actual help to R&D.Big data is used in the field of R&D for the prediction of phenomena and problems.Furthermore,it is possible to optimize data in a manner close to customer conditions by reflecting test conditions and design conditions when vehicles are developed.Moreover,this helps management to make datadriven decisions.

Figure1.Big data analysis process
Most big data analysis technologies and methods include data mining,machine learning,natural language processing and pattern recognition.These have been used in the fields of statistics and computer science.
Big data analytics has been consistently improved and made more sophisticated.According to the data types and technological development,it can be classified as shown in Figure 2.At present,the most vulnerable areas in R&D are prediction and classification analysis,and signal data pattern analysis for informal data.Therefore,in this paper,prediction/classification models are studied using machine learning algorithms and abnormal detection analytical modelsfor signal data.

Figure2.Big data analysis trend
2.4 Sensor Data Analysis Method
2.4.1 Development of a Sensor Data Prediction Method
In this paper,a prediction analysis method for the vehicle’s sensor data is presented as follows(Figure 3).Before analysis,data should be measured appropriately for the purpose of analysis,and at that time,variables(dependent variables)to be identified must be defined clearly so that an accurate analysis method can be selected.This can exert a significant influence on the analysis result.

Figure3.Sensor data analysis process
Firstly,major factors are selected by analyzing basic statistics and correlations.In the analysis of basic statistics,data errors and each variable’s features are identified using,for example,each variable’s average and distribution.Additionally,in the correlation analysis,visualization methods are used and significant factors are selected using statistical methods(tree model,principal component analysis and regression).The second process is the development of classification and prediction models.According to the specific purpose,models are categorized into prediction/classification models,and an analysis method is chosen according to data features and types.Clearly,it is recommended that various models are analyzed,and among them,a model with the best accuracy is selected.The last process is the verification of models’adequacy.Although there may be several approaches to verify such adequacy,for this research,70%of the total data are used for model development and the remaining 30% for the verification of models’adequacy,as is common practice,which is shown in Figure 4.Moreover,because accuracy may vary depending on how 70%of the data are extracted,the accuracy value is obtained using 10-fold cross-validation and repetitive measurements that are conducted more than 300 times[1].For this paper,Teradata’s Aster and open source R are used as programs for the analysis.

Figure4.Model verification method
2.4.2 Development of Methods for Sensor Data Patterningand Detection
Various methods for detecting sensor data have been introduced in research papers.At present,no detection approach methods have been applied to actual vehicle’s sensor data at Hyundai Motor Company,Korea.Two ideas for developing algorithms are presented for patterning and detecting sensor data using SAX,and a method to calculate the signal distance using DTW and determine a similar signal pattern.
SAX is a data conversion/access analysis method that uses the symbolic conversion of numerical values for the simple comparison and exploration of signal datasets[2][3].SAX is used to transform a sequence of rational numbers(i.e.,time series)into a sequence of letters(i.e.,string).SAX is one of the pre-processing algorithms particularly for time series sensor data that reduces the time dimension and value dimension.Advantages of SAX are that it reduces time and cost by reducing the measured signal size and transforming characters into patterns while maintaining accuracy[4].
DTW was first proposed in the 1970s to recognize a short pattern using a limited number of patterns in the voice recognition area.It is a method to acquire the optimal matching between two time series signal patterns,calculate the warping distance between the two datasets in the proper matching,and determine a signal of the same pattern by distorting the time distance between two sequential datasets[5][6].Although the time distances from comparing two signals are different,this method enables to calculate the distance in consideration of such a difference.Details of the two approaches above are explained as follows.
Firstly,DTW is a detection method in which the sensor data’s SAX conversion is proposed,that is,a method for reducing a signal size and forming characters into patterns.The analysis process is shown in Figure 5.
From the data converted from SAX patterns to character strings,a repetitive pattern can be detected using a motif.the sensor shape of patterns can be easily determined by applying the SAX method for sensor signals.A motif is a signal pattern search technique to locate a repeated pattern in signal data that is commonly used in genetic engineering.With a motif algorithm,it is possible not only to detect the signal of a certain cycle but also to determine the times and location of certain signals.
The second method is based on DTW,and its analysis process is shown in Figure 6.

Figure5.Signal detection method(SAX)
It makes a one-to-one comparison of the distance between signal data and each variable,and determines the closest value.In this step,the map-reduce technique is used to calculate each sensor signal’s warping distance in the Hadoop Distributed File System.

Figure6.Signal detection method(DTW)
3 Example of R&D Big Data Analysis and Application
3.1 Development of Sensor Data Prediction and Classification Models
Big data analysis is applied to sensor data that is being measured in R&D.
To develop a system that is responsible for detecting and warning of distracted driving,driving data of actual customers were measured.Customers’behaviors were recorded in the passenger seat,and the changes in driving data caused by customers’behaviors were also measured.Distracted driving is defined as activities,such as using a mobile phone,eating food and operating gadgets of the vehicle while driving(Figure 7).Twenty-five driving data measurement variables,including steering angle,vehicle speed and engine RPM,can be collected in a Controller Area Network(CAN).
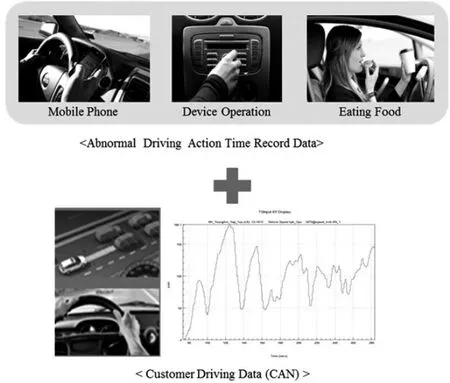
Figure7.Types of measured data
Based on collected and observed data on distractedness and driving,driving data can be divided into the data of normal driving and that of distracted driving.the time window range for dividing normal and abnormal driving is calculated based on the recorded table of the abnormal period that contained the start time and end time.
Using the sensor data analysis process presented in Section 2.4.1,firstly,basic statistics of each variable are analyzed for the dataset that have been categorized into normal and distracted driving(Figure 8).As illustrated in Table 1,Moreover,when the Coefficient of Variation(CV)and the standard deviations of steering angle and steering speed are compared,there is a difference between the two groups.Thus,they are selected as the derived variables to be used for the prediction model.

Figure8.Analysis process
The CV is defined as the ratio of the standard deviation σ to the arithmetic meanμ:

and the greater the CV,the greater the relative difference.It represents the extent of variability relative to the mean of the population.

Table1.Analysis of basic statistics
Furthermore,regarding the analysis of the correlation between a driver’s activities and the vehicle’s movement,correlation analysis is conducted for a total of 325 combinations consisting of 26 variables f normal and distracted driving data(Table2).

Table2.Comparison of correlation coefficients
The results show that,in the case of distracted driving,the coefficients decreased regarding the relations between the steering angle and road curvature,steering torque and lateral acceleration respectively,and the relation between yaw rate and road curvature,compared with normal driving signals.Through correlation analysis using CV,input variables for model development can be selected in advance.

Figure9.Analysis process(SAX)
The second stage is to develop classification models(Figure 9).Two methods are proposed for the development of classification models.Firstly the SAX-based prediction models are developed.Using SAX,data are converted into character strings,and models are developed using the value of the distance to the golden value(true value).The golden value could be extracted from the normal dataset by calculating averages between the normal data.
Secondly,a method is developed for prediction models using the CV statistics(Table 3)mentioned above.As an approach to develop a model using signal statistics,it provides a significant advantage because it is very simple and convenient.

Table3.CV Values
The types of models applied to classification are random forest,tree,Support Vector Machine(SVM),a logistic model,neural network model and naïve Bayesian model.Through the development of models,the following conclusions are drawn.
First,as the major factors(Figure 10)that influence the classification of distracted activities,five factors are selected using the models:the longitudinal distance to the vehicle in front, brake master cylinder pressure,accelerating pedal,steering speed and vehicle speed.For the final prediction model for distracted behaviors while driving,the logistic model is selected.

Figure10.Major factors
In the verification of models’accuracy (using Confusion Matrix),93%precision has been confirmed and compared with the existing algorithm(Table 4),and It is verified that the level of detection has been improved by approximately 10%.After a review of various models,the CV-based logistic regression model is selected as the most suitable,in consideration of classification accuracy.

Table4.Comparison of models’accuracy
In addition to the development of models for distracted behaviors,there are many R&D data analysis cases in which the sensor data analysis process is applied using this research.
Firstly,regarding the development of a Lane Departure Warning system(LDW),major factors that influence the classification of lane departure or change are selected.The major factors for classification models turn out to be,in sequence,road curvature,the distance to the left lane,the distance to the right lane,lateral acceleration,longitudinal acceleration and departure angle.Additionally,a Partial Least Squares(PLS)discriminant model,which determines and warns of lane departure or change,is developed,and the accuracy of this model was 88%[7].The PLS discriminant model is of interest at present regarding its accuracy.The analysis process is shown in Figure 11.

Figure 11.Lane departure or change analysis process
Secondly,as an example of big data analysis,fuel efficiency by vehicle operation condition is analyzed by using sensor data measured in the vehicle.The data are used from a Spanish road-driving vehicle and measured by three vehicles.The data from the fleet test vehicle are used.As a result of the analysis,major vehicle-driving factors that have an impact on fuel efficiency are altitude,throttle,torque requirements,pedal and vehicle speed,in sequence.Additionally,a fuel efficiency PLS prediction model is developed,and its accuracy is confirmed to be 91%[8].The analysis process is shown in Figure 12.
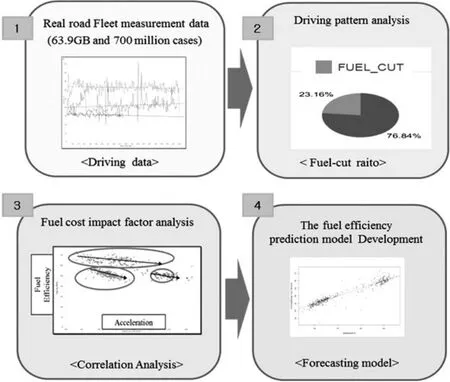
Figure12.Fuel efficiency analysis process
Thirdly,another case for big data analysis is the analysis of the optimal condition for a Diesel Particulate Filter(DPF)regeneration cycle.The data are driving data for six Israeli and Singapore taxis.According to the analysis results,major factors that influence the DPF regeneration cycle are,in sequence,temperature of engine cooling water,engine RPM,exhaust flow rate and vehicle speed.A PLS model is developed as a DPF regeneration cycle prediction model,and its accuracy is 89%.The analysis process is shown in Figure 13.
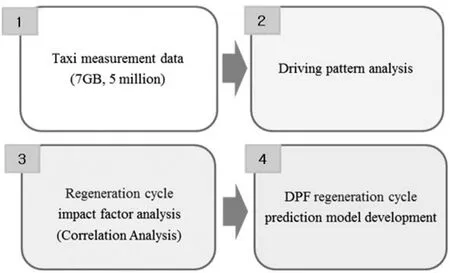
Figure13.DPF regeneration cycle analysis process
3.2 Analysis of Sensor Data Patterning and Detection
In the following is an example of the analysis of signal data being formed into patterns and detected.It is applied to determining a certain signal of the diesel engine DPF’s regeneration cycle.Figure 14 shows an actual analysis example where SAX conversion is used.In this case,an unusual signal of a certain DPF regeneration cycle is located using a motif.Also an effort is made to determine a pattern in which a certain E character string has up to three mismatches.This method helps to identify the number of times the same signals appear and their sequences.This method makes it easy to define the signals of vehicle problems and to determine how many times the signals appear.

Figure14.Motif analysis result
Another example is that a DTW-based detection method is applied to raw signal data(Figure 15).The DPF regeneration cycle signals are used and a signal that is closest to the normal signal is found.Then,the gold signal that calculated the average values among the normal signal groups is defined.Based on DTW,the warping distance to the gold signal is calculated and a signal,which is most similar to the gold signal,could befound.
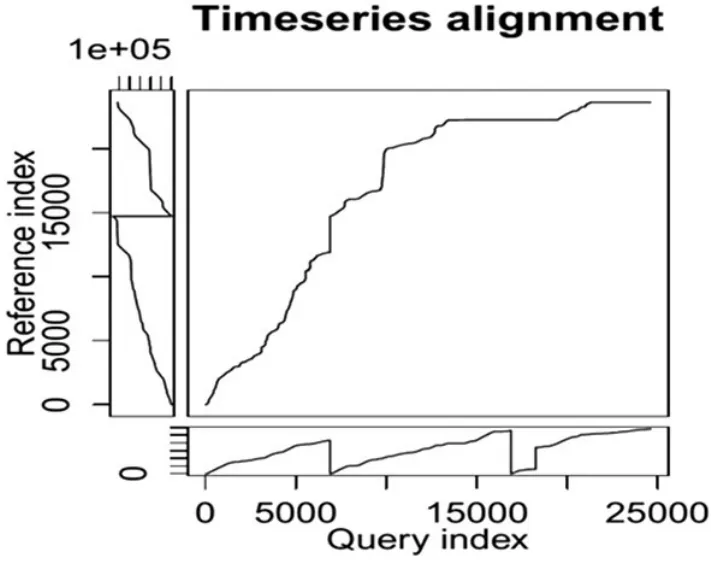
Figure 15.DTW analysis result
4 CONCLUSIONS
Type in this research,correlation analysis of signal data is conducted,prediction and classification models are developed,abnormal signal data are formed into patterns and a method to detect a certain pattern is created.Furthermore,the feasibility and utility of such analysis methods are confirmed by applying the methods to various types of data created in each area of the R&D center.Thus,the center is provided with a new way to analyze the big data.
The achievements of this research are as follows:
Firstly,regarding analyzing sensor data,which is the major form of data in R&D,the study has established an analysis process that ranges from basic analysis to prediction/classification models,and its accuracy is confirmed in addition to its utility.
Secondly,it has confirmed that in the analysis of sensor data,CV can be used as a derived variable of good use.Thus,for the future development of sensor data models,a CV-based method is recommended.
Thirdly,two analysis methods are proposed:SAX-based method and a CV statistics-based method.
Fourthly, major factors that influence the classification of distracted and normal activities are determined and a highly accurate logistic model is developed. Additionally, 93% accuracy using the verification of model accuracy is confirmed,in addition to a 10%improvement in detection,compared with existing algorithms.
Fifthly,four examples from the verification of the main factors to the development of models are showed in this paper by applying the presented analysis process to major R&Dbigdata.
Finally,using research on the methods of analyzing and detecting sensor data patterns,a SAX-based motif method and DTW-based method are proposed,which help us to detect vehicle’s abnormal signals and easily identify how many times and when the out-of-order signals appear in the data.
猜你喜欢
卫星应用(2022年7期)2022-09-05
卫星应用(2022年3期)2022-05-23
卫星应用(2022年1期)2022-03-09
科学与财富(2021年35期)2021-05-10
环球慈善(2019年6期)2019-09-25
汽车文摘(2019年3期)2019-03-04
汽车生活(2018年5期)2018-06-21
档案管理(2014年6期)2014-10-30
商品与质量·消费研究(2013年7期)2013-08-29