基于机载三维激光扫描的大豆冠层几何参数提取
2019-02-21 00:40管贤平邱白晶董晓娅薛新宇
农业工程学报 2019年23期
管贤平,刘 宽,邱白晶,董晓娅,薛新宇
基于机载三维激光扫描的大豆冠层几何参数提取
管贤平1,刘 宽1,邱白晶1※,董晓娅1,薛新宇2
(1. 江苏大学农业农村部植保工程重点实验室,镇江 212013; 2. 农业农村部南京农业机械化研究所,南京 210014)
为了实现大田大豆单株植株几何参数(高度、体积)准确获取,该文构建了基于机载激光雷达(LiDAR)的农作物表型探测系统,并开展了大田标定和探测试验。针对大田大豆垄上种植模式下地面平整度差异大、植株枝叶交接难以区分的问题,提出了一种LiDAR表型探测系统下的基于局部邻域特征分割与均值漂移算法的提取方法。在获取的点云中,首先使用基于局部邻域特征的语义分割方法提取一垄植株行,然后采用均值漂移算法提取单株植株,最后进行植株表面重建和植株几何参数统计。LiDAR表型探测系统在沿探测系统前进运动方向、垂直运动方向、垂直地面方向最大误差分别为0.58%(5.8 cm)、−1.75%(−7.0 cm)、−1.74%(−3.4 cm)。该文采用的基于局部邻域特征的分割方法,植株与地面分类的效果良好,人工统计植株数量相比,检测植株数量的平均相对误差为11.83%。相对于常用的RANSAC(random sample consensus)方法,使用该文提出的高度计算方法,大豆植株高度平均相对误差从9.05%下降到5.14%,利用alpha-shape算法重建后的冠层体积平均值为48.5 dm3。该文工作可为作物植株分割和体积统计提供借鉴。
激光;提取;数据处理;单株点云;几何参数
0 引 言
农田信息获取与分析是精准农业实施的前提[1]。作物形貌、位置信息是精确喷雾技术的基础[2],探测作物几何信息是对靶变量喷雾的重要研究内容[3]。可实现探测作物形貌信息的技术手段越来越多[4],应用于靶标作物形貌探测的技术手段主要有超声波探测、红外探测、可见光成像与图像处理、激光雷达(LiDAR)等。超声波探测在获取柑橘冠层形貌信息、计算冠层体积[5],估算果园靶标冠层密度[6]等方面得到了应用,Maghsoudi等[7]利用神经网络算法对超声波数据进行学习,实现了果树体积的可靠估计。超声波传感器成本较低,但存在靶向性低、对距离敏感、采样频率低等问题。红外探测可通过确定靶标作物的有无[8]提升变量喷雾机效果,也可与其他传感器数据结合,如颜色传感器[9]实现只对绿色植物喷雾。但红外探测受环境光干扰,稳定性不足,田间应用限制较多。可见光成像技术也被用在作物表型和参数测量中。如通过分析图像获取植株形态或表面模型信息可以优化移栽机结构与移栽时间[10]、阐明作物与环境的协同关系[11]、估算大麦生物量[12]等。但可见光成像技术对光照条件要求高,不能满足实际生产要求[13]。
激光雷达具有精度高、靶向性强、响应时间短、受光照条件影响小等特点[14],被广泛应用在树冠参数的获取[15-16]、果树生物量与产量的预测[17-19]、实时修正的靶标作物表型[20]等方面。二维激光扫描仪与亚米级全球导航卫星系统GNSS(global navigation satellite system)结合,可以获取高精度的田间作业地理信息,提升施药、灌溉、田间信息管理水平。Garrido等[21]实现了温室发育初期玉米作物形态结构重建。Sun等[22]将二维激光扫描仪与高精度(1 cm)RTK-GPS组成高通量信息获取系统实现了对棉花高度的可靠估计。Escola等[23]将实时差分GNSS与二维激光扫描仪UTM30-LX-EW数据融合得到了橄榄树冠层几何参数和结构。程曼等[24]针对花生田间特殊工作环境,设计了以二维激光扫描仪为核心的数据获取系统,通过对冠层剖面点云曲线拟合获取边界,进而获取花生高度,提高了高度获取效率。三维LiDAR具有更高数据密度获取能力,常被用于田间地理信息获取以估算靶标作物生物量。Martin等[25]将三维激光扫描仪数据融合GNSS与惯性测量单元(inertial measurement unit,IMU)绘制了小麦地图并估算了高度与体积。Ravi等[26]基于无人机与三维LiDAR构建的高通量探测系统,用于检测作物高度与冠层覆盖率的变化,绘制作物地图。
已有基于点云的获取作物高度与体积的文献中主要集中在不区分单株作物且植株无枝叶交接或地面相对平整的条件,但对于地面平整度差异大、枝叶交接较多条件下提取单株植株的文献较少。为此本文提出一种利用局部邻域特征分割与均值漂移算法的点云分割提取方法,进行大豆作物的植株与地面分割及单株提取;采用alpha-shape算法进行作物三维重建和几何参数计算。
1 材料与方法
1.1 数据获取
1.1.1 数据获取系统组成
三维激光雷达农作物表型探测系统(简称探测系统)主要由移动测量端、基准站和PC端组成。移动测量端包括激光扫描仪LASER和位姿测量单元,其中激光扫描仪采用美国Velodyne公司的VLP-16型三维激光扫描仪,位姿测量单元包括NovAtel公司的SPAN-IGM-A1型组合导航系统、GPS1000型天线、存储控制器、电台等。移动测量端主要部件参数如表1所示;基准站由北斗星通公司的C280-AT型接收机、数据记录仪、GPS1000型天线、电源等组成;PC端可通过电台实现对移动测量端的远程控制。为高效获取靶标作物信息,移动测量端搭载在大疆M600pro无人机上。为了得到田间地理环境三维点云数据,需将激光扫描仪获得的三维点云数据PCAP文件与通过后差分技术得到的位姿数据POS文件进行数据融合。但基准站与移动测量端GNSS接收机采集的原始数据需解算后才能进行GNSS与惯导系统(inertial navigation system,INS)数据的耦合。
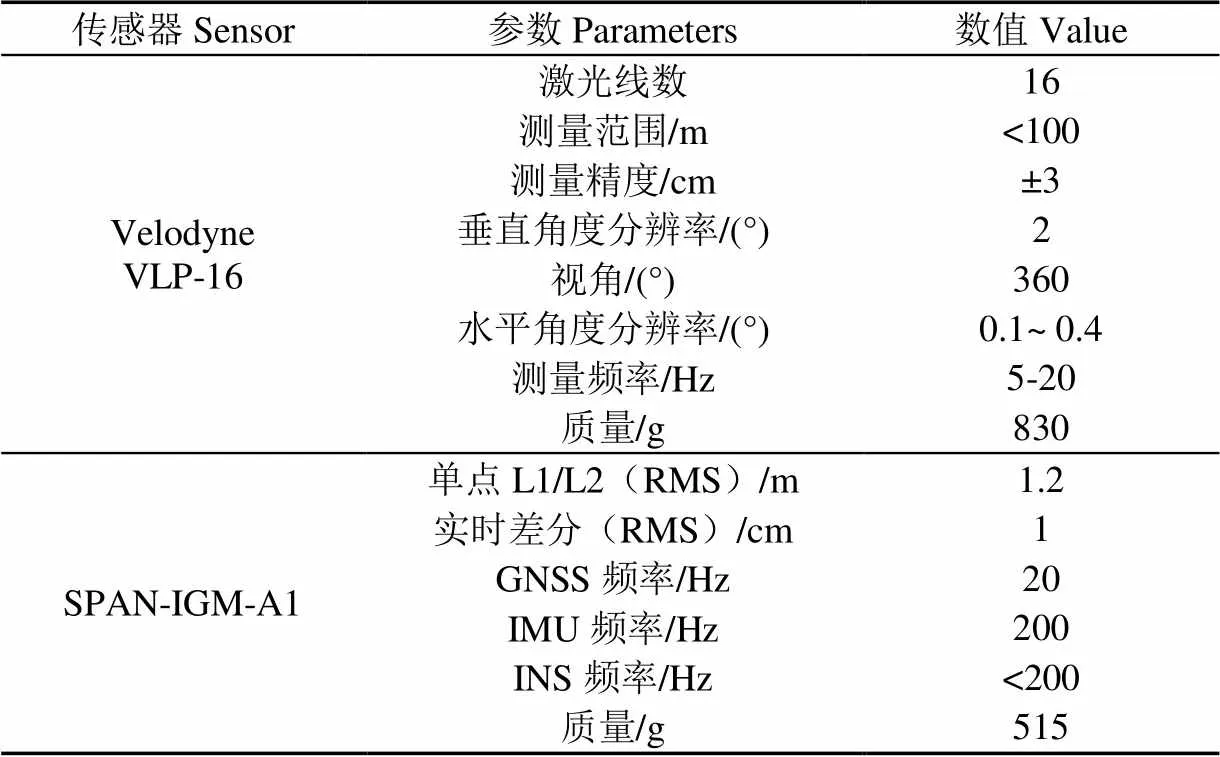
表1 VLP-16和SPAN-IGM-A1参数表
使用NovAtel公司的位姿解算软件Inertial Explorer 8.70完成数据的解算与耦合,解算后可得到GNSS数据、IMU数据、航向数据等,通过GNSS与IMU数据紧耦合得到激光扫描仪的位姿数据POS文件。使用北京北斗星通公司的点云数据处理软件Li-Acquire完成PCAP文件与POS文件的数据集成生成标准的LAS格式点云文件。数据集成流程图如图1所示。

图1 数据集成流程图
1.1.2 试验环境与方案
田间试验于2017年8月至9月在农业农村部南京农业机械化研究所白马教学科研基地(31.62°N,119.18°E)育种试验田进行,如图2所示。试验田尺寸为长度41 m,宽度18 m,共7垄,垄间有凹沟,每垄种植5行作物,株距0.45 m,行距0.55 m。
靶标作物为生长了55~60 d处于结荚期阶段的大豆。数据采集过程中,最大环境风速为1.5 m/s,无人机路径规划在飞控软件中进行设置。设置带宽为18 m,带宽重叠率为40%,无人机的水平前进速度不超过0.5 m/s,激光雷达距离地面平均高度为9.0 m,选择测距范围为2~20 m的点云数据用于分析,在18 m扫描带宽范围内,总体上扫描点密度约为1 600点/m2。

图2 田间试验区与扫描路径示意图
手动测量试验田一垄中6株大豆作物高度与体积,并与系统测量值对比。在进行田间试验同时,设置了大田数据精度验证试验方案。在试验田旁放置1块长方形板材和4根标杆,布置方式及尺寸如图3所示。
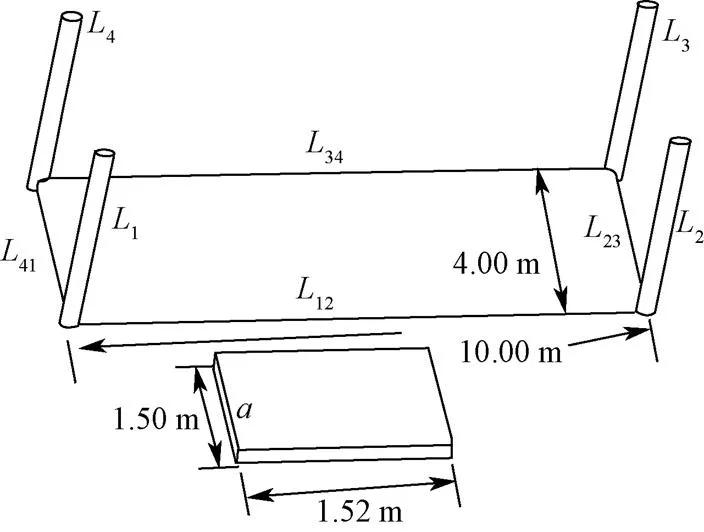
注:L1、L2、L3、L4分别为4根标杆长度,cm;L12、L23、L34、L41分别为标杆之间的距离,m;a和b分别为长方形板材宽度和长度,cm。
通过点云中12,23,34,41的测量值与手工测量值的对比,验证试验过程中系统的测量精度。其中点云测量值的获取方法是使用LiDAR360软件,手工测量数据通过卷尺测量,均测量3次并求平均值。
1.2 数据处理方法
数据处理的目标是提取LAS文件中单株作物的三维点云,并完成靶标作物的几何参数提取和三维建模。该目标分为点云数据预处理、分割地面与植株点云、获取单株大豆植株及计算单株作物冠层高度与体积。
1.2.1 点云数据预处理
由于采集的田间地理点云包含大量的非靶标作物信息和离群点,导致处理时间和难度增加。本文通过设置感兴趣区域ROI(region of interest)和基于邻域平均距离的方法[27]完成点云去噪。
1)选取ROI点云。探测系统获取的点云数据,其坐标系和田块垄方向不一致,且平面坐标数值较大,为此根据田块中心和垄走向,建立田块坐标系,将原始点云数据转换到田块坐标系下。通过设置田块坐标系下各坐标轴的上下界,选取界内点云数据得到ROI点云。

1.2.2 地面分割与作物点云提取
为了提取作物几何参数,通常采用设置分割阈值[22]或RANSAC(random sample consensus)算法[33]。但对于垄上种植模式,地面平整度差异大,设置统一阈值或使用RANSAC算法误差较大。本文提出使用基于局部邻域特征语义分割的算法,将靶标作物点云与地面点云分离。基于局部邻域特征的语义分割算法主要分为3步:


3)监督分类及评价指标。根据不同特征组合对点云分类,选取随机森林分类器对测试集数据分类标签进行预测[31]。本文选择ROC曲线的AUC值作为分类效果的评价指标。ROC的纵轴表示真正类比率,横轴表示负正类比率,AUC值为ROC曲线下的面积,数值越接近1代表分类器分类效果越好。并将分类效果与RANSAC算法的分类效果进行对比。
1.2.3 获取单株大豆植株
1.2.4 计算大豆冠层高度与体积
1)冠层高度定义与测量
本文将大豆实际株高定义为茎秆与地面交点avg至最高叶片max的距离,如图4a所示。由于激光束通过密集枝叶到达地面的概率较小,造成avg处采样频率低,本文通过avg点周围的地形估计其真值。


注:和¢分别为植株株高的实际测量值和系统测量值,cm;为植株点云的重心。
Note:and¢are the values of manual measurement and system measurement of plant height respectively, cm;is the gravity center of point cloud of plant.
图4 高度测量示意图
Fig.4 Schematic diagram of height measurement
2)冠层体积定义与测量
植株的冠层体积不包含其中的间隙,但VLP-16型激光扫描仪精度为±3 cm,难以准确探测作物叶片厚度、枝叶宽度等参数,并且由于枝叶阻挡,下层枝叶外形难以准确完整获取,无法准确获得严格意义上的冠层体积。为此本文将作物体积看为由点云边界界定的3D实体体积。三维点云是对作物体积的离散化表示,恢复作物的体积需对点云进行三维重建。本文使用alpha shape算法对作物进行三维重建,alpha shape算法是Delaunay三角剖分算法的1种扩展形式,可从散乱空间点集中求得点云轮廓[32]。
2 结果与分析
2.1 精度验证结果
系统测量的长方形板材和标杆的几何尺寸如表2所示。因部分长方形板材被作物遮挡,故只列出了边长数据,表2显示了长方形板材与标杆的系统测量值与手工测量值的对比。其中沿作物行方向即扫描前进方向(12、34)上尺寸为1 000 cm时,最大相对误差为0.58%,误差值为5.8 cm;在垂直于作物行方向(23、41)上尺寸为400 cm时,最大相对误差−1.75%,误差值为−7.0 cm;在垂直于地面方向上,尺寸为195 cm时,最大的相对误差为−1.74%,误差值为−3.4 cm。所以大田试验精度可以达到10 cm以内,空间精度关系为前进方向精度最高,垂直于地面方向与垂直于作物行方向精度接近。部分相对误差较小,一方面可能单次测量存在误差较小的情况,另一方面可能激光扫描仪在较小测距范围(<20 m)的精度较高[35]。
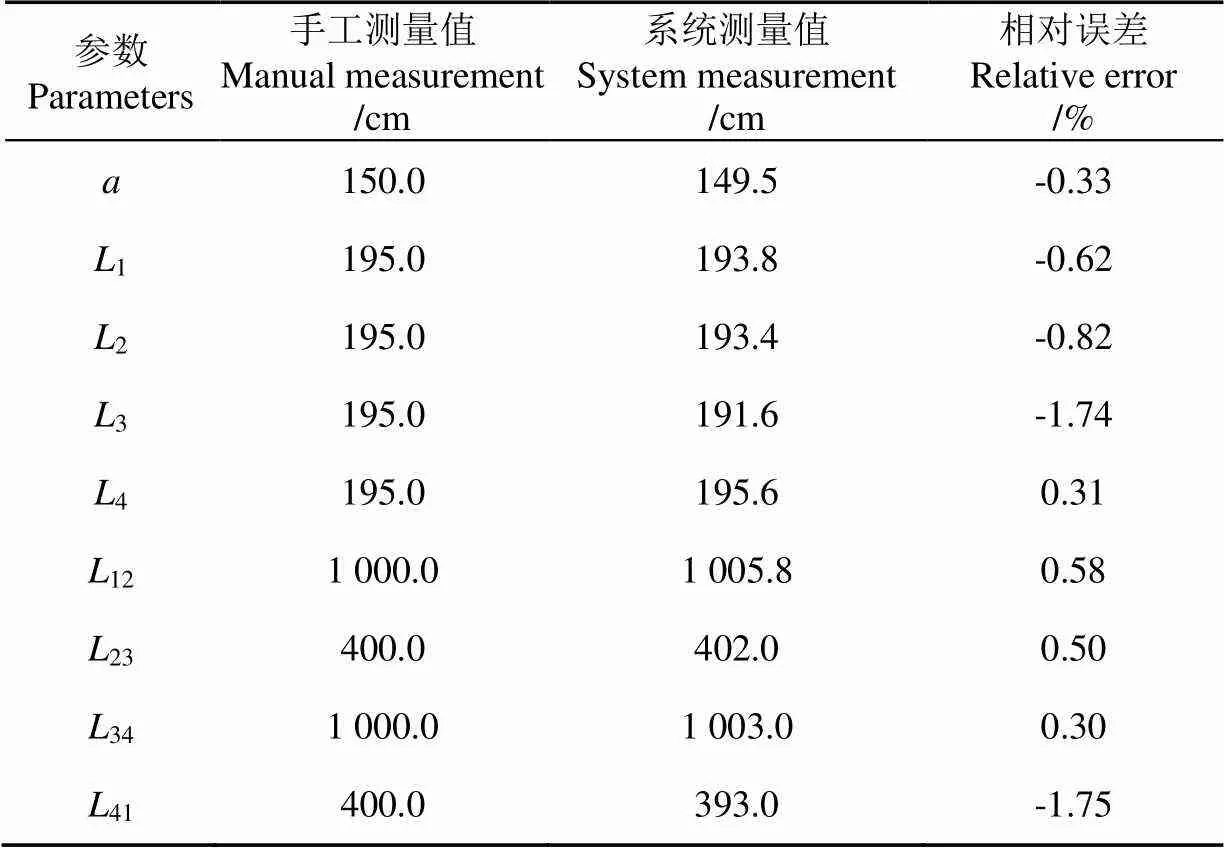
表2 长方形板材与标杆的手工测量值与系统测量值对比
2.2 提取地面结果
最优邻域初始范围设置为5~100个点。计算的最优邻域结果如图5所示。由图可知,97%的点最优邻域包含点数量小于20个。使用3D点云标注工具对点云文件进行手工标注,建立标签数据集,以衡量算法对地面检测分割的效果,标注后的训练集如图6所示,其中亮色表示作物。

图5 邻域分布柱状图

图6 训练集标记结果
本研究应用Gini系数算法、Chi-square特征算法和ReliefF算法等常用算法对26个特征进行评估,结果如图7所示。特征顺序值越小表示对应特征对点云分类效果越好,各算法选择分类效果最好的前5个特征作为分类特征组合。

图7 特征选择结果
在以上3种算法的特征组合分类的基础上,本研究同时引入随机森林方法,针对2D特征、3D特征及所有特征进行选择,同样选取分类效果最好的前5个特征作为特征组合。不同特征组合下的分类的效果及其与RANSAC分类算法效果对比如表3所示。在随机森林算法基于所有特征确定的特征组合进行分类时,分类效果的评价指标AUC值最大,为0.994,相比RANSAC算法本文方法不需人工调节参数,利于自动处理点云数据。
2.3 获取大豆单株植株结果
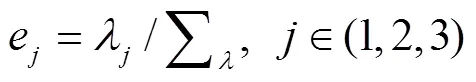
均值漂移算法需要设置的参数为带宽,因大豆作物播种时按照一定的株距与行距,故在设置带宽时考虑这些先验知识。本文大田大豆的行距为0.55 m,株距为0.45 m,设置了带宽取值区间为19~21 cm的3个梯度带宽以检测带宽与先验知识的关系。测试数据集中实际采集了121株大豆植株,每个带宽与植株数量对应关系如图8所示。分别计算各作物行检测植株数量与人工统计植株数量相对误差,分析可知,当=20 cm时,检测植株数量平均相对误差为11.83%,且分布相关性最高,为0.675。考虑到作物生长的差异性与农艺水平等因素的影响,可以猜测均值漂移用于分割单株点云的最佳分割带宽opt可在行距或株距最小值的一半附近得到。本文中最优分割带宽与猜想理论带宽误差为2.5 cm。

表3 不同算法分类结果对比
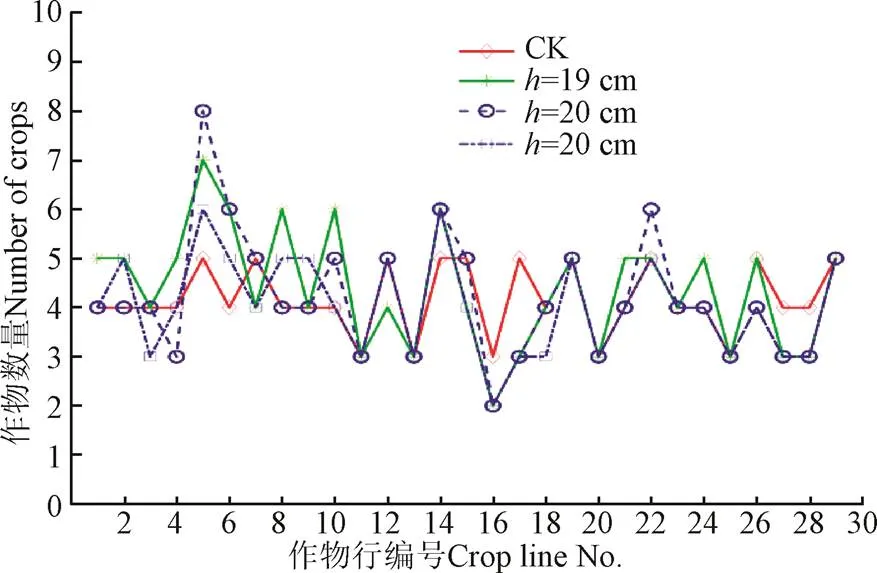
注:CK为人工统计;h为带宽。
2.4 大豆冠层高度与体积计算结果
2.4.1 植株高度结果
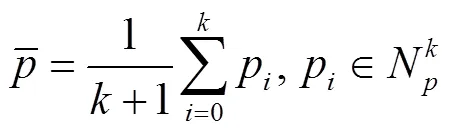
植株高度测量误差与重心投影点邻域范围的关系,如表4所示。表4分析了6株大豆植株系统测量高度与重心投影点邻域范围取值的关系。可以看出直接采用重心投影点(k=1时)时,植株高度最大相对误差出现在高度为36 cm的植株上,相对误差为17.66%,总体平均相对误差为9.05%。当采用邻近的方法计算植株高度时,k=20时,系统获得的相对误差有4株都显著下降,平均相对误差下降到5.14%;k=100时,平均相对误差下降到4.96%。虽然k=100时平均相对误差略小于k=20时,考虑到植株点云的规模较小,选择k=20作为计算植株高度时的投影点邻域范围。

表4 kter取值与相对误差关系
除了从相对误差角度阐述植株高度计算方法的准确性,本文还对比了RANSAC和阈值法[22]2种方法,结果如表5所示。使用RANSAC算法和阈值法平均相对误差分别为9.72%和31.07%,高于本文高度计算方法的相对误差。所以,使用本文方法可以较高精度计算作物高度。对一垄大豆植株的高度统计结果如图9所示。

表5 3种植株高度计算方法对比结果
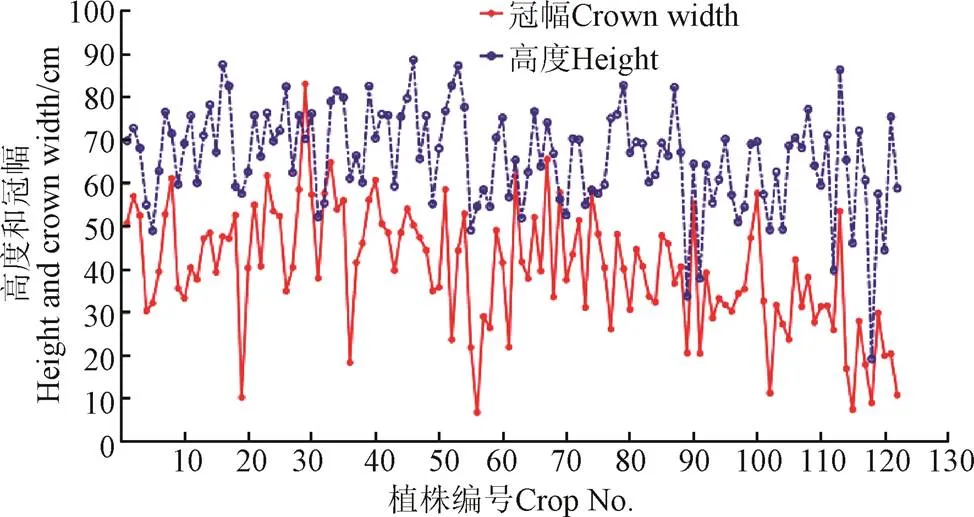
图9 植株高度与冠幅
大豆植株平均高度为65.9 cm,标准差为11.6 cm,冠幅的平均尺寸为40.1 cm,标准差为14.1 cm。数据显示植株高度与冠幅差异较大,可为变量农机提供决策信息。
2.4.2 植株体积结果
因定义冠层体积为外部轮廓所占的无空隙三维网格所占空间。所以在无空洞的情况下,选取越小,形成的网格化体积越小,越接近于真实体积。本文以单株橙树冠层体积凹度=0.75为基础[34],寻找适合结荚期大豆植株冠层的凹度值。当=1.85时,alpha shape算法重建的无缝隙包络认为是合理的表面重建,如图10所示。
使用规则几何体法(立方体法)估计作物体积,由于作物边界与规则几何体体间空隙大,造成作物体积被严重高估[36]。本文应用优化凹度值后的alpha shape算法重建了作物表面轮廓,减少了这种空隙的存在。
图11显示了立方体法和alpha shape算法对122棵大豆植株体积的统计结果。从图中可以看出立方体法计算的体积远大于alpha shape算法计算的体积,立方体法包络形成的体积平均值为125.6 dm3,后者平均值为48.5 dm3,本文计算的体积较接近植株的实际情况。但是,由于没有对大豆植株进行实际体积测量,未能将计算结果与实际测量结果进行对比,未来将对定量的分析合理凹度值下alpha shape算法所得体积与真实体积之间的关系做进一步研究。

图10 作物表面重建结果

图11 不同算法计算的单株植株体积
3 结 论
为了实现大田大豆单株植株高度与体积准确自动获取,本文对基于大田大豆三维点云的单株植株高度与体积自动提取进行了研究,提出了以一种基于点云局部特征语义分割算法与均值漂移算法的单株高度与体积准确获取的方法。结果表明:
1)本文构建的三维扫描探测系统可以提供前进运动方向、垂直运动方向、垂直地面方向分别为0.58%(5.8 cm)、−1.75%(−7.0 cm)、−1.74%(−3.4 cm)的测量精度。
2)基于2D和3D局部特征组合的方法,可以实现大田大豆植株与地面点云分类,分类效果指标AUC值为0.994。
3)在高度计算方法上,使用作物点云重心在二次拟合曲面(地面)上投影取平均值作为估计植株茎部与地面的交点计算作物高度,比直接选取高度最小值计算作物高度,平均相对误差可由9.05%下降到5.14%。
4)本文应用优化凹度值后的alpha shape算法重建了作物表面轮廓,减少了这种空隙的存在。计算的植株体积平均值为48.5 dm3,与立方体法包络法的结果相比,较接近植株的实际情况。
[1]潘瑜春,赵春江. 地理信息技术在精准农业中的应用[J]. 农业工程学报,2003,19(4):1-6.
Pan Yuchun, Zhao Chunjiang. Application of geographic information technologiesin precision agriculture[J]. Transactions of the Chinese Society of Agricultural Engineering (Transactions of the CSAE), 2003, 19(4): 1-6. (in Chinese with English abstract)
[2]王万章,洪添胜,李捷,等. 果树农药精确喷雾技术[J]. 农业工程学报,2004,20(6):98-101.
Wang Wanzhang, Hong Tiansheng, Li Jie, et al. Review of the pesticide precision orchard spraying technologies[J]. Transactions of the Chinese Society of Agricultural Engineering (Transactions of the CSAE), 2004, 20(6): 98-101. (in Chinese with English abstract)
[3]邱白晶,闫润,马靖,等. 变量喷雾技术研究进展分析[J]. 农业机械学报,2015,46(12):59-72. Qiu Baijing, Yan Run, Ma Jing, et al. Research progress analysis of variable rate sprayer technology[J]. Transactions of the Chinese Society for Agricultural Machinery, 2015, 46(3): 59-72. (in Chinese with English abstract)
[4]刘建刚,赵春江,杨贵军,等. 无人机遥感解析田间作物表型信息研究进展[J]. 农业工程学报,2016,32(24):98-106. Liu Jiangang, Zhao Chunjiang, Yang Guijun, et al. Review of field-based phenotyping by unmanned aerial vehicle remote sensing platform[J]. Transactions of the Chinese Society of Agricultural Engineering (Transactions of the CSAE), 2016, 32(24): 98-106. (in Chinese with English abstract)
[5]Tumbo S D, Salyani M, Whitney J D, et al. Investigation of laser and ultrasonic ranging sensors for measurements ofcitrus canopy volume[J]. Transaction of the ASAE, 2002, 18(3): 367-372.
[6]Li Hanzhe, Zhai Changyuan,Weckler P, et al. A canopy density model for planar orchard target detection based on ultrasonic sensors[J]. Sensors, 2016, 17(1): 31-45.
[7]Maghsoudi H, Minaei S, Ghobadian B, et al. Ultrasonic sensing of pistachio canopy for low-volume precision spraying[J]. Computers and Electronics in Agriculture, 2015, 112: 149-160.
[8]Zou Wei, Wang Xiu, Deng Wei, et al. Design and test of automatic toward-target sprayer used in orchard[C]. sprayer used in orchard[C]. Shenyang: IEEE, 2015: 697-702.
[9]李丽,李恒,何雄奎,等. 红外靶标自动探测器的研制及试验[J]. 农业工程学报,2012,28(12):159-163. Li Li, Li Heng, He Xiongkui, et al. Development and experiment of automatic detection device for infrared target[J]. Transactions of the Chinese Society of Agricultural Engineering (Transactions of the CSAE), 2012, 28(12): 159-163. (in Chinese with English abstract)
[10]刘明峰,胡先朋,廖宜涛,等. 不同油菜品种适栽期机械化移栽植株形态特征研究[J]. 农业工程学报,2015,31(增刊1):79-88. Liu Mingfeng, Hu Xianpeng, Liao Yitao, et al. Morphological parameters characteristics of mechanically transplanted plant in suitable transplanting period for different rape varieties[J]. Transactions of the Chinese Society of Agricultural Engineering(Transactions of the CSAE), 2015, 31(Supp.1): 79-88. (in Chinese with English abstract)
[11]王传宇,杜建军,郭新宇,等. 基于时间序列图像的玉米植株干旱胁迫表型检测方法[J]. 农业工程学报,2016,32(21):189-195. Wang Chuanyu, Du Jianjun, Guo Xinyu, et al. Maize crop drought stress phenotype testing method based on time-series images[J]. Transactions of the Chinese Society of Agricultural Engineering (Transactions of the CSAE), 2016, 32(21): 189-195. (in Chinese with English abstract)
[12]Juliane B, Andreas B, Simon B, et al. Estimating biomass of barley using crop surface models (CSMs) derived from UAV-based RGB imaging[J]. Remote Sensing, 2014, 6(11): 10395-10412.
[13]孙智慧,陆声链,郭新宇,等. 基于点云数据的植物叶片曲面重构方法[J]. 农业工程学报,2012,28(3):184-190. Sun Zhihui, Lu Shenglian, Guo Xinyu, et al. Surfaces reconstruction of crop leaves based on point cloud data[J]. Transactions of the Chinese Society of Agricultural Engineering (Transactions of the CSAE), 2012, 28(3): 184-190. (in Chinese with English abstract)
[14]刘慧,李宁,沈跃,等. 模拟复杂地形的喷雾靶标激光检测与三维重构[J]. 农业工程学报,2016,32(18):84-91. Liu Hui, Li Ning, Shen Yue, et al. Spray target laser scanning detection and three-dimensional reconstruction under simulated complex terrain[J]. Transactions of the Chinese Society of Agricultural Engineering (Transactions of the CSAE), 2016, 32(18): 84-91. (in Chinese with English abstract)
[15]Babcock C, Finley A O, Andersen H E, et al. Geostatistical estimation of forest biomass in interior Alaska combining Landsat-derived tree cover, sampled airborne LiDAR and field observations[J]. Remote Sensing of Environment, 2018, 212: 212-230.
[16]Méndez V, Rosell-Polo J R, Pascual M, et al. Multi-tree woody structure reconstruction from mobile terrestrial laser scanner point clouds based on a dual neighbourhood connectivity graph algorithm[J]. Biosystems Engineering, 2016, 148: 34-47.
[17]郭彩玲,宗泽,张雪,等. 基于三维点云数据的苹果树冠层几何参数获取[J]. 农业工程学报,2017,33(3):175-181. Guo Cailing, Zong Ze, Zhang Xue, et al. Apple tree canopy geometric parameters acquirement based on 3D point clouds[J]. Transactions of the Chinese Society of Agricultural Engineering (Transactions of the CSAE), 2017, 33(3): 175-181. (in Chinese with English abstract)
[18]Sanz R, Rosella J, Llorensb J, et al. Relationship between tree row LIDAR-volume and leaf area density for fruit orchards and vineyards obtained with a LIDAR 3D dynamic measurement system[J]. Agricultural and Forest Meteorology, 2013, 172(3): 153-162.
[19]Sanz R, Llorensb J, Escolà A, et al. LIDAR and non-LIDAR-based canopy parameters to estimate the leaf area in fruit trees and vineyard[J]. Agricultural and Forest Meteorology, 2018, 260: 229-239.
[20]刘慧,李宁,沈跃,等. 融合激光三维探测与IMU姿态角实时矫正的喷雾靶标检测[J]. 农业工程学报,2017,33(15):88-97. Liu Hui, Li Ning, Shen Yue, et al. Spray target detection based on laser scanning sensor and real-time correction of IMU attitude angle[J]. Transactions of the Chinese Society of Agricultural Engineering(Transactions of the CSAE), 2017, 33(15): 88-97. (in Chinese with English abstract)
[21]Garrido M, Paraforos D, Reiser D, et al. 3D maize crop reconstruction based on georeferenced overlapping LiDAR point clouds[J]. Remote Sensing, 2015, 7(12): 17077-17096.
[22]Sun Shangpeng, Li Changying, Paterson A H, et al. In-field high throughput phenotyping and cotton crop growth analysis using LiDAR[J]. Frontiers in Crop Science, 2018, 9: 16-37.
[23]Escola A, Martínez-Casasnovas J A, Rufat J, et al. Mobile terrestrial laser scanner applications in precision fruticulture/ horticulture and tools to extract information from canopy point clouds[J]. Precision Agriculture, 2017, 18(1): 111-132.
[24]程曼,蔡振江,Ning Wang,等. 基于地面激光雷达的田间花生冠层高度探测系统研制[J]. 农业工程学报,2019,35(1):180-187. Cheng Man, Cai Zhenjiang, Wang Ning, et al. System design for peanut canopy height information acquisition based on LiDAR[J]. Transactions of the Chinese Society of Agricultural Engineering (Transactions of the CSAE), 2019, 35(1): 180-187. (in Chinese with English abstract)
[25]Martin C, Morten L, Rasmus J, et al. Designing and testing a UAV mapping system for agricultural field surveying[J]. Sensors, 2017, 17(12): 2703-2722.
[26]Ravi, R, Lin Y J, Shamseldin T, et al. Implementation of UAV-Based lidar for high throughput phenotyping[C]. Valencia: IEEE, 2018: 2018: 8761-8764.
[27]夏春华,施滢,尹文庆. 基于TOF深度传感的植物三维点云数据获取与去噪方法[J]. 农业工程学报,2018,34(6):168-174.
Xia Chunhua, Shi Ying, Yin Wenqing. Obtaining and denoising method of three-dimensional point cloud data of plants based onTOF depth sensor[J]. Transactions of the Chinese Society of Agricultural Engineering (Transactions of the CSAE), 2018, 34(6): 168-174. (in Chinese with English abstract)
[28]Dittrich A, Weinmann M, Hinz S. Analytical and numerical investigations on the accuracy and robustness of geometric features extracted from 3D point cloud data[J]. ISPRS Journal of Photogrammetry and Remote Sensing, 2017, 126: 195-208.
[29]Raileanu L E, Stoffel K. Theoretical comparison between the gini index and information gain criteria[J]. Annals of Mathematics and Artificial Intelligence, 2004, 41(1): 77-93.
[30]Spolaor N, Cherman E A, Monard M C, et al. ReliefF for multi-label feature selection[C]. Fortaleza: IEEE, 2013: 6-11.
[31]Ruß G, Brenning A. Data mining in precision agriculture: management of spatial information[C]. Berlin: Springer, 2010: 350-359.
[32]Bernardini F, Mittleman J, Rushmeier H, et al. The ball-pivoting algorithm for surface reconstruction[J]. IEEE Transactions on Visualization and Computer Graphics, 1999, 5(4): 349-359.
[33]Weiss U, Biber P. Plant detection and mapping for agricultural robots using a 3D LIDAR sensor[J]. Robotics and Autonomous Systems, 2011, 59(5): 265-273.
[34]Colaço A, Trevisan R, Molin J, et al. A method to obtain orange crop geometry information using a mobile terrestrial laser scanner and 3D modeling[J]. Remote Sensing, 2017, 9(8): 763-784.
[35]Heinz E, Eling C, Wieland M, et al. Development, calibration and evaluation of a portable and direct georeferenced laser scanning system for kinematic 3D mapping[J]. Journal of Applied Geodesy, 2015, 9(4): 227-243.
[36]Yan Zhaojin, Liu Rufei, Cheng Liang, et al. A concave hull methodology for calculating the crown volume of individual trees based on vehicle-borne LiDAR data[J]. Remote Sensing. 2019, 11(6): 623-642.
Extraction of geometric parameters of soybean canopy by airborne 3D laser scanning
Guan Xianping1, Liu Kuan1, Qiu Baijing1※, Dong Xiaoya1, Xue Xinyu2
(1.,,,212013,; 2.,,210014,)
Accurate acquisition and analysis of crop geometric information is an important basis for the implementation of precision agriculture. Canopy height and volume are important decision parameters for variable sprayer application rate. In the field environment, the large change of ambient light has an important influence on the measurement of canopy geometry information by sensors. At the same time, there are few researches on the problems of remove the effect of ground roughness and difficulty in distinguishing individual plants due to branches and leaves crossing under the ridge planting mode of field soybean. Therefore, it is necessary to design an information acquisition system that is less affected by light conditions and an algorithm to improve the ability to extract geometric information from individual crops. In this study, a crop phenotype detection system based on airborne lidar was constructed and its accuracy was verified. A method of extracting individual plant based on local geometric feature segmentation and mean shift algorithm was proposed. In the process of soybean plant and ground classification, firstly, the local geometric features constructed in the optimal neighborhood are classified into 2D and 3D local shape features according to their dimensions. Secondly, in order to select 5 feature combinations that are strongly related to classification, all features were evaluated using Gini index algorithm, Chi-square algorithm, ReliefF algorithm, and random forest method. Finally, according to different feature combinations, a random forest classifier is selected to predict the test set data. In the process of extracting a single soybean plant, the point cloud data of different plants were used to obtain the point cloud data of a single plant using the mean shift algorithm to complete the extraction of a single soybean plant. In the process of obtaining geometric information of single plants, the height of plants was defined as the height difference from the intersection point of soybean stem and ground to the highest point of crops. In actual measurement, because the laser beam was blocked by branches and leaves, it is difficult to obtain the intersection point of soybean stem and ground, so the paper used the method of projecting the center of gravity of single point cloud to the ground fitting surface to estimate the intersection point. Furthermore, the plant height of single plant was obtained by subtracting the estimated intersection point from the maximum point. The experimental results showed that the maximum relative errors of the lidar scanning measurement system along the carrier moving direction, vertical moving direction and vertical ground direction were 0.58% (5.8 cm), −1.75% (−7.0 cm) and −1.74% (−3.4 cm), respectively. In the process of soybean crop and ground classification, the AUC (area under curve) value of the classification index ROC (receiver operating characteristic) curve was 0.994, achieving a good classification effect based on feature combination which was selected from 26 features using random forest algorithms. The relative error was 11.83% between the number of artificially counted plants and the number of manual measurements, and the distribution correlation was the highest with0.675 when the mean shift algorithm parameter is 20 cm. The average relative error of the height estimated method in this paper was 5.14%, which was better than RANSAC algorithm. This paper can provide reference for crop segmentation and yield statistics. Future research should focus on converting the obtained target crop information into a prescription map and storing it in a server for application in online spraying.
laser; extraction; data processing; point cloud of single crop; geometric parameters
管贤平,刘 宽,邱白晶,董晓娅,薛新宇. 基于机载三维激光扫描的大豆冠层几何参数提取[J]. 农业工程学报,2019,35(23):96-103.doi:10.11975/j.issn.1002-6819.2019.23.012 http://www.tcsae.org
Guan Xianping, Liu Kuan, Qiu Baijing, Dong Xiaoya, Xue Xinyu. Extraction of geometric parameters of soybean canopy by airborne 3D laser scanning[J]. Transactions of the Chinese Society of Agricultural Engineering (Transactions of the CSAE), 2019, 35(23): 96-103. (in Chinese with English abstract) doi:10.11975/j.issn.1002-6819.2019.23.012 http://www.tcsae.org
2019-05-11
2019-10-07
国家重点研发计划项目课题(2017YFD0701403)
管贤平,副研究员,主要从事精确施药技术研究。Email:xpguan@ujs.edu.cn
邱白晶,教授,博士生导师,主要从事农业植保机械领域研究。Email:qbj@ujs.edu.cn
10.11975/j.issn.1002-6819.2019.23.012
S24
A
1002-6819(2019)-23-0096-08
猜你喜欢
南方农业(2022年17期)2022-10-21
农业科技通讯(2022年7期)2022-07-19
作物杂志(2022年3期)2022-07-06
中国农业信息(2022年1期)2022-05-25
安徽农学通报(2022年6期)2022-04-07
农业机械学报(2021年11期)2021-12-07
今日农业(2020年20期)2020-12-15
今日农业(2020年17期)2020-12-15
干旱地区农业研究(2020年4期)2020-09-22
世界农药(2019年4期)2019-12-30