
Preliminary investigation on electrothermal instabilities in early phases of cylindrical foil implosions on primary test stand facility∗
2019-02-25 07:22GuanqiongWang王冠琼DelongXiao肖德龙JiakunDan但家坤YangZhang张扬NingDing丁宁XianbinHuang黄显宾XiaoguangWang王小光ShunkaiSun孙顺凯ChuangXue薛创andXiaojianShu束小建
Chinese Physics B 2019年2期
Guanqiong Wang(王冠琼),Delong Xiao(肖德龙),Jiakun Dan(但家坤),Yang Zhang(张扬),†,Ning Ding(丁宁),Xianbin Huang(黄显宾),Xiaoguang Wang(王小光),Shunkai Sun(孙顺凯),Chuang Xue(薛创),and Xiaojian Shu(束小建)
1 Institute of Applied Physics and Computational Mathematics,Beijing 100088,China
2 Institute of Fluid Physics,Chinese Academy of Engineering Physics,Mianyang 621900,China
Keywords:Z-pinch,electrothermal instability,magnetohydrodynamics(MHD)simulations
1.Introduction
With the development of pulsed power technology,the fast Z-pinches could produce 1.8 MJ of soft x-rays with peak powers greater than 200 TW in a pulse of 4.5-ns duration,using cylindrical nested wire-array of fine metal wires made of tungsten carrying a current rising to 20 MA over 100 ns on the Z machine at Sandia National Laboratories.[1]Such an intense shot-pulse x-ray source can be employed to indirect drive inertial confinement fusion(ICF),like the dynamic hohlraum.[2]Meanwhile,the Z-pinch also shows the potential of direct drive ICF[1,3-7]due to the huge magnetic pressure and the plenty of driven energy,such as the recent magnetized liner inertial fusion(MagLIF)concept.[6,8]Unfortunately,fast Z-pinches are inherently hydrodynamically unstable and are predominantly susceptible to the magneto-Rayleigh-Taylor(MRT)instability,[9-11]which occurs when a light fluid(driving magnetic pressure)is pushing against a heavy fluid(liner plasma)and seriously decreases the implosion quality.
In the experiments of MagLIF-relevant aluminum liner implosions on the Z facility,[12,13]the MRT instability seeded by machining sinusoidal perturbations(λ =200 µm,amplitude=10µm)grew to an amplitude of 500µm.However,in the same shot,perturbations from the flat region(perturbed only by surface roughness with an initial amplitude of 60-nm root-mean square)grew to an amplitude of 70µm at the identical time,i.e.,the increment of perturbations from the ‘smooth’surface was over 20 times greater than that from the sinusoidal seeded region.In addition,the comparisons of imploding Beryllium liner experiments[14,15]with magnetohydrodynamics(MHD)simulations revealed that the good agreement depended on how to model the liner’s initial outer surface.
Simulations[16,17]and experiments in solid rods[18-20]and imploding liners[21]over the past several years suggested that the electrothermal instability(ETI),rather than the liner surface roughness,played an important role in seeding MRT instability.The ETI[16-18,22-25]is caused by the inhomogeneous Joule heating due to the characteristic relation between the resistivity and the material temperature.The dispersion relation[22]of ETI reveals that the instability structure is dependent on the derivative of the resistivity with respect to temperature.When the resistivity decreases with temperature(∂η/∂T < 0),such as in a plasma with Spitzer-like resistivity,axially oriented overheated “ filaments”can grow.On the other hand,when the resistivity increases with temperature(∂η/∂T > 0),such as for a metal in solid,liquid,and(nonionized)vapor states,electrothermal instabilities can form azimuthally correlated “striations”perpendicular to the flow of current,which are usually observed at the early stage of Z-pinch implosions.Since the striation form of ETI has the same orientation of wave vector as the MRT modes,ETI perturbations may couple to the subsequent MRT instability growth.
Besides the thick liners for MagLIF where the aspect ratio(initial outer radius divided by initial wall thickness)is less than 10,experiments of copper cylindrical foil implosions(1.5µm in thickness and 6666.7 in aspect ratio)carried out by Nash et al.[26]indicated that the axial perturbations were clear just before the load is imploded,however,what physics caused these perturbations was not discussed.It is supposed that ETI is also the main mechanism to determine the axial perturbations in the early phases of thin liner implosions.In contrast to the thick liner,the thickness of the thin liner is much less than the skin depth of the proposed current pulse,so there might be a difference of ETI growth in the two types of liner.
Recently,the experiments on aluminum cylindrical foil implosions were performed for the first time on the primary test stand(PTS)facility.[27]The 2-µm-thick foil was wrapped into a cylinder with one turn,so the cylindrical foil was also called the thin liner here.The liners are 15 mm in height,2µm in thickness,and 12.8 mm in diameter.From the laser shadowgraph images,it is seen that axially oriented perturbations had been visible and striated before the liner’s acceleration.It is important to interpret the experimental observations and explore the role of ETI in the formation of these striated structures at the early stage of thin liner implosions on the PTS facility.In order to investigate the evolution of ETI during the early plasma formation,two-dimensional(2D)(r,z)simulations are performed in this paper.
This paper is organized as follows.Section 2 describes the physical model in the code,and the experiments of thin aluminum liner implosions on the PTS facility are shown in Section 3.Section 4 presents the MHD simulations for electrothermal instabilities.Finally,the conclusions are given in Section 5.
2.Physical model
In order to describe the plasma formation at early times and the electrothermal instability,the resistive MHD model is employed.The governing equations can be written as

where ρ,p,and ε represent mass density,thermal pressure,and internal energy density,respectively.B is the magnetic field,E is the electrical field,J is the current density,υ is the fluid velocity,µ0is permeability,and η is the electrical resistivity.Note that the above equation set is not closed unless the equation of state is included.Obviously,the ideal gas approximation is not valid during the solid and liquid phases.Thus the equation of state should be modified to emulate the behavior of the condensed states of materials.In this work,we use MPQeos-JWGU[28]to generate tables in the SESAME-301 format which determines the internal energy and pressure as functions of the density and temperature.Figure 1 shows the thermal pressure of aluminum calculated by this model as a function of density for various temperatures.

Fig.1.Thermal pressure versus density for various temperatures provided by MPQeos-JWGU.The unit 1 bar=105 Pa.
It is essential to obtain the accurate electrical resistivity in order to calculate the Joule heating and the diffusion of magnetic field.Here,we adopt Lee and More’s model,[29]which spans a wide range of different material parameters and states.Figure 2 shows the dependence of the electrical resistivity of aluminum on the temperature for different densities.It can be seen that the derivative of the resistivity with respect to temperature changes sign from the state of high density with low temperature to the plasma phase with higher temperature as the material is heated and expands.
We use a 2D Eulerian MHD code(ZEUS-2D)[30,31]to realize the models mentioned above.Originally,the resistive effect was not considered in this code and the ideal MHD equations were solved explicitly by the operator split scheme.We add the magnetic field diffusion module with the implicit scheme in the code.Here,the radiation transport is not taken into account because of the relatively low temperature at the early stage of Z-pinch implosions.Periodic boundary conditions are used at the axial boundaries.In recent experiments on the PTS facility,the thickness of liners is much less than the initial radius,and the radial width of cells must be small enough to allow the solid foil to be resolved.On the other hand,the number of cells cannot be much too large due to the limitation of the computational resource.Thus,the radial computational region(from R=6.15 mm to 6.56 mm)is set to be near the initial position of liners,but not including the pinch axis.At the radial boundaries,free flow conditions are used.Note that the material strength is not modeled in the code,and the thermal pressure cannot be balanced with the stress in the solid state.Consequently,the motion of load is set to be frozen artificially until the load temperature is higher than the melting temperature.

Fig.2.Resistivity of Al as a function of temperature for several densities taken from Lee and More’s model.
3.Experiments
In experiments of cylindrical foil implosions on the PTS facility,the 2-µm thick liners are made of aluminum with a diameter of 12.8 mm(15 mm in length and 2.20 mg/cm in linear mass density).Here,shot 0319 with the peak current of 6.7 MA and the 10%-90%current rise time of 58 ns is analyzed,since more diagnostic images are taken for this shot at early times,which is beneficial to studying the early phenomena.The waveforms of current and radiation power are shown in Fig.3(a),where the peak power is at time t=135 ns.
The four-frame laser shadowgraph images with 6-ns frame-interval,150-ps exposure time,and 25-µm resolution are used to capture the early behavior of the load,as shown in Fig.3.At 71.7 ns,the small perturbations with axial size close to the resolution limit of the laser shadowgraph emerge on the load surface,and these striation-like structures are perpendicular to the drive current.It is also clear that a significant amount of mass still exists at the initial location(R=6.4 mm)indicated by the dashed lines,which means that the bulk liner is almost at rest.Thus,it is inferred that the MRT instability has not taken place.As mentioned above,ETI can produce the alternating hot and cold azimuthally correlated bands,thus the perturbation in both mass density and interface position would be created.After that,as the instabilities develop,the amplitude of perturbations increases obviously and some spikes appear around the initial position of liner(the dashed red line).By 89.7 ns,most of the spikes have moved to the left of the dashed line,and the position of the foil border in the laser shadowgraph image is roughly between r=6.1 mm and 6.2 mm(it is hard to recognize the load-vacuum boundary accurately because of the instability structures),which means the liner is imploding.

Fig.3.(a)Experimental drive current(solid line)and radiation power(dashed line)as a function of time for shot 0319.(b)Laser shadowgraph images at the measured times;timing relative to the start of current is indicated on each shadowgraph where the red dashed line represents the initial position of liner,and the black and green parts represent the liner region and the vacuum,respectively.The anode is on the top of shadowgraph,and the cathode is on the bottom.
4.Simulations of early plasma formation
A series of MHD simulations using experimental parameters have been performed with modified ZEUS-2D.The initial calculation conditions are set as follows:in the liner region,the temperature and density are 350 K and 2.7 g/cm3,respectively;the rest region(including inside and outside of the liner)is labeled as the“vacuum”where the temperature is still350 K;however,the density is10-6g/cm3.In the vacuum,an artificially high resistivity is given,so that this region can remain almost current free.In order to ensure that the number of cells is sufficient to resolve the liner and the width of cells is not too small and to increase the runtime dramatically,the radial width of cells is set to 0.33µm near the liner center and increases with radius as a fixed ratio 1.08.The radial grid with 105 cells is from R=6.15 mm to 6.56 mm.
4.1.One-dimensional(1D)simulations
In order to illustrate the evolution of the thin liner under Joule heating in the absence of complex instabilities,the simulations without initial perturbations are run at first.Due to the cylindrical symmetry,the physical quantities would be always uniform along the axis,and these simulations become actually one dimensional.The liner thickness is so small that the skin time τskin= µ0L2/η is very short(approximately 0.5 ns),where η is the resistivity and L is the characteristic length.In other words,it only takes 0.5 ns until the magnetic field penetrates the load completely.After that the current would flow uniformly over the cross section,both the inner and the outer edges of liner would experience almost the same Joule heating.During the first 21 ns,the liner temperature gradually increases and the liner remains stationary.Once the melting temperature isreached,the load begins to expand quickly.Figure 4 shows the radial profiles of some physical quantities at 55 ns,including temperature,density,current density,thermal pressure,and magnetic pressure.The density at the central position(R=6.4 mm)has decreased by an order of magnitude from the initial density,and the temperature increased to above 1 eV.During this period,the density in the central region is high enough to cause the relatively low resistivity,consequently the current density in this region is still large.However,the peak of current density has been located at the outer position,which means that with the formation of a conducting plasma corona,the current is shunted gradually into the plasma with low resistivity.In other words,the skin effect appears as the liner expands.

Fig.4.Radial profiles from a simulation of thin aluminum liner at 55 ns.
By 72 ns,the radial size of liner has exceeded 300µm,as shown in Fig.5.Note that the liner’s inner interface has a higher expansion level than the outer interface,which is constrained by the increasing magnetic pressure.As the liner expands,the current is further shunted outward and the skin effect is identified again.Figure 5 also indicates that the liner just starts to implode as a whole and most of the mass is still at the initial position,which is similar to what is shown in the laser shadowgraph image at 71.7 ns.After that,since the magnetic field in the outer regions is sufficiently large,the liner implosion becomes obvious in both laser shadowgraph images and 1D simulations.
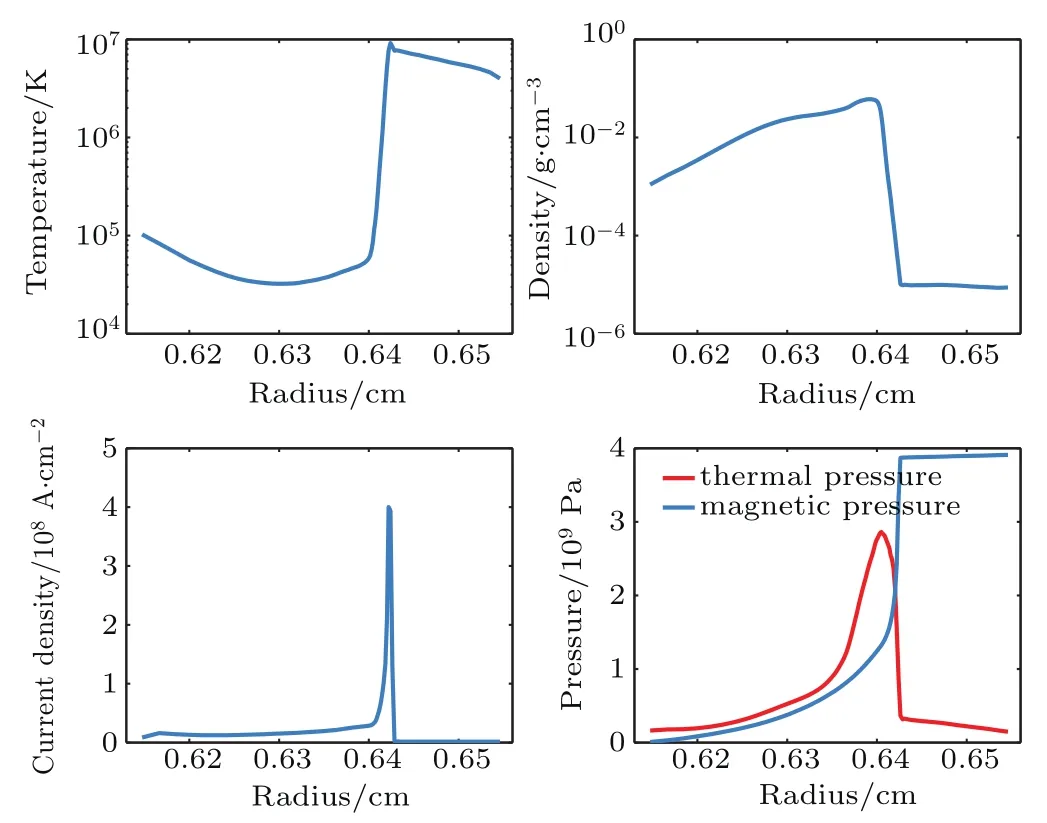
Fig.5.Radial profiles from a simulation of thin aluminum liner at 72 ns.
4.2.2D simulations
For the r direction,the initial conditions of 2D simulations are the same as those of 1D simulations mentioned above.Furthermore,the axial grid should be set in the 2D simulations,we use the mesh with 80 cells each 1.25-µm long,i.e.,with an axial length of 100µm,and a random density perturbation of 5%is used to initiate the instability growth.We also have tried to set a different perturbation level,such as 1%and 3%.In these simulations,only the initial perturbation amplitude varies,and the results show that there were no essential distinctions for the instability development and the characteristic wavelength,in agreement with Ref.[16].
Figure 6 shows the density and temperature(Temp)maps at 55 ns from the 2D simulation,in which the axial structures of instabilities have been evident.Due to the pressure equilibrium,density and temperature perturbations have nearly opposite phases,i.e.,a maximum density corresponds to a minimum temperature,which is in agreement with Oreshkin’s model.[23]
Previous studies[17,20]indicated that ETI could provide a seed for the subsequent MRT instability because the wave vec-tor of striations of ETI was consistent with that of MRT.In the 2Dsimulation,itisalso found thatETImay couple to the MRT instability,as shown in Fig.7.At 72 ns,the liner material as a whole has been slightly accelerated radially inwards,and the dense material with highly developed striations tends to imprint its structure onto the low density plasma.Consequently,ETI seeds the MRT instability which increasingly dominates the bulk implosion dynamics.Due to the limitation of the grid size,the calculation stops at 72 ns.
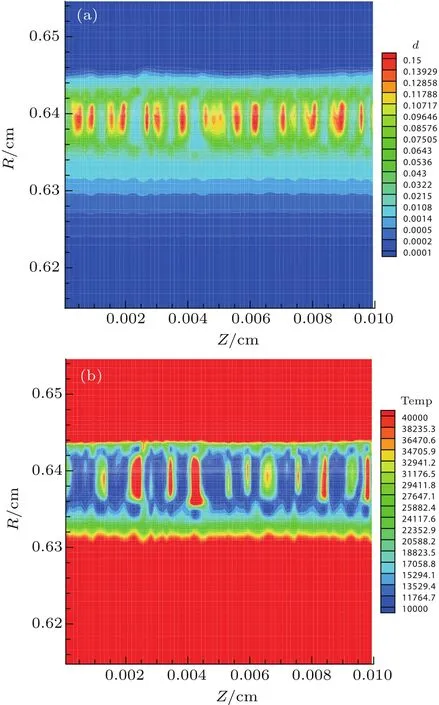
Fig.6.Contours of density(in units of g/cm3)(a)and temperature(in unit of K)(b)from a 2D(r,z)simulation of thin aluminum liner at 55 ns.
In order to extract wavelength components,a fast Fourier transform(FFT)is applied to the radially averaged temperature perturbations.Figure 8 shows the instability spectrum at two times,when the bulk liner plasma almost stays at its initial position.At t=55.0 ns,the characteristic wavelengths of instabilities are between 8.3µm-20.0µm,and the λ=10.0µm mode has the largest amplitude.As predicted by Oreshkin’s theory,[23]for the majority of metals in condensed state,the ETI has the minimum wavelength λmin=2π[κ(∂η/∂T)-1]1/2/J,and the short wavelength modes with λ<λminare suppressed because of the thermal conductivity κ.Consequently,by using the constants of aluminum in Table 1 of Ref.[23],the characteristic scales of ETI are about 10µm.Furthermore,from the more detailed calculations of the integral ETI growth,Oreshkin obtained that the wavelength of the fastest growing modes were 1µm-20µm(Fig.8 of Ref.[22]),which agrees qualitatively with our simulations.
As instabilities develop further,the dominant wavelength tends to be longer and becomes 33.3µm by 72.0 ns.The transition from short to long wavelengths may be attributed to the inverse cascade process[32]of MRT instability,since the low density plasma in the outer region has accelerated inward in this process.In addition,how to reduce ETI is still an open question.Although the dielectric coatings can mitigate the density perturbation arising from ETI,[20,33]the coatings may be not beneficial to the x-ray radiation and yields because the load mass is increased.Recently,some experiments based on the MagLIF concept indicated that the external axial magnetic field caused the helical instability structures and the reduction in overall instability amplitude,[34]however,the effect of the axial magnetic field on ETI needs to be further investigated.
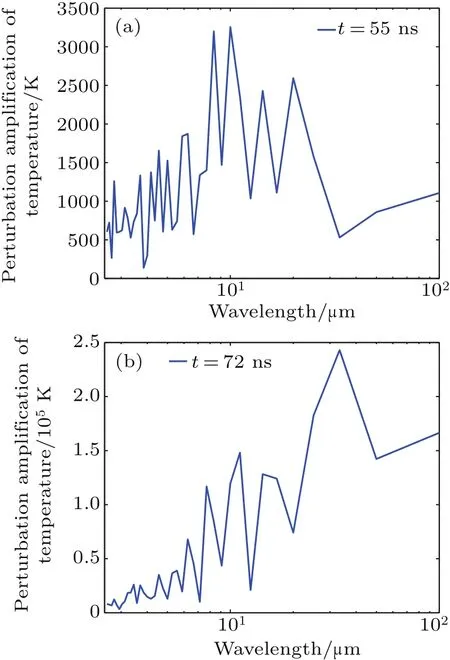
Fig.8.Fourier transforms of the radially averaged temperature perturbations plotted at(a)55 ns and(b)72 ns.
5.Conclusions
The axially oriented instability structures have been observed at the early stage of cylindrical aluminum foil implosions on the PTS facility.We have performed a 2D(r,z)MHD code to simulate the thin liner behavior in the early phases based on the PTS experimental conditions.In the absence of initial perturbations,it is illustrated that the liner expands and the density drops fast;meanwhile,the current density is gradually shunted to the outer regions where the resistivity is relatively low since the surface plasma with low mass density is heated rapidly.When the magnetic pressure in the outer regions is sufficiently high,the global implosion would start.Additionally,the simulations with random density perturbations have been performed to describe the evolution of instabilities.As the liner is Joule heated nonuniformly and expands,the axial striation-form structures produced by ETI can be identified by the density and temperature maps.The range of dominant wavelength is between 8.33µm and 20.0µm,which agrees with the theoretical predictions qualitatively.It is also interesting to see that striations may naturally couple to the subsequently MRT instability at the end of the 2D simulation,when the liner starts to implode as a whole.Due to the limitation of diagnostics,the experimental results have not been compared with simulations quantitatively.In PTS experiments on the aluminum liner implosions,only the laser shadowgraph system could obtain the relatively available images showing the behavior of the liner in the early times.Other diagnostics,like the x-ray emission and extreme ultraviolet(XUV)self-emission images,hardly resolve the early instability structures because the liner temperature is relatively low during the early phases.
Acknowledgment
The authors would like to thank all colleagues of experimental teams and operation teams from the Institute of Fluid Physics,the Institute of Nuclear Physics and Chemistry and the Research Center of Laser Fusion,Chinese Academy of Engineering Physics(CAEP).
猜你喜欢
基层中医药(2022年1期)2022-07-22
Chinese Physics B(2022年5期)2022-05-16
作文周刊·小学二年级版(2018年32期)2018-11-26
作文周刊·小学一年级版(2018年21期)2018-09-10
微型小说选刊(2016年2期)2017-01-18
作文周刊·小学一年级版(2016年9期)2016-05-10
三月三(2015年10期)2015-10-20
小天使·一年级语数英综合(2014年7期)2014-06-26
小小说月刊·下半月(2014年3期)2014-05-14
语文教学与研究(2014年9期)2014-02-28

- Chinese Physics B的其它文章
- Physics of quantum coherence in spin systems∗
- Recent progress of infrared photodetectors based on lead chalcogenide colloidal quantum dots∗
- Progress in quantum well and quantum cascade infrared photodetectors in SITP∗
- Recent advances in Ga-based solar-blind photodetectors∗
- Development of long-wavelength infrared detector and its space-based application requirements∗
- Transition of photoconductive and photovoltaic operation modes in amorphous Ga2O3-based solar-blind detectors tuned by oxygen vacancies∗